Automatic eMail for Security Validation of SAP Systems…

In a similar fashion to setting up email notification for system health check reports, you can also setup Automatic eMail for Security Validation of SAP Systems. For this you need a guided procedure that can run a security validation policy instead of running the system health check.

In our previous blog we have explained how you can setup the Security Validation policy.

Follow the following steps to create the guided procedure that can automatically execute the policy check on your SAP systems.

Creating Guided Procedure for Configuration and Security Analytics

For creating the guided procedure navigate to the Guided Procedures app in the Focused Run launch pad.

In the Guided Procedures app navigate to the Catalog page and click on the sign to create a new Guided Procedure.

In the pop-up provide a name and description for the guided procedure and click on Create.

Back in the catalog page, click on the newly created guided procedure name to open it in edit mode.

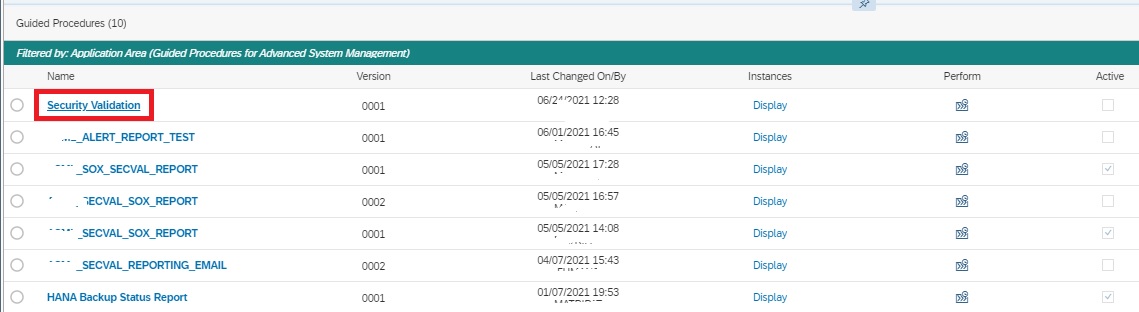
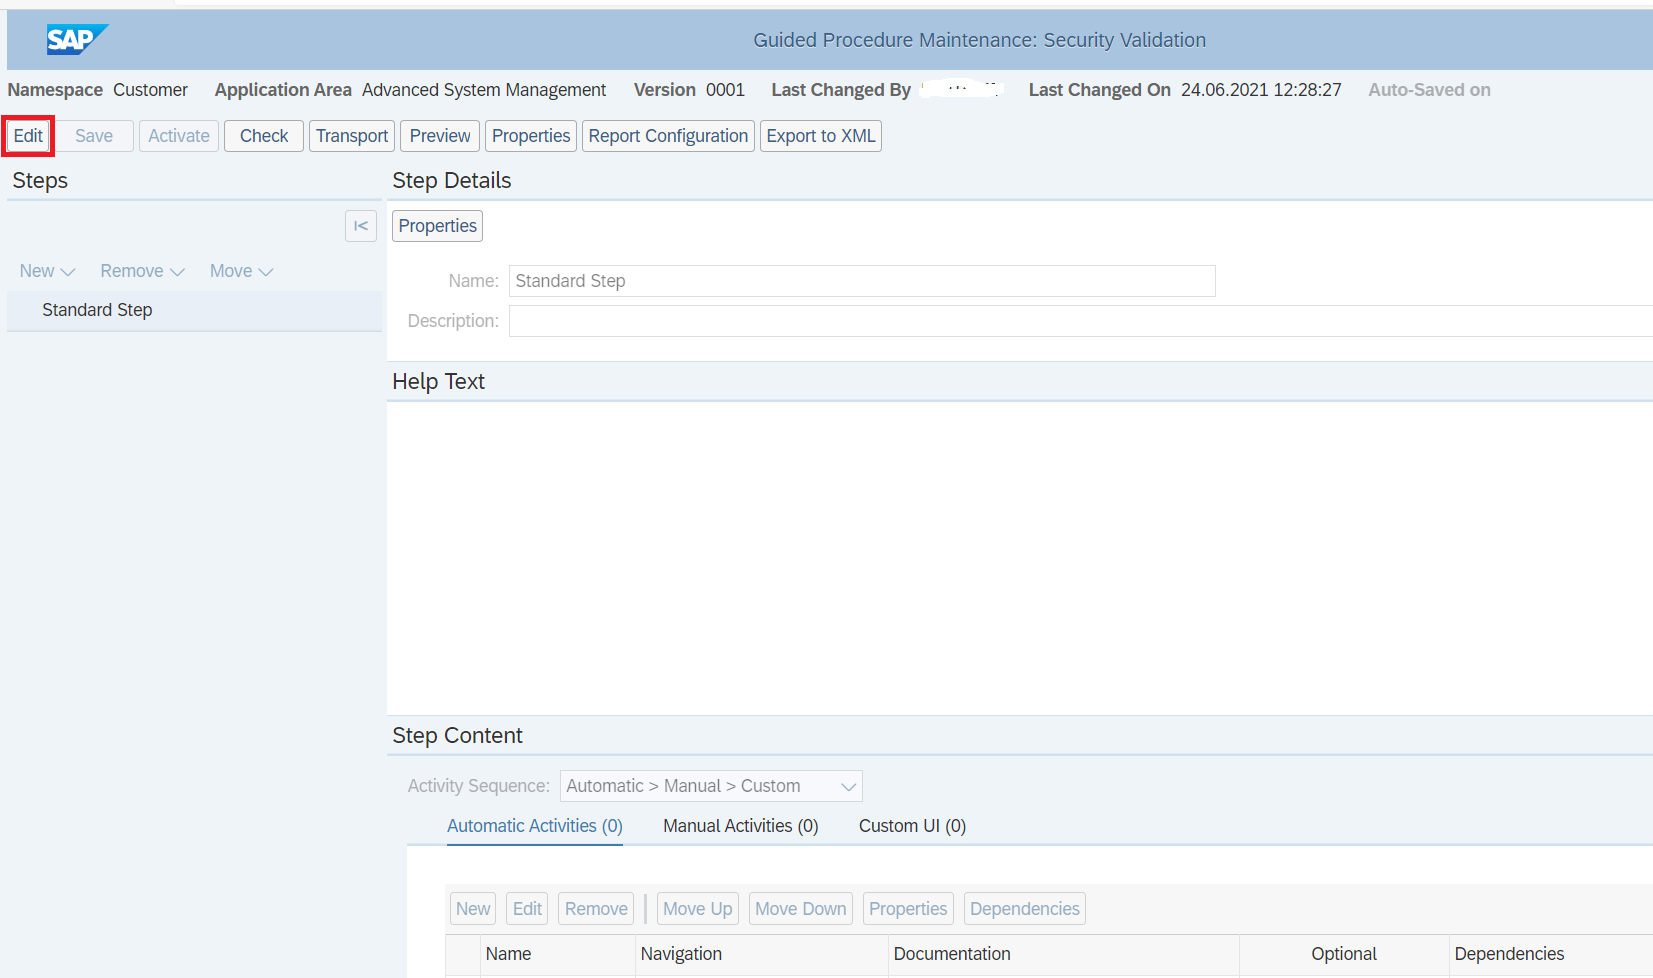
The guided procedure will now open in a new tab in the browser. Click on the edit button to start editing the guided procedure.

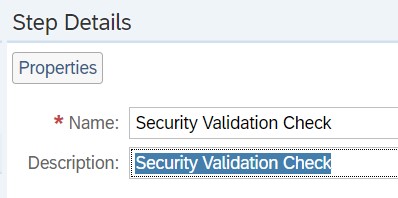
Now you need to add a automatic step to the guided procedure that will execute the security validation policy. For this, in the Step Details section, enter a step name and description.

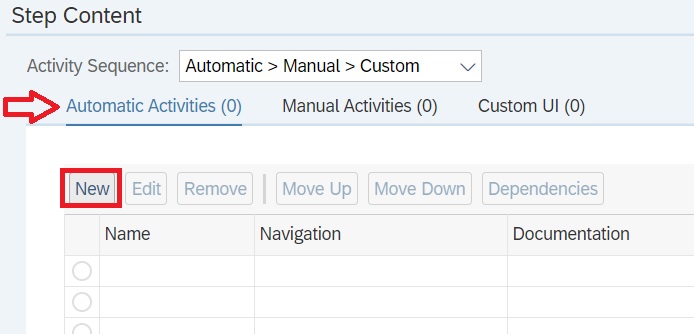
Navigate to Step Content block. In the Automatic Activities tab and click on New.

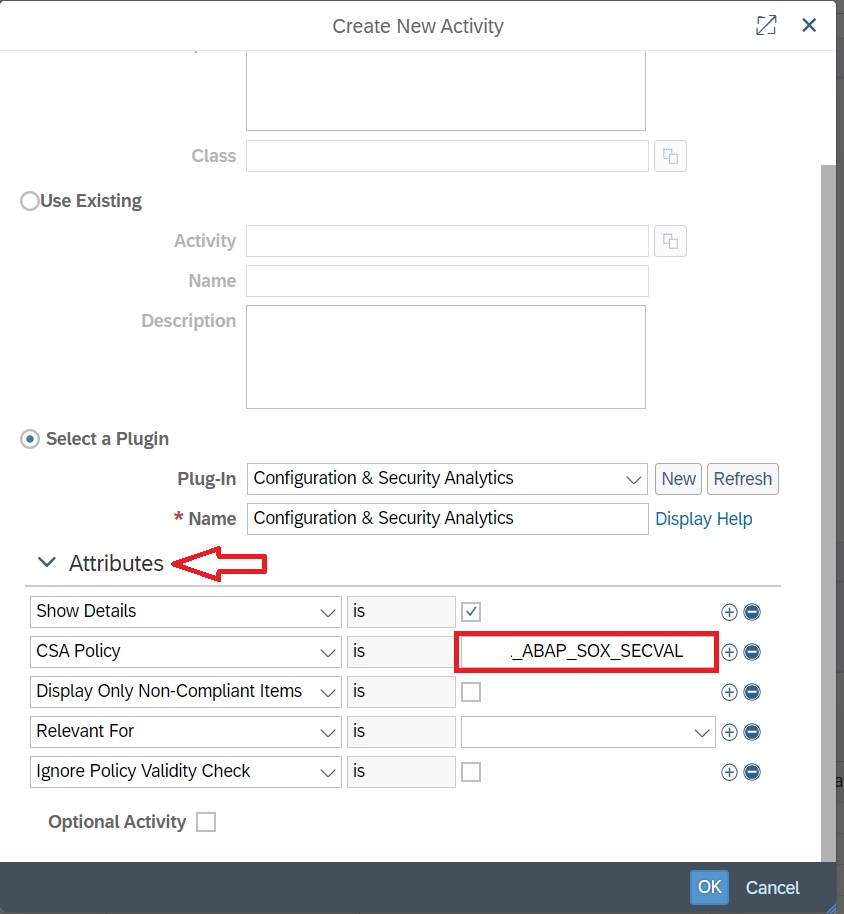
In the pop-up, select the option “Select a Plugin” and select the plugin Configuration & Security Analytics

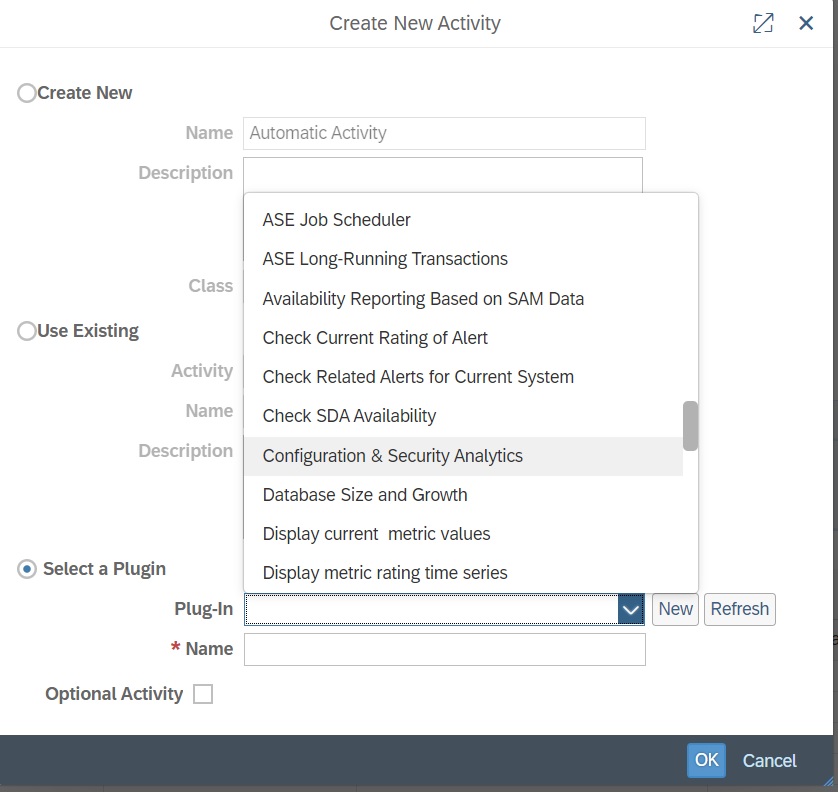
After selecting the plugin, expand the attribute section and provide the CSA policy name and click on OK.

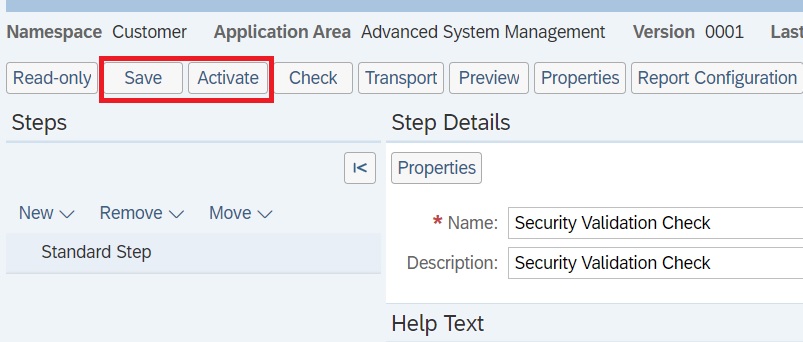
Back in the main screen save and activate the Guided procedure.

Now you can use this guided procedure to schedule an automatic execution to send an email report. You can do it in a similar fashion to sending email for System Health check report as explained here.

For more details on what all you can do with guided procedures, refer to the SAP Focused Run Expert Portal.

Interface monitoring: qRFC monitoring…

The generic interface monitoring setup in SAP Focused Run is explained in this blog. This blog will zoom into monitoring of qRFC connections, which are frequently used in communication from ECC to EWM and SCM systems.

OSS notes for bug fixing

Please make sure bug fix OSS note 3014667 – Wrong parameter for QRFC alerts is applied before starting with qRFC monitoring.

Other OSS notes:

Data collection and alerting setup

In the configuration for interface monitoring in the Technical System settings, goto the monitoring part and activate the data collection for qRFC Errors:

In the monitoring settings, you can filter on specific queues, direction and RFC name, or leave everything blank to report on everything:

In the alerting part check you can choose between age of qRFC entries and number of entries:

And set the filters for which ones, and the metric threshold for CRITICAL errors:

The filter for monitoring and alerting can be different. It could be you want to monitor all errors, but only activate specific important ones.

Save your monitoring data collection and alerting settings.

Queued RFC’s are normally back and forth between 2 systems. If this is the case you have to make the settings for both systems.

Graphical modelling

In the graphical modelling add the filter between two systems for the qRFC monitoring:

Also here: first scroll down to see the OK button. Press first OK before pressing Save, or you might loose the data and have to re-enter it. This it bit annoying in the UI.

Queued RFC’s are normally back and forth between 2 systems. If this is the case you have to make the settings for both systems. You model first one direction and then model the direction back:

Monitoring usage

The end result in operations looks as follows:

You can see here qRFC is modelled back and forth between 2 systems. The blue line indicates messages in process. The red line is clicked on. Here you can see both messages in process and errors. Click on the red error number gives the details:

Interface monitoring: ODATA gateway monitoring…

The generic interface monitoring setup in SAP Focused Run is explained in this blog. This blog will zoom into monitoring of ODATA gateway connections.

We assume in this use case that end users are using the ODATA in FIORI apps. In case ODATA is consumed by external applications like Tibco, Mulesoft, Mendix, etc., you have to replace USER with the corresponding application.

Model end users in LMDB

Before we can start the scenario modelling, we first need to model the end users in LMDB as a Unspecific Standalone Application System), just like we did for TIBCO in this blog.

Name the ‘system’ USER:

Make sure the status is Active.

Add this new system USER to the Technical System list in the Integration Monitoring setup.

The system will be display only.

Data collection and alerting setup

In the configuration for interface monitoring in the Technical System settings, goto the monitoring part and activate the data collection for Gateway Errors:

In the monitoring settings, you can filter on specific items if wanted, or leave everything blank to report on any error:

In the tab alerting setup the alerting:

The filter for monitoring and alerting can be different. It cloud be you want to monitor all errors, but only activate specific important ones.

Save your monitoring data collection and alerting settings.

Graphical modelling

In the graphical modelling add the backend system and the system created for USER:

Now add the link starting with USER towards the backend system:

Save your changes.

Also here: first scroll down to see the OK button. Press first OK before pressing Save, or you might loose the data and have to re-enter it. This it bit annoying in the UI.

Monitoring usage

The end result in operations looks as follows:

In the graphical overview click on the red line. The screen with the exceptions opens. Click on the red number to see the overview:

Here you can see the trends and zoom into the specific errors:

Interface monitoring: RFC monitoring…

The generic interface monitoring setup in SAP Focused Run is explained in this blog. This blog will zoom into monitoring of RFC connections.

RFC’s between SAP systems

RFC’s with fixed user ID

The basic setup of monitoring RFC’s was explained as example for the generic interface monitoring setup in this blog already.

Trusted RFC’s

This RFC was an RFC with a fixed user ID. If you have to setup an RFC monitoring for a trusted RFC (for example between Netweaver Gateway system and ECC system), then you have to take care of the user ID’s and rights. The system from which the SM59 test will run, will use that Focused Run user ID to log on to the other system. If your user ID’s are unique for each system you have to create the user ID in the other systems with the rights to be able to execute a ping and logon for the test.

End result RFC checks

The end results of the RFC is list of RFC’s with the latency time, availability and logon test overview:

Transactional RFC towards external system

To monitor transactional RFC (type T) towards an external system like TIBCO, Mulesoft, etc, you first need to model the external system in the LMDB. To do this goto the LMDB maintenance FIORI app:

Then select Single Customer Network and select the option Technical Systems. In this section choose the Type Unspecific Standalone Application System:

And press Create:

Fill out the details and Save. Make sure the status is Active.

Now the system can be added in the configuration of technical systems in the Interface monitoring configuration:

Now you can model the tRFC interface connection monitoring:

OSS notes

Relevant OSS notes: