System monitoring custom metric for message server disconnects…

From availability perspective, you want to detect as quickly as possible if you are suffering from message server disconnects.

You can create a custom monitoring metric to measure and act on this.

Creation of the custom metric for message server disconnects

Create a custom metric following the steps in this blog. The template to be adjusted is the technical instance SAP ABAP 7.10 and higher template.

Don’t forget to tick it on for monitoring otherwise it is not active.

In expert mode create a custom metric.

Create technical name Z_MESSAGE_SERVER_DISCONNECT:

In the data collection:

Data to enter: RFC on diagnostics agent (push). Select ABAP System Log Stats. Filter on message number Q0L, Q0M and Q0N. Any of those indicate message server errors. For more information on system log messages, read this blog.

Define the threshold for alerting:

And assign the metric to the ABAP Instance not available alert group:

System monitoring custom metric for user lock status…

From security perspective, you want to validate that 2 important users are locked in the main system clients: SAP* and DDIC.

You can create a custom monitoring metric to measure and act on this.

Creation of the custom metric for user lock status

Create a custom metric following the steps in this blog. The template to be adjusted is the technical system SAP ABAP 7.10 and higher template.

Don’t forget to tick it on for monitoring otherwise it is not active.

In expert mode create a custom metric.

Create technical name ZUSER_LOCK_STATUS:

In the data collection:

Data to enter: RFC diagnostics agent (push). User Lock status Data collector. Enter as parameters the user ID (DDIC) and the COLLECTOR_CONTEXT_ID as TECHNICAL_SYSTEM.

Set the threshold as a text threshold:

Set the red rating in case the string contains the word ‘not locked’ and set to green in case it contains the word ‘locked’.

Now assign it to Alert group for locked users:

Save the metric.

Repeat the same for SAP*.

Deploying Simple Diagnostic Agents on Managed Systems…

Deploying Simple Diagnostic Agents (SDA) on Managed System hosts is a prerequisite to performing Simple System Integration (SSI) of Managed systems on focused run system.

The SDA is installed/deployed as an add-on to the SAP host agent. Hence it’s mandatory to install SAP Host Agent on each host of the managed system which needs to be monitored by SAP Focused Run System.

The deployment of the SDA on the managed system system host is carried out from the SAP Focused Run system itself.

Below steps need to be performed for deploying SDAs on managed system hosts.

Download binaries from marketplace

Download the latest version of the binaries SDA and SAP JRE (Java Runtime Environment) from SAP Support Portal as follows:

  • Go to Software Downloads – SAP ONE Support Launchpad
  • Select tab Support Packages & Patches –> By Category –> SAP Technology Components –> Focused Run –> Focused Run 3.0 –> Downloads –> Comprised Software Component Versions
  • Download from SAP JRE 8.1 and SIMPLE DIAGNOSTICS AGENT 1.0

Following platforms are supported

  • IBM AIX
  • HP-UX on IA64
  • Linux on Power BE & LE
  • Linux x86_64
  • Oracle Solaris SPARC
  • Oracle Solaris x86
  • Microsoft Windows Server on x86_64

You can find all information regarding latest available version of SDA and its compatible JRE version in SAP Note 2369401 – Release Note for Simple Diagnostics Agent 1.0

Upload Binaries onto SAP Focused Run system

Upload the binaries to SAP Focused Run, by running the report SRSM_AMA_UPLOAD_BINARY, with transaction SA38.

Upon completion of the upload you will see the below output.

Deploy SDA on Managed system host

Register Managed system host on Focused Run system: Before you can deploy SDA on managed system host, the host has to be registered to the Focused Run System. For this execute the following script at OS level as sapadm user from folder /user/sap/hostctrl/exe

./saphostctrl -function ConfigureOutsideDiscovery -enable -sldusername FRN_LDDS_FRS -sldpassword xxxxxxxxxx -sldhost <hostname of FRUN system> -sldport <http/https port of FRUN system>

./saphostctrl  -function  ExecuteOutsideDiscovery -sldreg

Upon executing the above commands at host level, you can see the host listed in Agent Administration of Focused Run system. Navigate to the Agent Administration app in the Infrastructure Administration block of the Focused Run launchpad.

  • In the Agent Administration App, select the host for which you want to deploy the SDA, select Install/Update Agent and click on Go.

  • Upon completion of the deployment, you will see the agent version listed in the Diagnostic Agent Version column.

  • After SDA installation/update is successful you also need to configure the agent. This will enable the agent to receive monitoring definitions from the focused run systems as well as enable Self Monitoring of the agent.

  • Upon completion of configuration, you will see green icon under availability column. Also Configuration status updated to Confirmed.

You need to follow the same steps for installing and configuring agents on all application server hosts as well as database hosts of the managed system.

Note: You should perform the Simple System Integration of a managed system only after you install and configure agents on all its hosts. You can also list hosts and their agent status of a particular managed system in the By Technical System tab of the Agent Administration app.


Alert Management overview…

The alert management function is a central alert inbox function for SAP Focused Run. All alerts from all tools are coming together in the alert inbox.

Questions that will be answered in this blog are:

  • Which alerts are sent to the Alert inbox?
  • How to organize alert handling?
  • How to execute alert review?
  • How to reduce the amount of open alerts?

For practical use of the alert management function, read this dedicated blog.

Alert inbox

All alerts from all SAP Focused Run monitoring tools end up in the Alert Inbox:

This can be alerts from:

Don't let yourself be impressed by the high amount of alerts: this counter is across all tools and all systems, including non production. After some fine tuning of monitoring templates and thresholds, and clean up in the systems, this number will go down fast.

Alert handling

An alert is sent to the alert inbox. But for each alert you can configure as well if an alert is e-mailed, and/or send to external tool like ServiceNow.

The alert inbox has a scope filter just like all the other Focused Run tools. Use it to filter the alerts for you most important systems (most likely the productive systems, or even filter on the core S4HANA and/or ECC systems).

Depending on your organizational structure and amounts of systems, you need to agree on how you handle the alerts. Aspects to be taken care of:

  • Prioritization of alerts; which ones go first? Solutions:
    • Use filters for important systems
    • First red alerts, then yellow alerts
      • Fine tune alert thresholds to reduce invalid red alerts
  • Assign processor or not: for larger teams do assign a processor to keep track
  • Fill out comments for alerts that take longer to solve, so you track what has been done
  • Consider to postpone alerts that require a change to get fixed (and the change takes a longer time to implement)
  • Using the SLA functions or not?
  • Who is allowed to confirm an alert?

Alert review

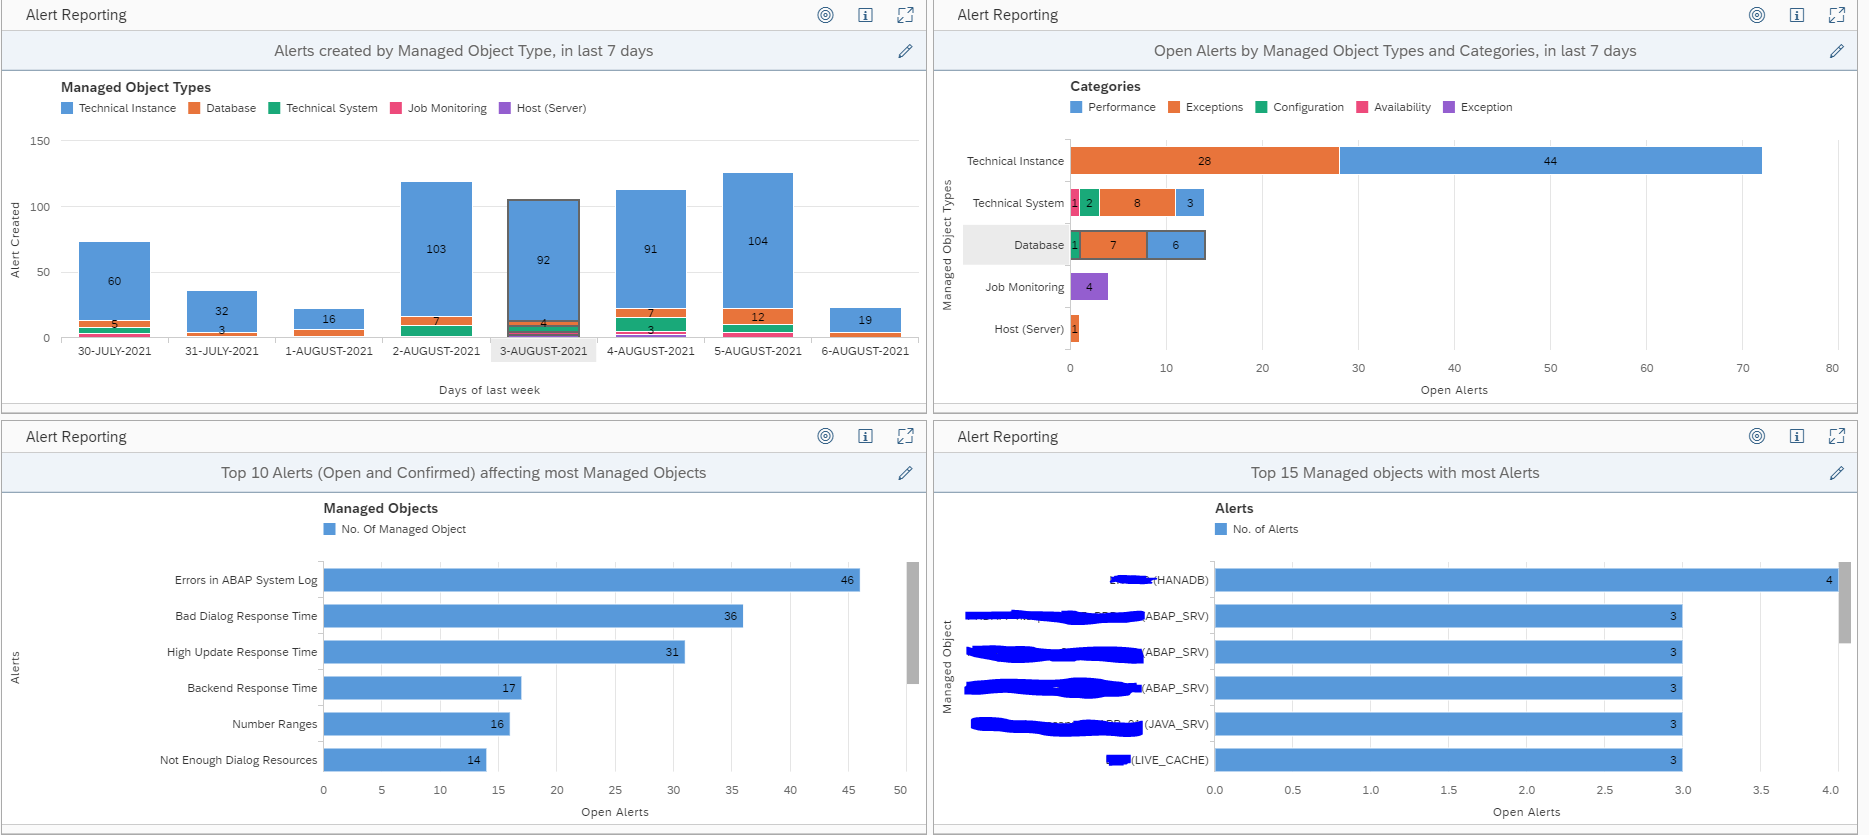
You can use the initial alert dashboard, or the alert reporting overview, or create your own dashboards:

The overview shows the open alerts:

At the start of your SAP Focused Run implementation you should at least weekly review this. It gives you insights into:

  • The type of alerts most frequently popping up
  • The systems that generate the most alerts
  • The average time an alert is open

When you are getting more mature and used to solving the issues and alerts, you can reduce the alert review frequency to for example monthly.

Open alert reduction

To reduce the open alerts consider this sequence:

  • Solve the issues in the systems: clean up, apply permanent solutions
  • Fine tune the metric thresholds for false alerts, and classify not so important alerts as yellow: keep red for the important alerts
  • Work on the resolution time: also here, focus on the red alerts which are important

Bad practices (often deployed by KPI drive service providers):

  • Increase thresholds, without clean up or without solving the issues permanently
  • Simply close each repetitive alert fast without checking and solving the root cause for repetitive failure
  • Only look at subsection of the alerts
  • Don’t look at self monitoring items (without solving self monitoring issues)
  • Blame Focused Run for having bugs (without looking for OSS notes and without reporting issues)
  • Don’t confirm the alerts (so they keep open and don’t send new mails, or don’t create new ServiceNow tickets)

If you are confronted with such a service provider, use the alerting reporting tools also for the closed alerts to find evidences of such behaviors.

Missed alerts

After incidents you have (mainly in your productive system), check if Focused Run generated the proper alert or not.

Cases that can happen:

  • Focused Run did alert the situation, but it was not picked up fast enough by the processors: organizational measures, or consider the mail sending option
  • Focused Run did measure the situation, but the alert was not configured (for example batch job alert was not set)
  • Focused Run did measure the situation, but the threshold was not reached: lower the threshold in the template
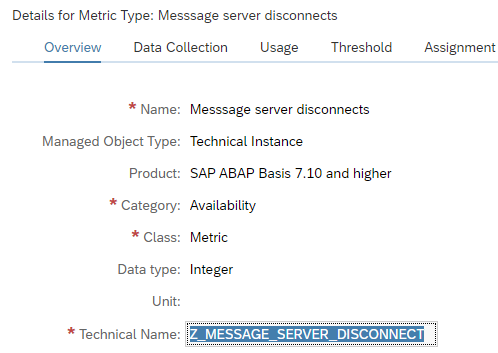
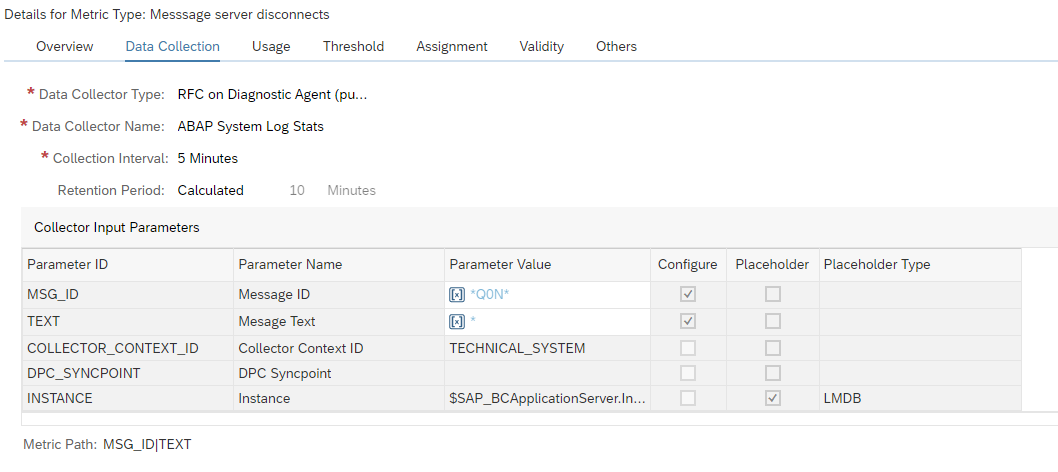
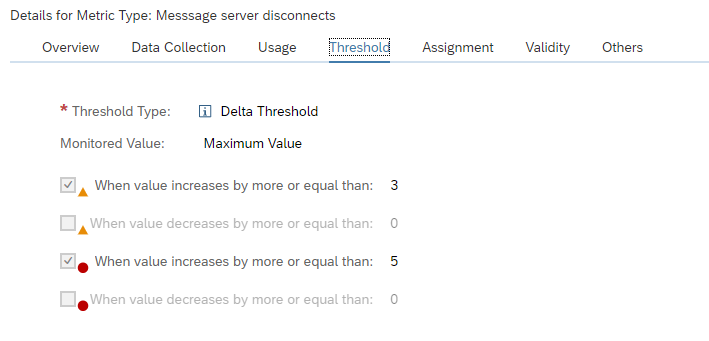
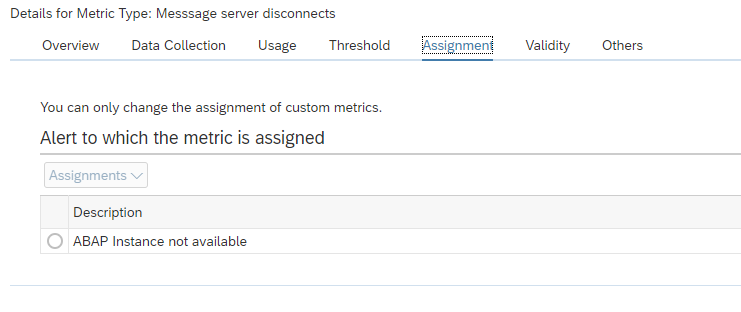
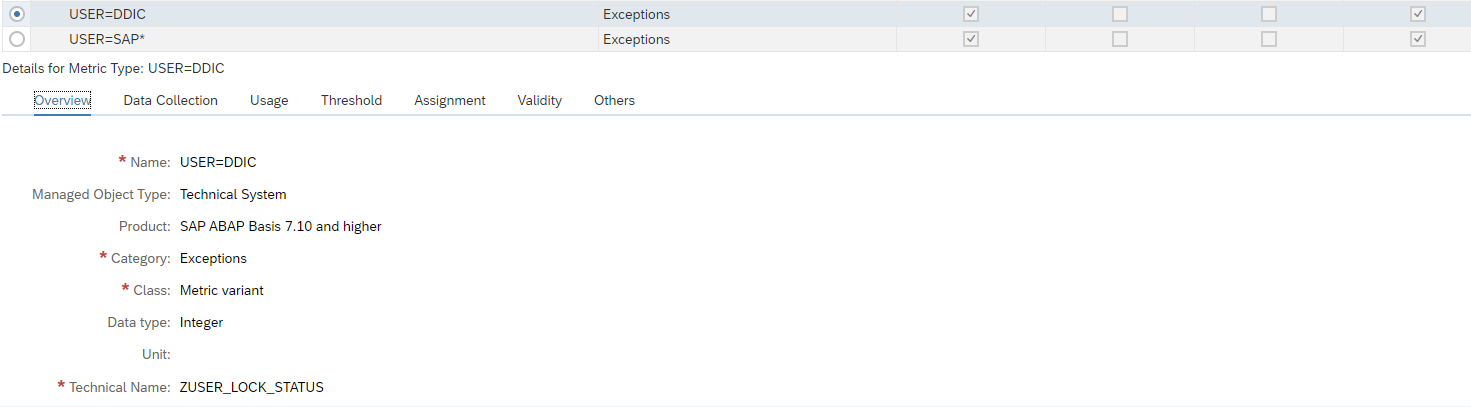
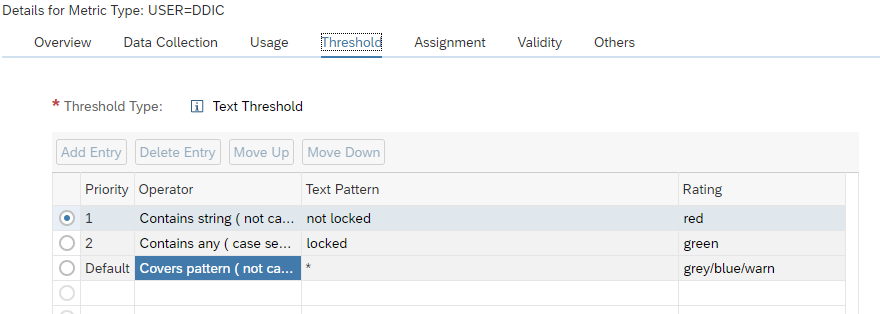
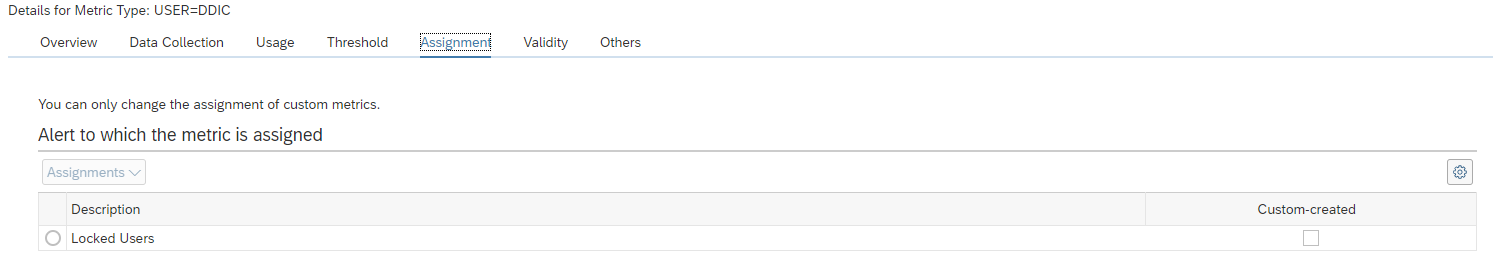
  • Focused Run did measure the situation, but it was not specific enough. This can happen with SM21 system messages. Consider creation of very specific custom metrics for specific messages (for example for application server connectivity loss to database).
  • Focused Run did not measure the situation: check if you can activate an out-of-the-box monitoring item for the situation. Not all measurements are active in the templates by default. If no out-of-the box exists, consider creating a custom metric. Or check if you can monitor side-effects of occurring bad situations.

The goal of this analysis is to keep improving the alerting accuracy: alerts should not be missed and valid (not false).