Monitoring Cloud Connector BTP Certificate Expiry…

With SAP Focused Run 3.0 FP 2 SAP has delivered a configuration validation policy using which you can monitor Cloud Connector BTP Certificate expiry.

Note: For using this functionality you just have to ensure that you have registered your cloud connector managed system to your Focused Run System and have performed SSI for the cloud connector managed system.

You can do the monitoring via the Configuration & Security Analytics app in the Advanced Configuration Monitoring area of Focused Run Launchpad.

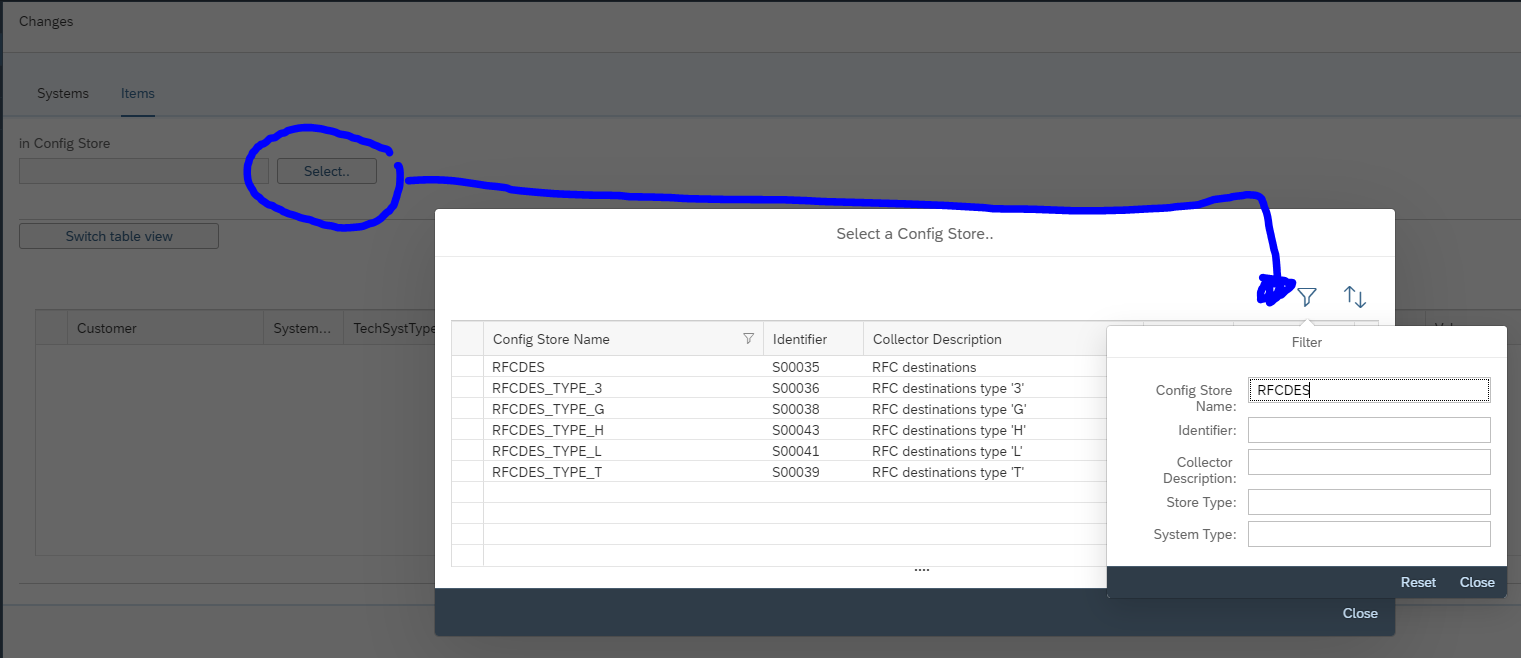
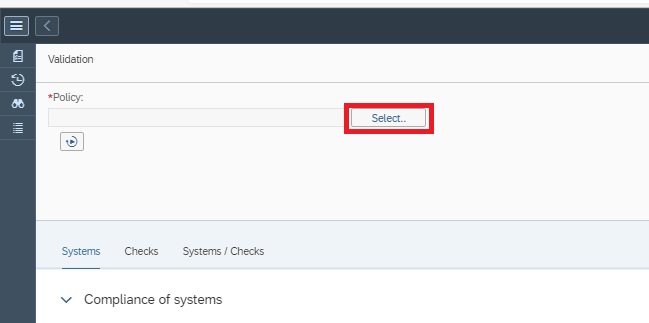
In the app click on the select button to select the policy to monitor Cloud Connector BTP Certificates.

In the pop-up you can search for SCC and then select the policy SAP_SCC_PSE_CERT. This is the standard policy delivered by SAP that performs configuration validation on Cloud Connector BTP Certificate expiry.

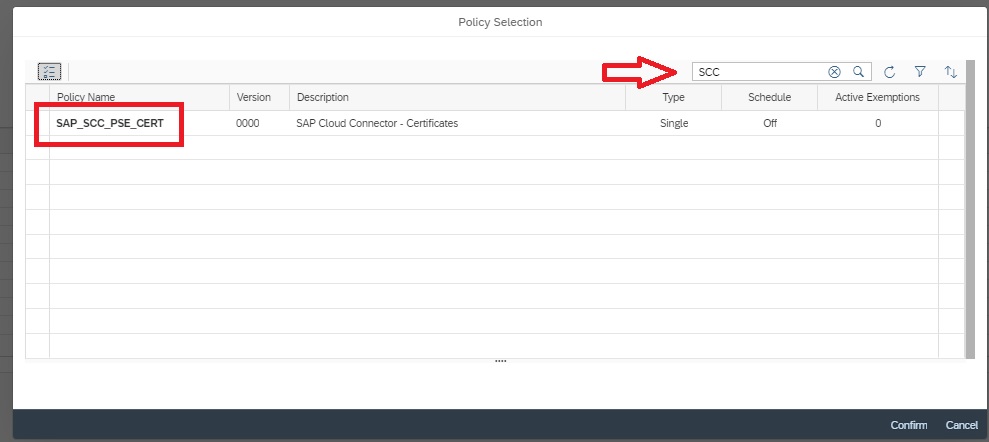
This policy monitors if a BTP certificate in cloud connector system is going to expire in less than 30 days or is already expired.

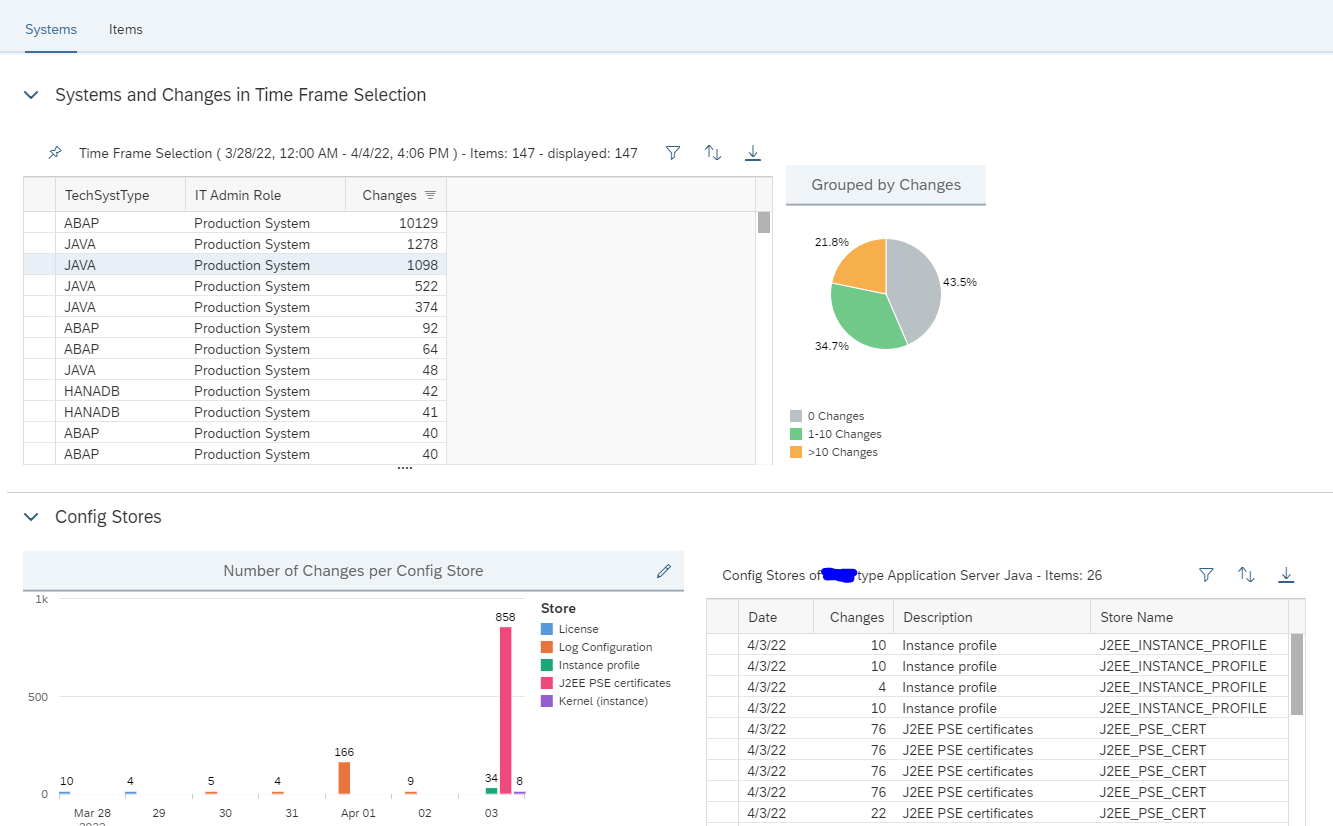
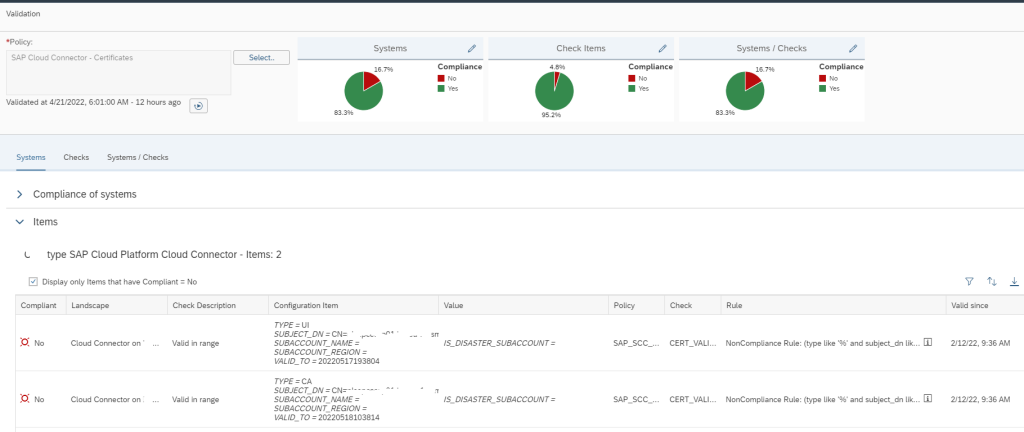
The first view upon selecting the policy is the Systems view. In this view all SAP Cloud Connector systems registered in Focused Run system are listed. A systems is marked as non compliant if it has any certificate which is going to expire in less than 30 days or has any expired certificates. This view also tells how many certificates are there in the system and how many are non compliant.

You can click on the row to see the details of the certificates which are expiring or expired.

To know more about Configuration and Security Analytics you can refer here.

Also you can find more detail at SAP documentation here.

OCC dashboards…

OCC dashboards are the most flexible form of dashboarding in SAP Focused Run. It is completely up to you to define any dashboard based on the available data.

The explanation below will give a quick introduction on how to setup a dashboard with as example a line graph with CPU for one system and amount of short dumps per hour for that system in a bar chart.

Set up new dashboard

Start the OCC dashboard FIORI tile:

Click the add a new dashboard icon on the left:

Now open on the right hand side icon the personalization. Here you can change the default 2 by 1 layout if want as well:

Now per gadget, select the personalization. First choose the type of graph, then select the query details:

Add the query by clicking the Plus sign:

Give the legend a name and press the Change query button:

First select the data source. In this example we choose system monitoring. Select next your system, and select the metric (in this case CPU). Don’t forget to save on top of the personalization!

We repeat for the other gadget, but now select short dumps per last hour as example:

Test your dashboard to see if the results are according to your expectation.

Make dashboard public

If you are happy with your dashboard, you can make it public. To do so, go to the personalization options:

Set the selected page to public, select a proper icon, and rename the default user-edit to a proper name and don’t forget to Save.

Other users can now add you dashboard from their UI personalization menu by clicking the Add Public Page and add your dashboard:

Other examples

Examples on this blog site: trend for ABAP short dump.

Detecting long running DIA process…

In some exceptional cases you can have a DIA process that runs for a long time without action and still occupies the resources.

You can create a custom monitoring metric to measure and act on this.

Creation of the custom metric for detecting long running DIA processes

Create a custom metric following the steps in this blog. The template to be adjusted is the technical system SAP ABAP 7.10 and higher template.

Don’t forget to tick it on for monitoring otherwise it is not active.

In expert mode create a custom metric.

Create technical name Z_METRIC_LONGRUN_DIA_WP_36HRS:

Now setup the definition for the data collection:

It is using the Push.

And set the usage:

Last but not least: you need to set the alerting threshold:

The alert is raised if a single DIA work process is running longer than 36 hours.

Save the custom metric and make sure the template reassignment is done to activate the custom metric for your systems.

Determining configuration changes…

In SAP Focused Run the Configuration and Security validation tool captures a lot of detailed configuration data. This tool can be used to determine configuration changes that were done to your systems.

Configuration changes

Go to the Configuration and Security Analytics FIORI tile:

On the left side choose the tool to display configuration changes:

In the next screen you can see the changes per system:

In the details you can see what has been changed and when.

Search for specific configuration changes

You can also search for specific configuration changes. Open the find tool and select the change store (in this example RFC destinations):

Now you get the detailed list of changes:

The easiest overview is the table view. This allows also for Excel download.

Remark: the time frame default 1 week. If you need search different period, change the time frame selection.

Health monitoring overview…

Health monitoring can be used to monitor special use cases:

Health monitoring

Health monitoring can be started with the FIORI tile:

The overview screen opens:

From the overview you can immediately zoom to the error by clicking on the red bar:

Health monitoring content update

For updating content of health monitoring, follow the instructions in OSS note 3360399 – Unable to import the FRUN-CONT package FRUNCONT40003_0-80008241.ZIP.

Configuration and Alerts

Each scenario needs to be configured. For the configuration per scenario read the separate detailed blogs:

Per scenario you can choose to create an alert in case of issues. The alert is then send to the central Alert overview.