Monitoring GTS system…

This blog will focus on monitoring on GTS systems.

Monitoring productive GTS systems

GTS systems are at the not frequent in use. When in use they do play a vital role in import and export business scenario’s when good are crossing borders.

Since a GTS system is normally installed, and often no to little maintenance and software changes are performed on the system. Also basis teams tend not to look at it too often, since it normally runs stable.

In case of non-availability of GTS, ECC scenario’s linked to GTS might fail and can causes severe business disruptions.

For this reason it is important to set up monitoring in FRUN for your GTS system and also configure mail alerts in case of issues. They will not happen too often, but when they happen you can act fast. This will also save the basis team spending a lot of time on checking GTS system for log (most cases, the checks are good).

When monitoring a productive system, you will need to finetune the monitoring templates for:

  • ABAP 7.10 and higher Application template, for the ABAP application
  • ABAP 7.10 and higher Technical instance template, for the ABAP application servers
  • System host template
  • Database template

ABAP application template

Make sure you cover in the ABAP application template the following items:

Availability:

  • Message server HTTP logon
  • System logon check
  • RFC logon check
  • License status
  • Certificates expiry
  • Update status

Performance and system health:

  • Critical number ranges
  • Enqueue lock % filled
  • SICK detection
  • Dumps last hour
  • Update errors last hour
  • Cancelled jobs last hour
  • Long running work processes and jobs (see blog)

Security:

  • Global changeability should be that the system is closed
  • Locking of critical users like SAP* and DDIC (see blog)

Fine tune the metrics so you are alerted on situation where the system is having issues.

ABAP application server template

Make sure you cover in the ABAP application server template the following items:

Availability:

  • Local RFC logon test
  • Local HTTP logon test
  • Local Logon test
  • Message server disconnects (see blog)

Application server performance and health:

  • Amount of critical SM21 messages
  • No more free work processes (see blog)
  • Update response times

You can consider to setup extra custom metrics for the application servers:

System host template

For system host the regular CPU, memory, disc template is sufficient. Finetune the thresholds to your comfort level.

Database template

Important items of the database template:

  • Database availability
  • Database health checks
  • Backup

Functions monitoring

Next to the availability and performance mentioned above, check also for monitoring certain functions:

Monitoring SCM system…

This blog will focus on monitoring on SCM systems. Also known as APO systems.

Monitoring productive SCM systems

SCM systems are at the often used logistics optimization systems. They are mainly used in combination with traditional ECC systems. They are less needed in combination with S4HANA systems (or you can use the embedded SCM of HANA).

The core of an SCM system is a BI system. Many data is using similar extractors and process chains as a BI system. Hence follow the tuning needed for a BI system.

Extra in an SCM system are the LiveCache and the CIF (Core interface).

LiveCache monitoring

LiveCache is normally running on a MaxDB database.

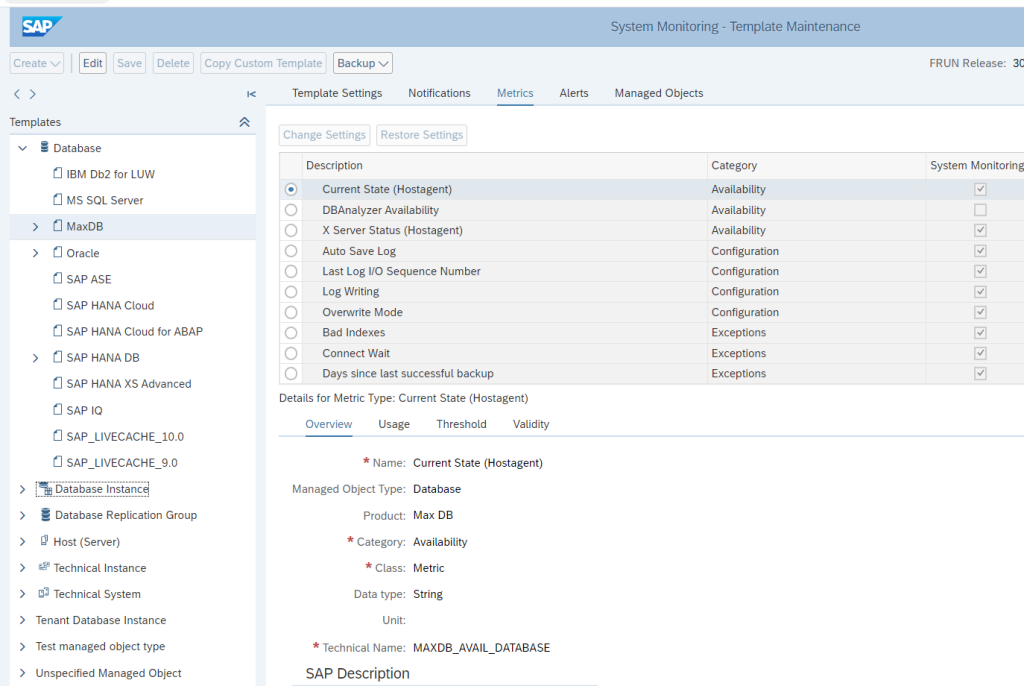
So it is important to activate, assign and finetune the metrics for the MaxDB database:

Focus on:

  • Availability
  • Backup
  • Performance

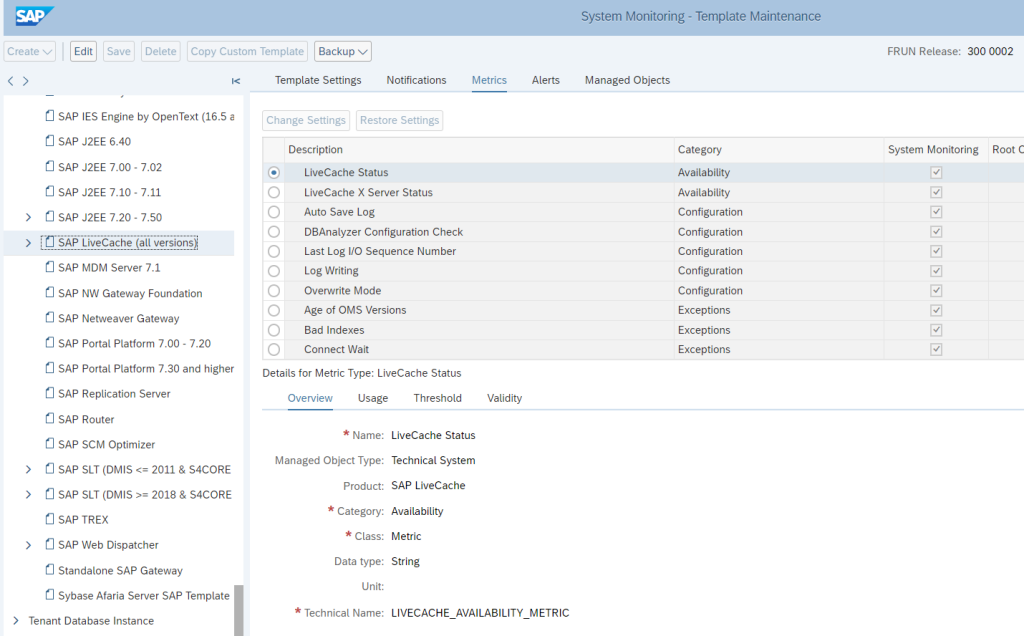
Next to the database, you also need to activate, assign and finetune the LiveCache specific application template:

This template contains the primary elements to monitor for the LiveCache functions like:

  • Availability of LiveCache as a function
  • Structure check for LiveCache
  • Memory issues for LiveCache specifically

Fine tune the metrics so you are alerted on situation where the system is having issues.

CIF monitoring

The CIF is the core interface between SCM and ECC system. The interface typically uses RFC and qRFC. And it is working both ways.

Setup for the CIF specific RFC’s and qRFC’s the monitoring:

Process chain monitoring

SCM uses process chains. To monitor process chains, read this dedicated blog.

Monitoring BW systems…

This blog will focus on monitoring on BW systems.

Monitoring productive BW systems

BW systems are at the often used as reporting systems within an SAP landscape.

When monitoring a productive system, you will need to finetune the monitoring templates for:

  • ABAP 7.10 and higher Application template, for the ABAP application
  • ABAP 7.10 and higher Technical instance template, for the ABAP application servers
  • System host template
  • Database template

ABAP application template

Make sure you cover in the ABAP application template the following items:

Availability:

  • Message server HTTP logon
  • System logon check
  • RFC logon check
  • License status
  • Certificates expiry
  • Update status

Performance and system health:

  • Critical number ranges
  • SICK detection
  • Dumps last hour
  • Cancelled jobs last hour
  • Long running work processes and jobs (see blog): this is more tricky in a BW system, since it can have longer running extraction and processing jobs

Security:

  • Global changeability should be that the system is closed
  • Locking of critical users like SAP* and DDIC (see blog)

Fine tune the metrics so you are alerted on situation where the system is having issues.

ABAP application server template

Make sure you cover in the ABAP application server template the following items:

Availability:

  • Local RFC logon test
  • Local HTTP logon test (if any BW web scenario is used)
  • Local Logon test
  • Message server disconnects (see blog)

Application server performance and health:

  • Amount of critical SM21 messages
  • No more free work processes (see blog)
  • Update response times

You can consider to setup extra custom metrics for the application servers:

For a BW system some numbers are typically higher than on an ECC or S4HANA system. Response times of 1.5 seconds would indicate horrible performance on ECC, but are normal on BW system.

System host template

For system host the regular CPU, memory, disc template is sufficient. Finetune the thresholds to your comfort level.

Database template

Important items of the database template:

  • Database availability
  • Database health checks
  • Backup

Functions monitoring

Next to the availability and performance mentioned above, check also for monitoring certain functions:

Activating RUM (Real User Monitoring)

This blog will explain the technical activation of RUM (real user monitoring) in SAP Focused Run.

Basic activation as function

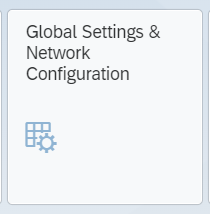
First go to the FIORI settings tile:

If the RUM function is not active yet, activate it and Save:

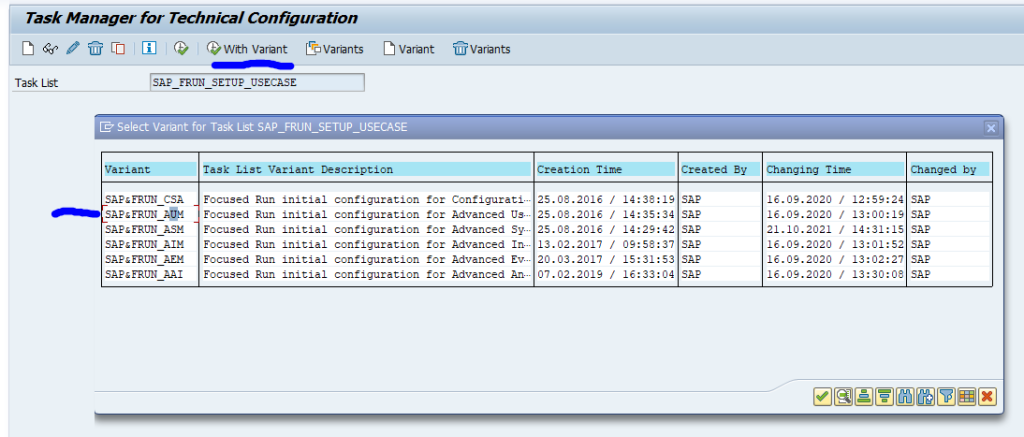
Now go to the FRUN backend ABAP system and start transaction STC01 and select task list SAP_FRUN_SETUP_USECASE and variant SAP&FRUN_AUM (advanced user monitoring):

In the task list setup also select the batch jobs:

Now run the task list. This should not take longer than 1 minute. Result green is ok:

Technical activation of RUM per managed system

Per system for which you want to activate the RUM function proceed as follows:

Go to the SSI FIORI tile:

Select the system:

Now press the Configure manually button and new screen opens:

On top first select Step 2 for Execute configuration. And select the Configure Real user monitoring step. Press the Execute Selected button and wait for the log to show success:

Alternatively you can also do the SSI completely new on the first screen by selecting the Configure Automatically button.

Background: RUM is an intense function. If it is not active, the agent does not have to do anything. The re-do of the SSI is needed to tell the agent on the system to start sending RUM data once it is activated in FRUN configuration.

With this step the managed system is prepared.

Functionality activation of RUM per managed system

Now we can go to the RUM FIORI tile:

After scope selection nothing is active yet:

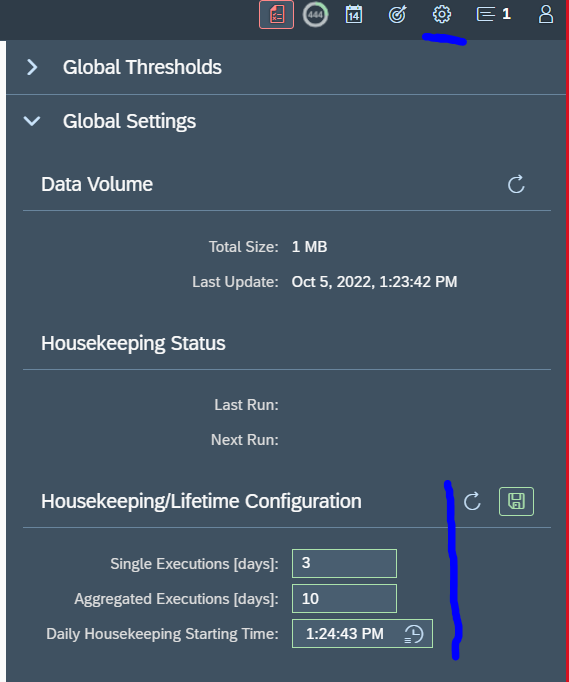
On top right choose the Configuration button and start with the housekeeping settings:

WARNING: RUM can use a lot of data in your database. It can also consume a lot of your Focused Run licensing. If you use too much; reduce amount of systems for which you activate RUM and reduce the retention periods in the screen above. See blog on Focused Run license measurement.

Go to the Systems section and toggle the Activation for the system to On:

Wait for the configuration and data collection to happen. Take 5 to 10 minutes patience for this step.

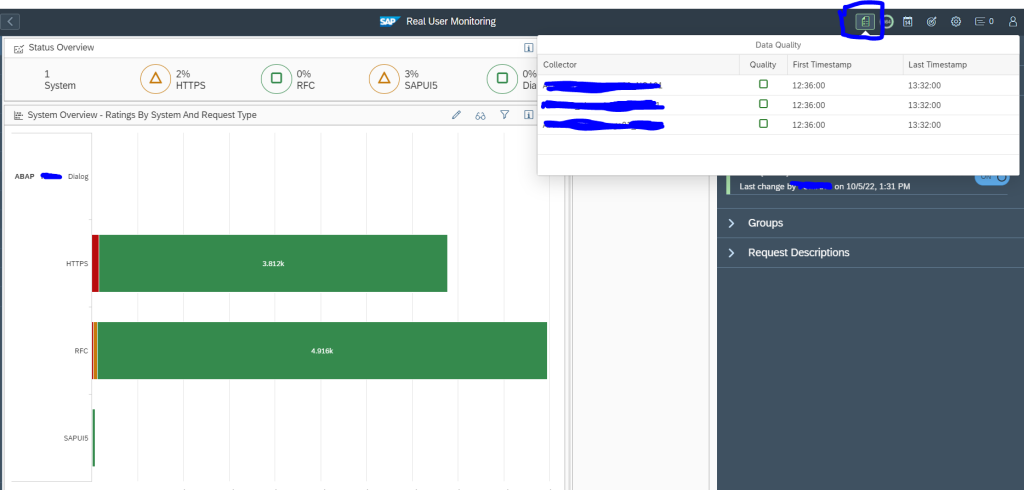
After the step, refresh the screen and it should look like this:

Data should appear on the left. On top, select the icon Data Quality. This shows the data collection status per host. The icon will be red at start and turn green after 30 minutes.

<< This blog was originally posted on SAP Focused Run Guru by Frank Umans. Repost done with permission. >>

Monitoring ECC and S4HANA systems…

This blog will focus on monitoring on ECC and S4HANA systems.

Monitoring productive ECC and S4HANA systems

ECC and S4HANA systems are at the core of each SAP landscape, and most vital to the business.

When monitoring a productive system, you will need to finetune the monitoring templates for:

  • ABAP 7.10 and higher Application template, for the ABAP application
  • ABAP 7.10 and higher Technical instance template, for the ABAP application servers
  • System host template
  • Database template

ABAP application template

Make sure you cover in the ABAP application template the following items:

Availability:

  • Message server HTTP logon
  • System logon check
  • RFC logon check
  • License status
  • Certificates expiry
  • Update status

Performance and system health:

  • Critical number ranges
  • Enqueue lock % filled
  • SICK detection
  • Dumps last hour
  • Update errors last hour
  • Cancelled jobs last hour
  • Long running work processes and jobs (see blog)

Security:

  • Global changeability should be that the system is closed
  • Locking of critical users like SAP* and DDIC (see blog)

Fine tune the metrics so you are alerted on situation where the system is having issues.

ABAP application server template

Make sure you cover in the ABAP application server template the following items:

Availability:

  • Local RFC logon test
  • Local HTTP logon test
  • Local Logon test
  • Message server disconnects (see blog)

Application server performance and health:

  • Amount of critical SM21 messages
  • No more free work processes (see blog)
  • Update response times

You can consider to setup extra custom metrics for the application servers:

System host template

For system host the regular CPU, memory, disc template is sufficient. Finetune the thresholds to your comfort level.

Database template

Important items of the database template:

  • Database availability
  • Database health checks
  • Backup

Functions monitoring

Next to the availability and performance mentioned above, check also for monitoring certain functions: