Storing monitoring data longer with the aggregation framework…

The detailed monitoring data from system monitoring is only kept 28 days.

For specific reasons you might want to store certain details longer for specific systems in a condensed way. For example, you want to keep short dumps and failed jobs for your productive systems on daily basis for 1 year.

Here is where the aggregation framework can help you.

Set up aggregation framework

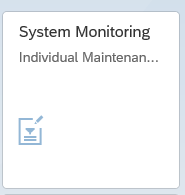
To setup up the aggregation framework go to the System monitoring Individual maintenance FIORI tile:

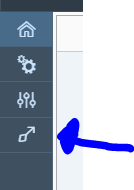
On the left hand side choose the option Aggregation Framework:

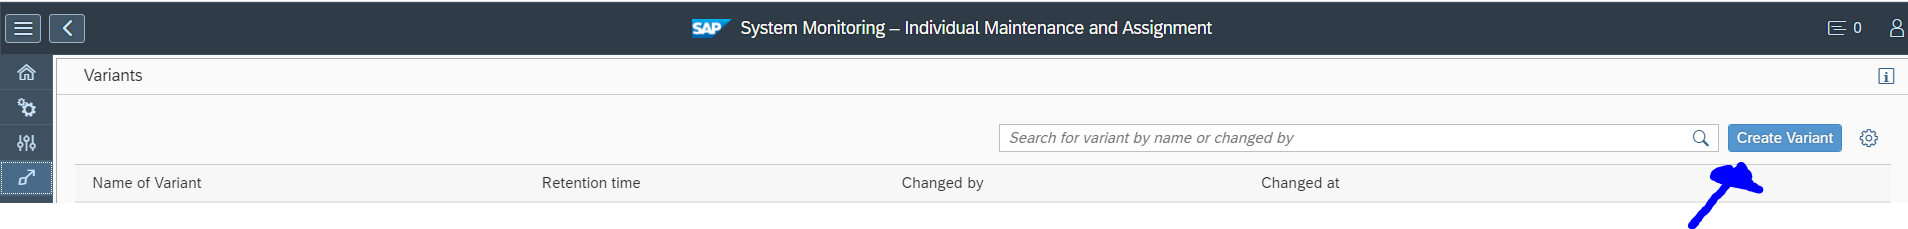
Choose the button Create Variant to create a new variant:

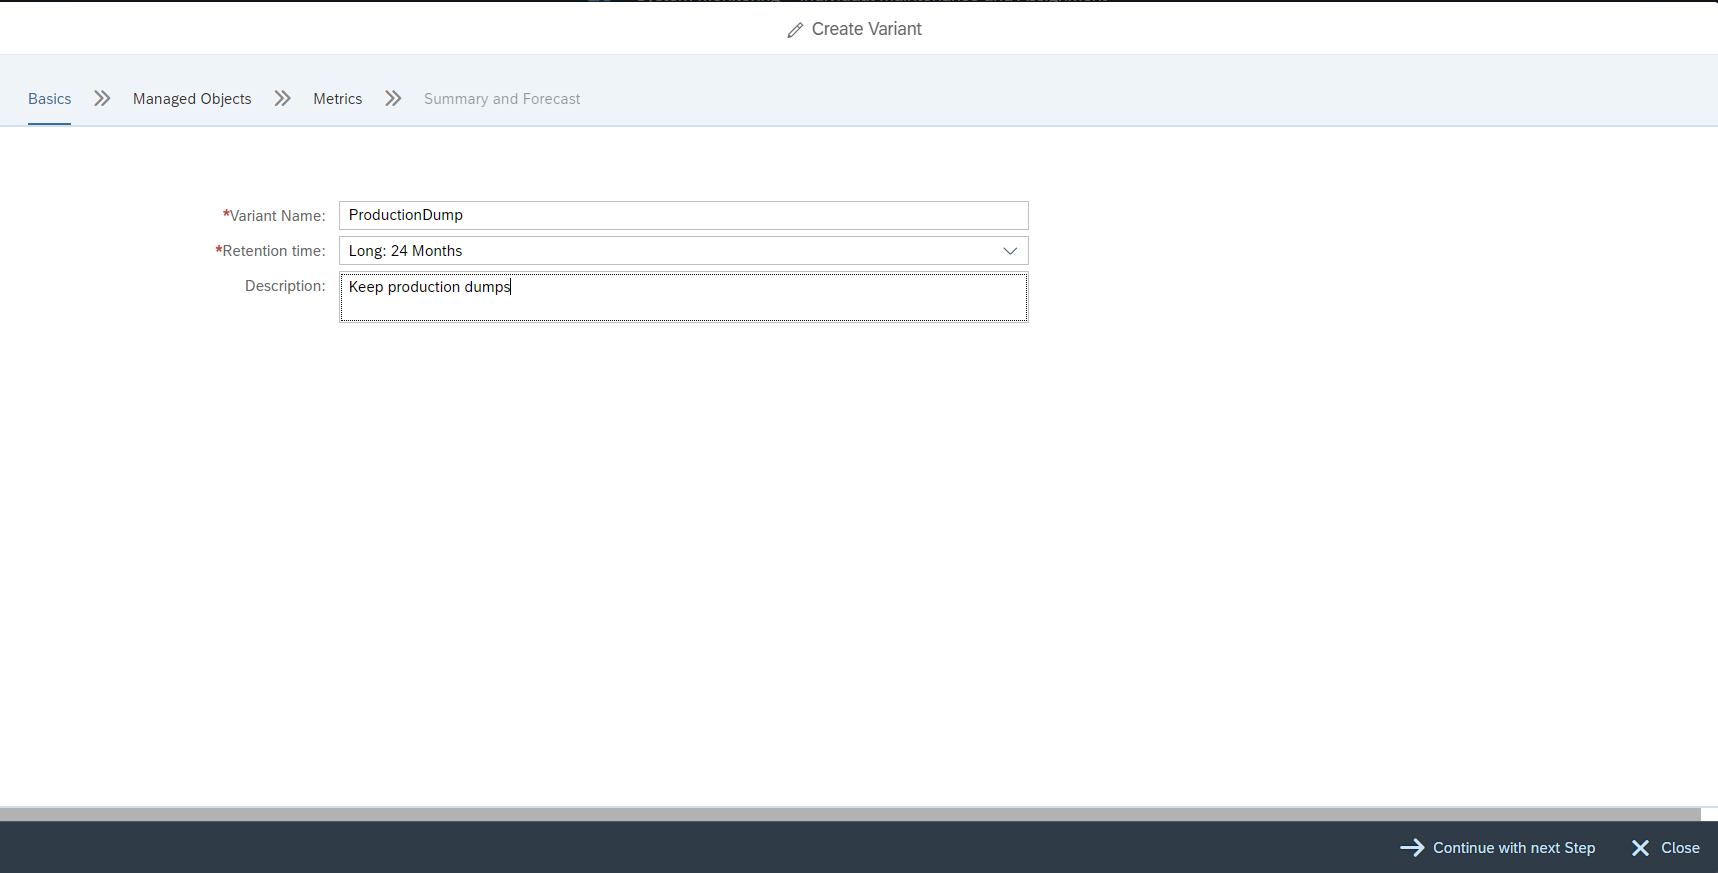
Fill out the name and basic description and press the Continue with next step button:

The next screen is bit more complex:

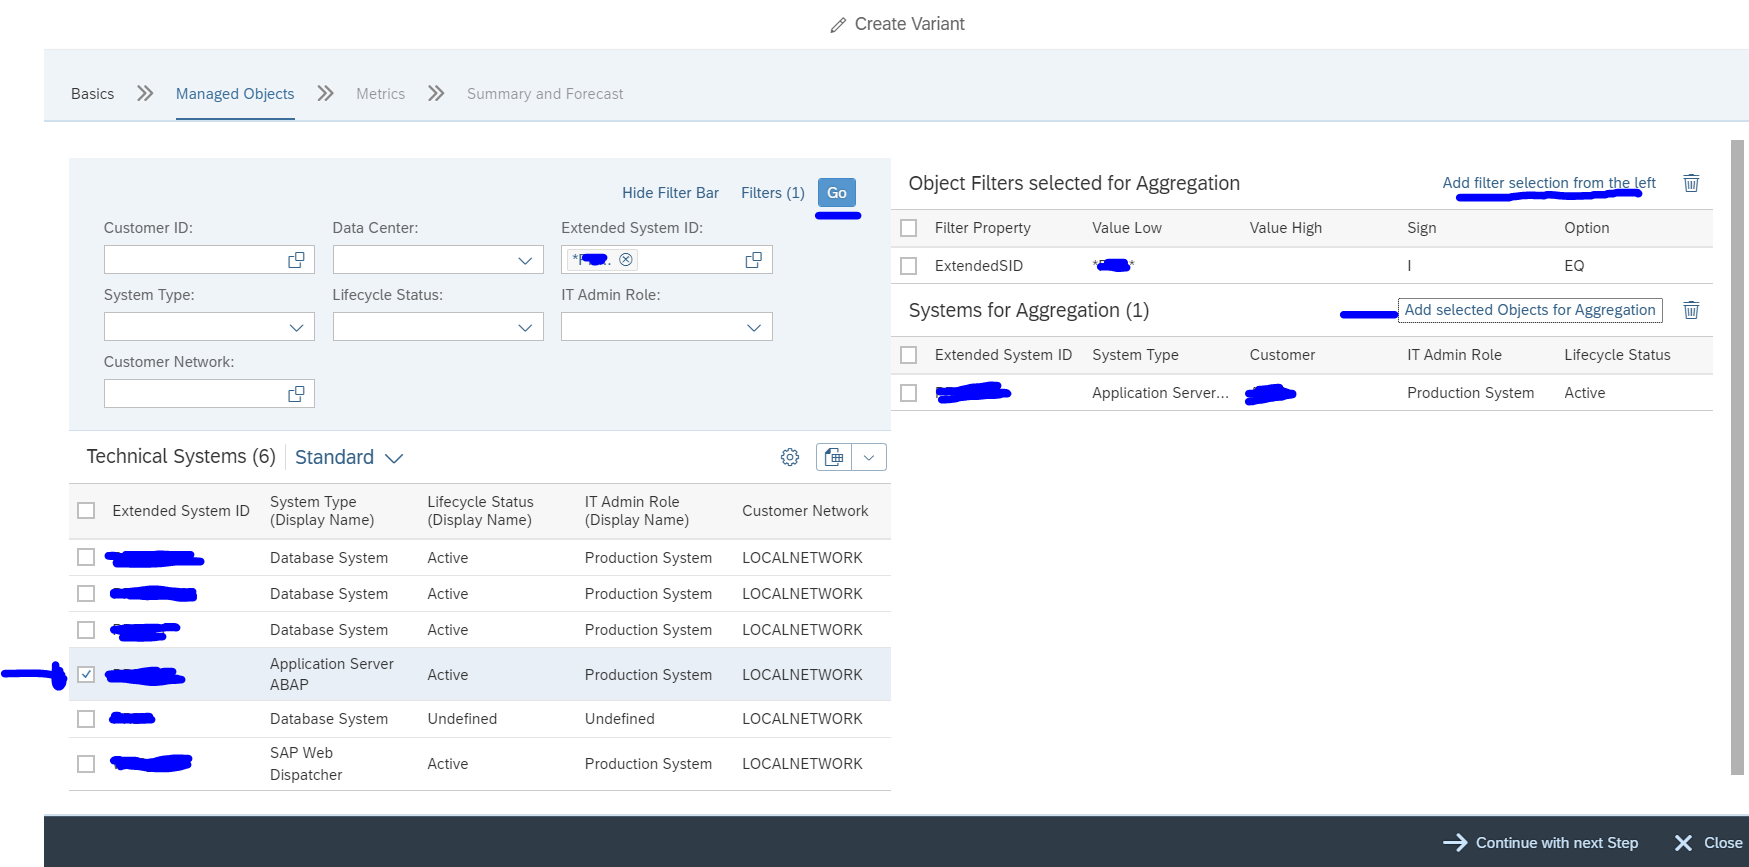
In sequence: first search for the extended system ID and press go in the top left section. In the bottom left section, select the system you want. In the top right section now select Add filter from the left button. And press the Add selected objects for aggregation button on the bottom right part. Now press the Continue with next step button:

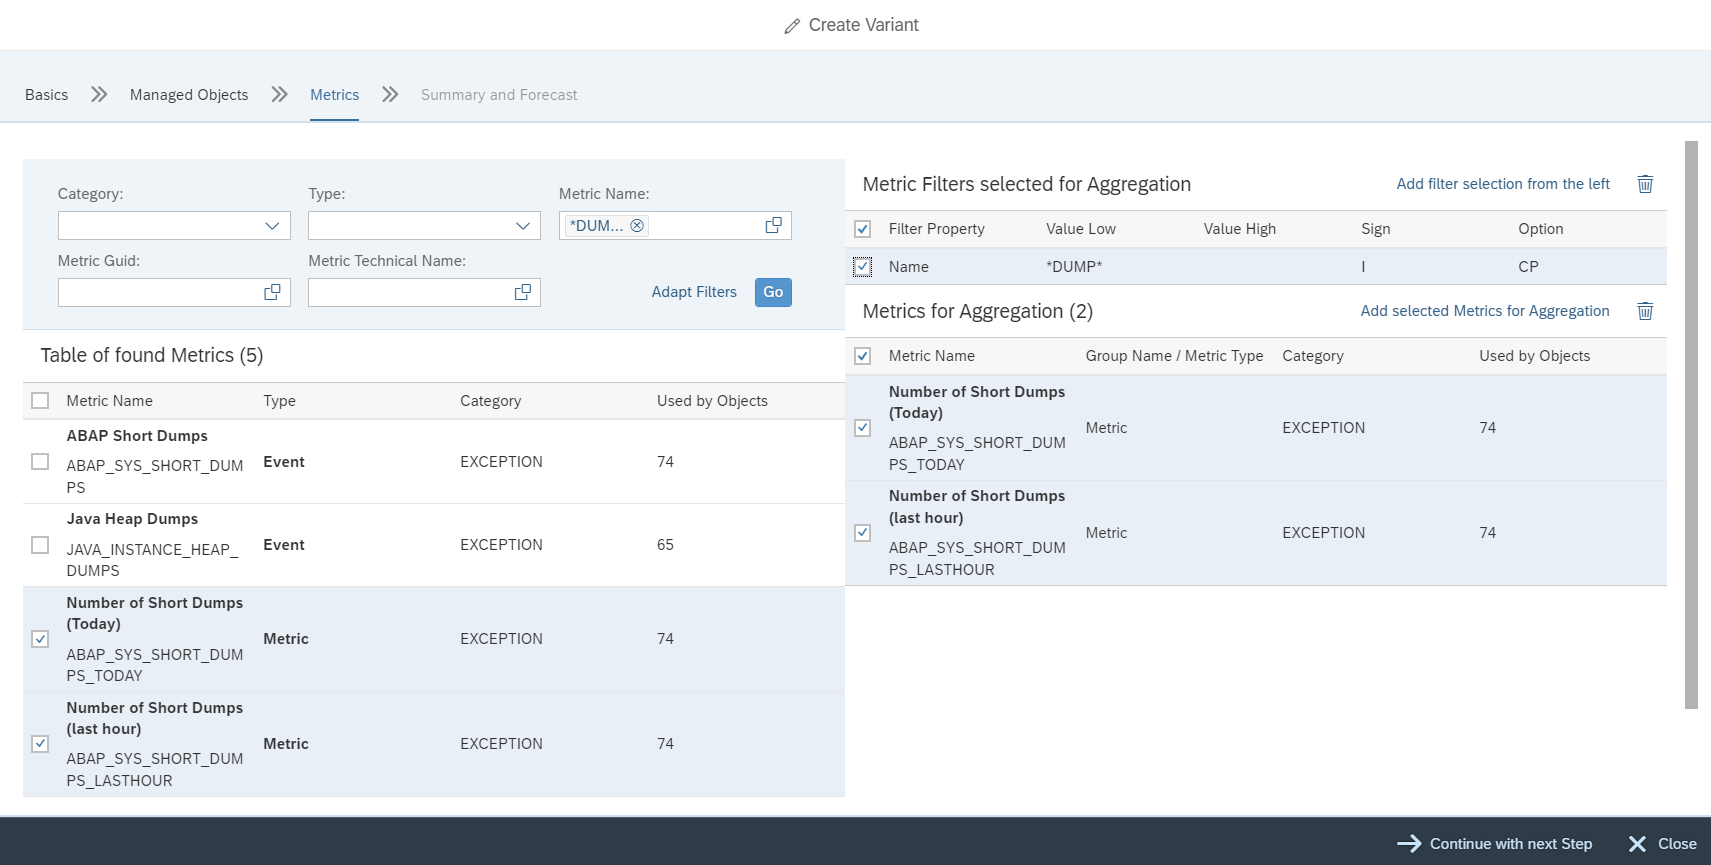
Select the metrics on the left hand side and add the filters on the right hand side. When done press the Continue with next step button:

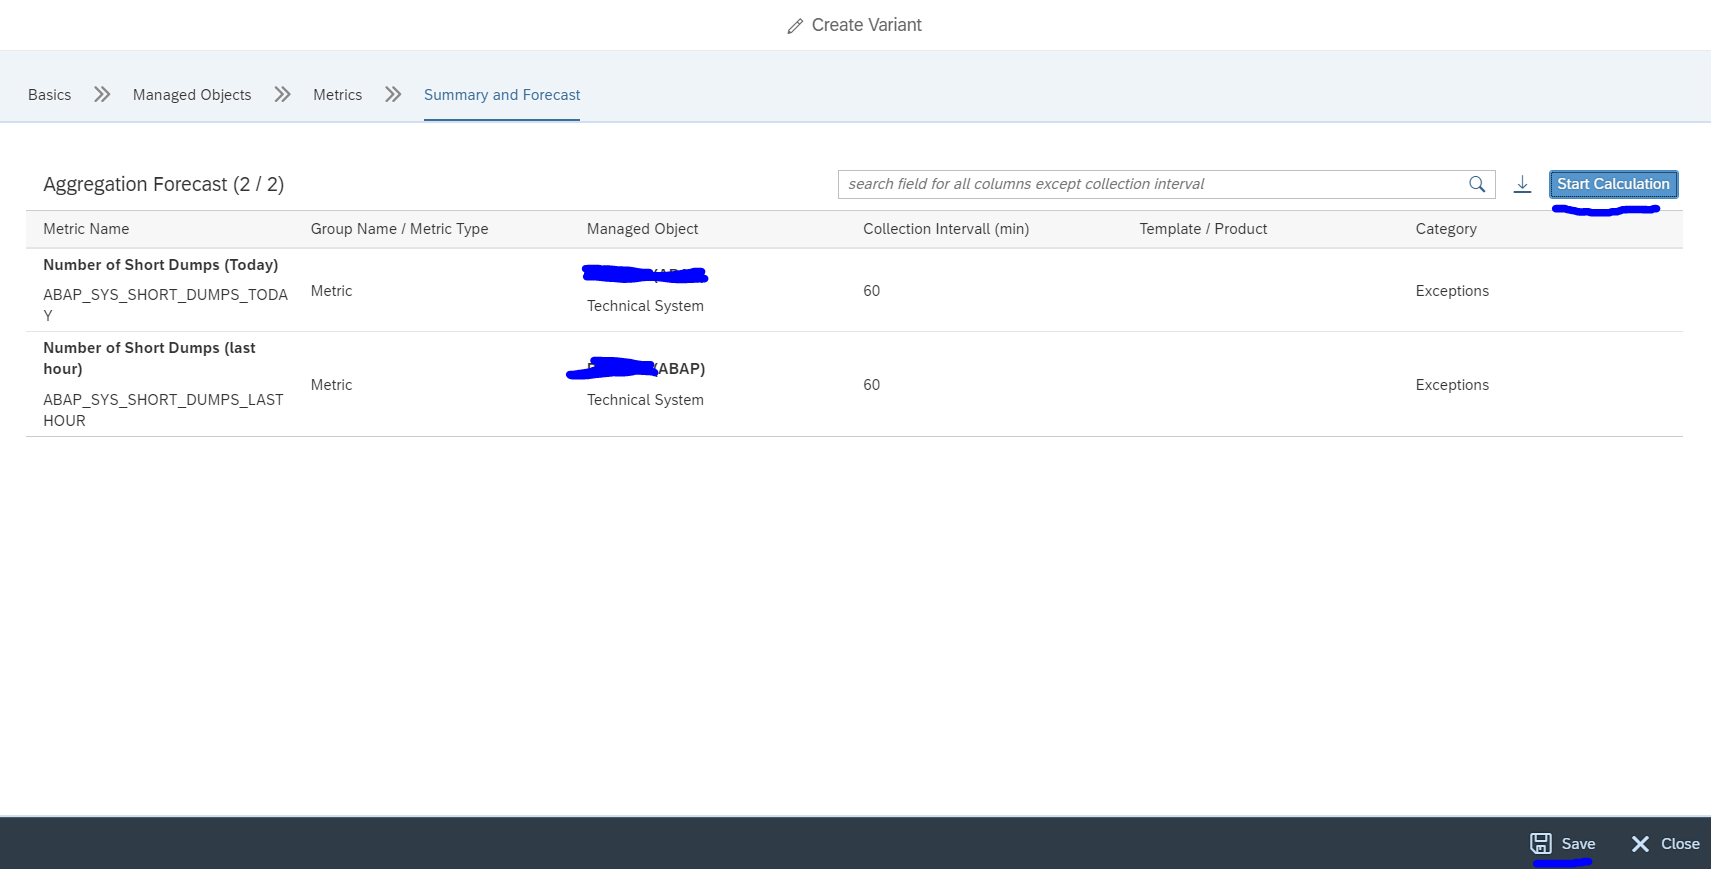
Press the Start Calculation button and check your results. Then press Save.

Using the aggregation framework

For using the aggregation framework there are no special requirements. Whenever you use an aggregated metric in system monitoring, you can simply use the details with a long period.

Settings for the aggregation framework

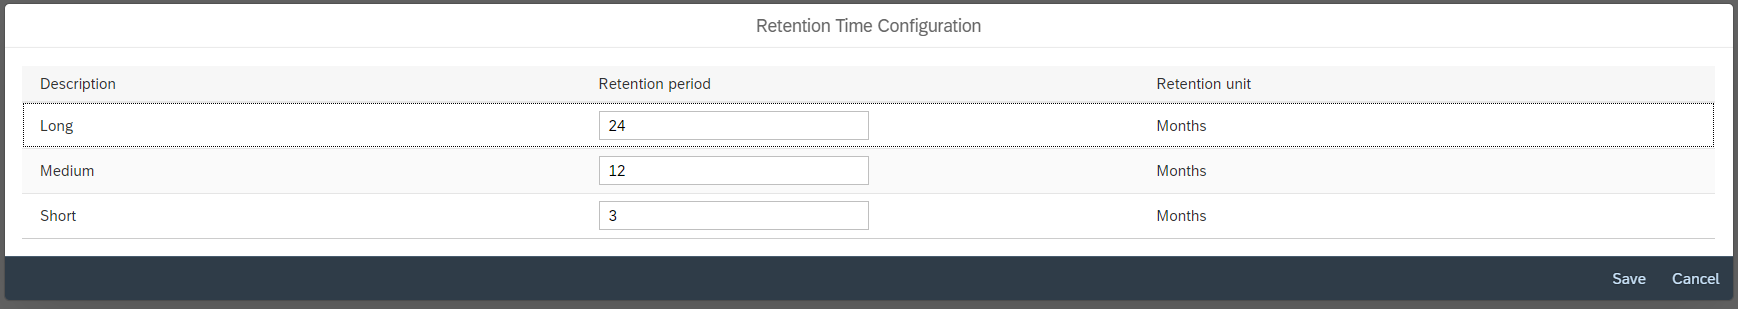
In the aggregation framework configuration screen, you can click on the configuration wheel top right to set the retention period for Short/Medium/Long:

Monitoring Netweaver Gateway systems…

This blog will focus on monitoring on Netweaver Gateway systems. These are used to host FIORI applications.

Monitoring productive Netweaver Gateway systems

When monitoring a productive system, you will need to finetune the monitoring templates for:

  • ABAP 7.10 and higher Application template, for the ABAP application
  • ABAP 7.10 and higher Technical instance template, for the ABAP application servers
  • System host template
  • Database template

In many cases you will also an SAP web dispatcher installed. This requires a separate SSI and monitoring setup.

ABAP APPLICATION TEMPLATE

Make sure you cover in the ABAP application template the following items:

Availability:

  • Message server HTTP logon
  • System logon check
  • RFC logon check
  • License status
  • Certificates expiry
  • Update status

Performance and system health:

  • Critical number ranges
  • SICK detection
  • Dumps last hour
  • Cancelled jobs last hour

Security:

  • Global changeability should be that the system is closed
  • Locking of critical users like SAP* and DDIC (see blog)

Fine tune the metrics so you are alerted on situation where the system is having issues.

Netweaver gateway template

For Netweaver gateway, also assign and fine tune the Gateway template:

This contains gateway specifics:

Web dispatcher template

If you use a web dispatcher, make sure you perform the SSI for it and assign the web dispatcher template:

The important custom check on URL availability is best to setup as well: read this blog for instructions.

ABAP APPLICATION SERVER TEMPLATE

Make sure you cover in the ABAP application server template the following items:

Availability:

  • Local RFC logon test
  • Local HTTP logon test (if any BW web scenario is used)
  • Local Logon test
  • Message server disconnects (see blog)

Application server performance and health:

  • Amount of critical SM21 messages
  • No more free work processes (see blog)
  • Update response times

You can consider to setup extra custom metrics for the application servers:

System host template

For system host the regular CPU, memory, disc template is sufficient. Finetune the thresholds to your comfort level.

Database template

Important items of the database template:

  • Database availability
  • Database health checks
  • Backup

Functions monitoring

Next to the availability and performance mentioned above, check also for monitoring certain functions:

Custom metric for web dispatcher URL monitoring…

When you are using a web dispatcher, you want to check that the main URL is available. You can achieve this via URL monitoring in health monitoring (see blog).

In some cases you want to integrate this vital start URL into system monitoring, since that is your main central tool.

You can create a custom monitoring metric to measure and act on this.

In the use case below we will setup URL monitoring for web dispatcher for SAP Netweaver Gateway serving FIORI pages.

Creation of the custom metric for web dispatcher URL monitoring.

Create a custom metric following the steps in this blog. The template to be adjusted is the technical system SAP Web Dispatcher template.

Don’t forget to tick it on for monitoring otherwise it is not active.

In expert mode create a custom metric.

Create technical name Z_WEBDISPATCHER_URL_AVAILABILITY:

In the data collection:

Data to enter: RFC on diagnostics agent (push). Select SRSM Ping Http Unsp. Select the HTTPS protocol and setup the URL to monitor: /sap/bc/ui2/flp?sap-client=xxx&sap-language=EN. This is the main FIORI start URL. The port number is taken from the LMDB settings of the web dispatcher: $SAP_WebDispatcherIPServicePort->SAP_IPServicePort.PortNumber$.

Define the threshold for alerting:

We take here three measurements. If we don’t then with a single glitch in the network an alert will be triggered.

And assign the metric to the system message alert group: