This blog will explain the technical activation and usage of RUM (real user monitoring) in SAP Focused Run.
Basic activation of RUM
First go to the Fiori settings tile:
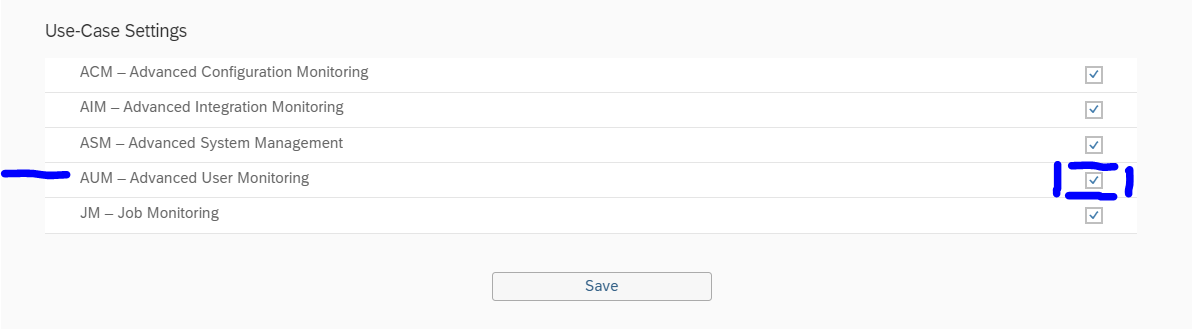
If the RUM function is not active yet, activate it and Save:
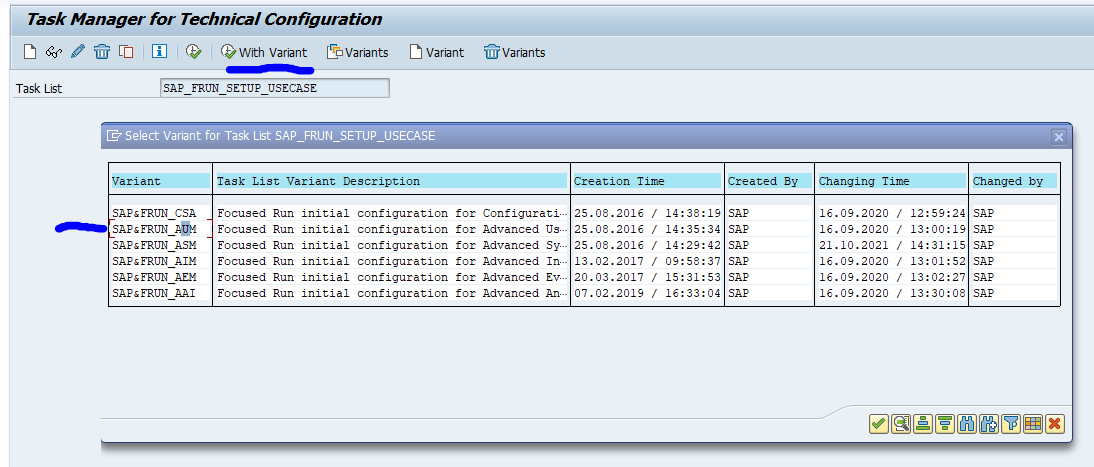
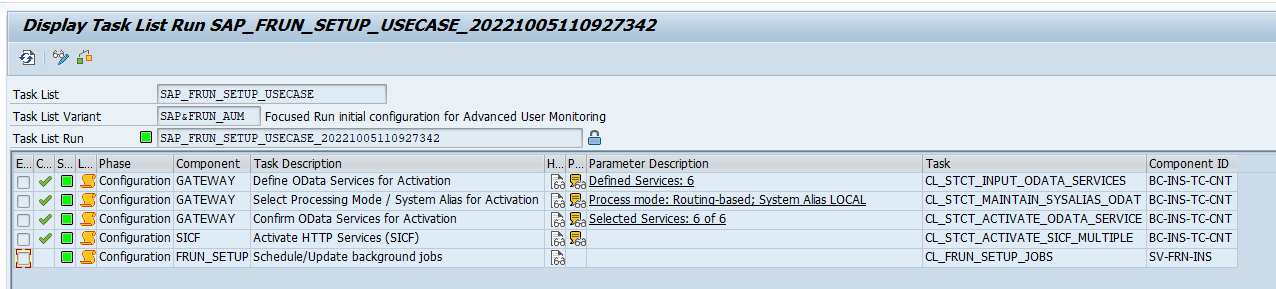
Now go to the FRUN backend ABAP system and start transaction STC01 and select task list SAP_FRUN_SETUP_USECASE and variant SAP&FRUN_AUM (advanced user monitoring):
In the task list setup also select the batch jobs:
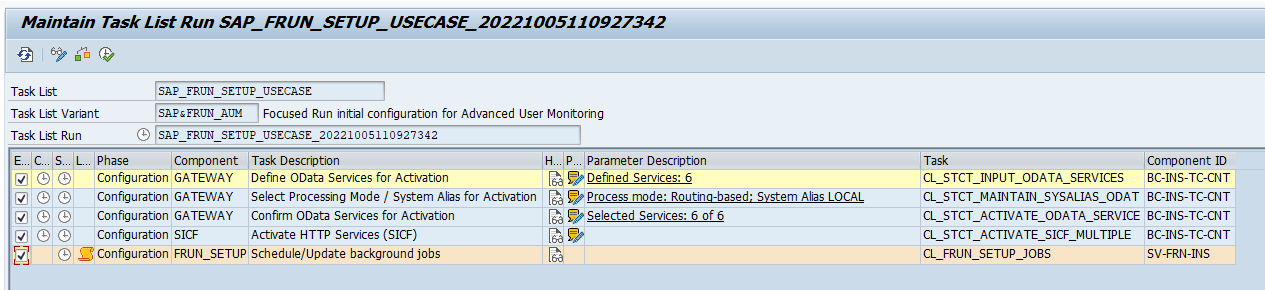
Now run the task list. This should not take longer than 1 minute. Result green is ok:
Technical activation of RUM per managed system
Per system for which you want to activate the RUM function proceed as follows:
Go to the SSI Fiori tile:
Select the system:
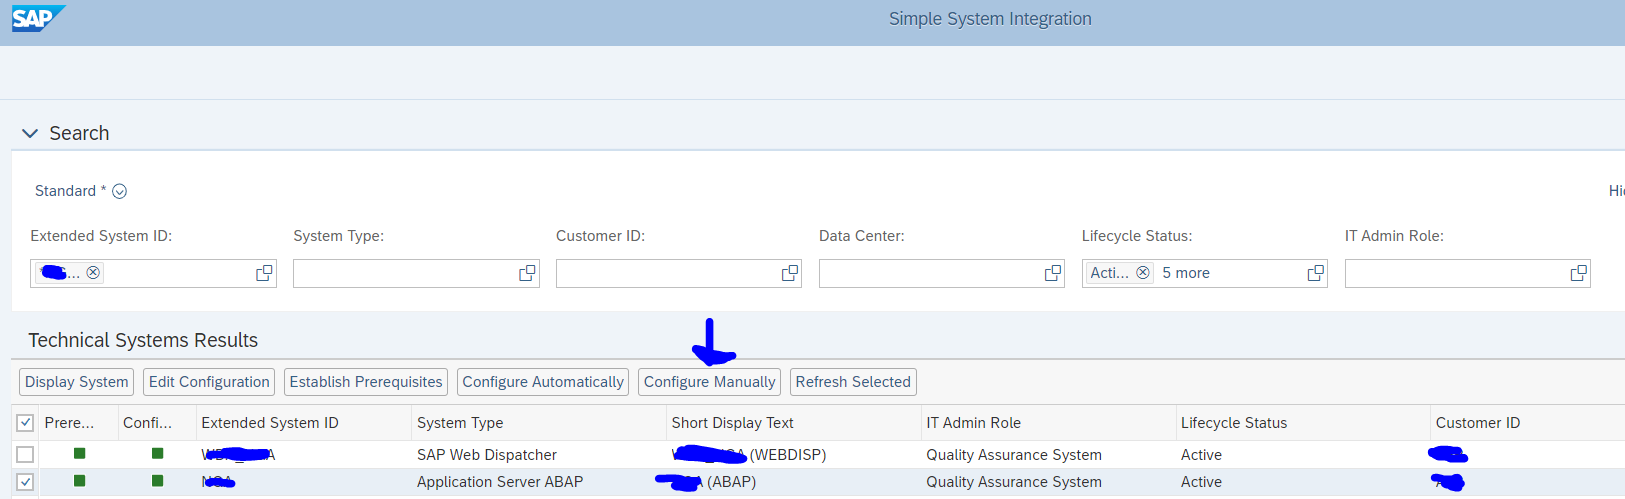
Now press the Configure manually button and new screen opens:
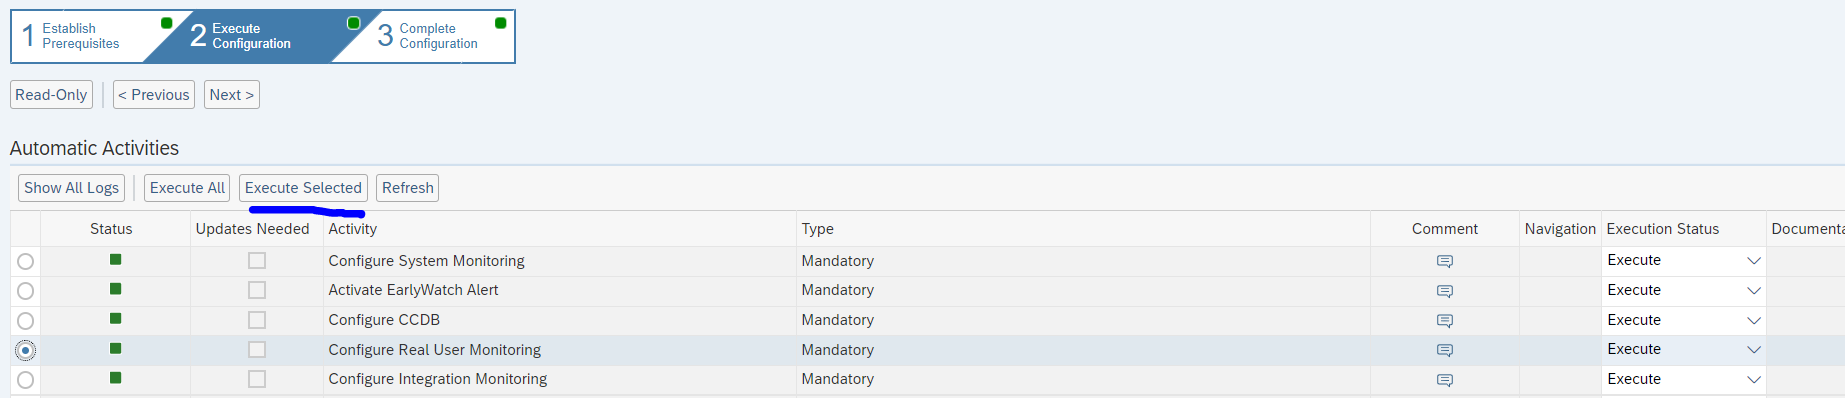
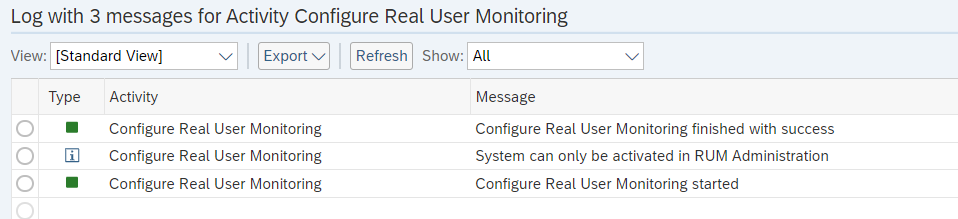
On top first select Step 2 for Execute configuration. And select the Configure Real user monitoring step. Press the Execute Selected button and wait for the log to show success:
Alternatively you can also do the SSI completely new on the first screen by selecting the Configure Automatically button.
Background: RUM is an intense function. If it is not active, the agent does not have to do anything. The re-do of the SSI is needed to tell the agent on the system to start sending RUM data once it is activated in FRUN configuration.
With this step the managed system is prepared.
Functionality activation of RUM per managed system
Now we can go to the RUM Fiori tile:
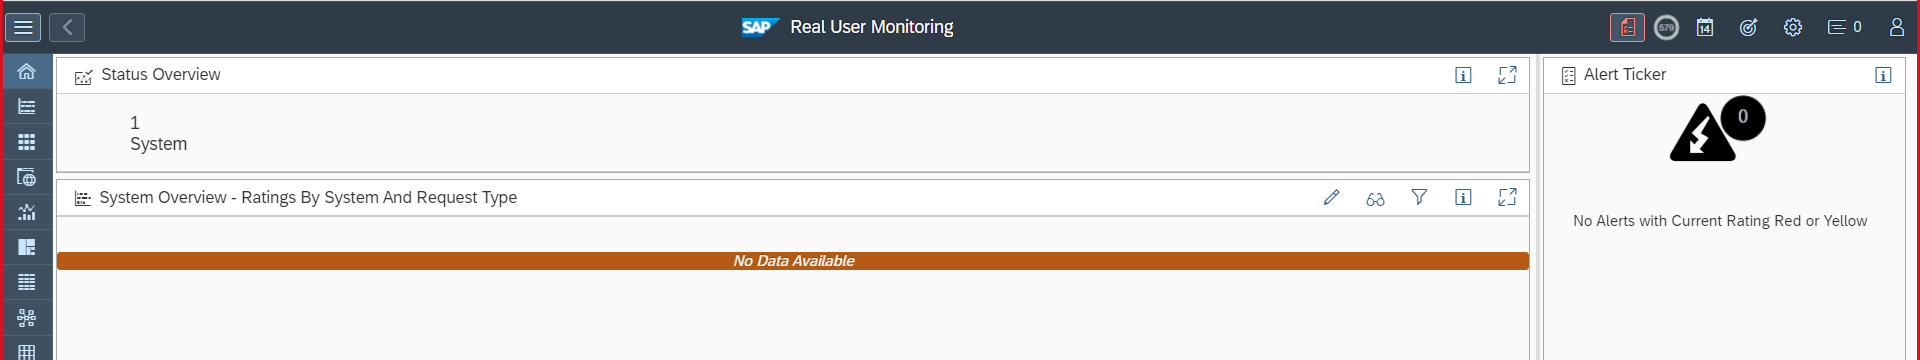
After scope selection nothing is active yet:
On top right choose the Configuration button and start with the housekeeping settings:
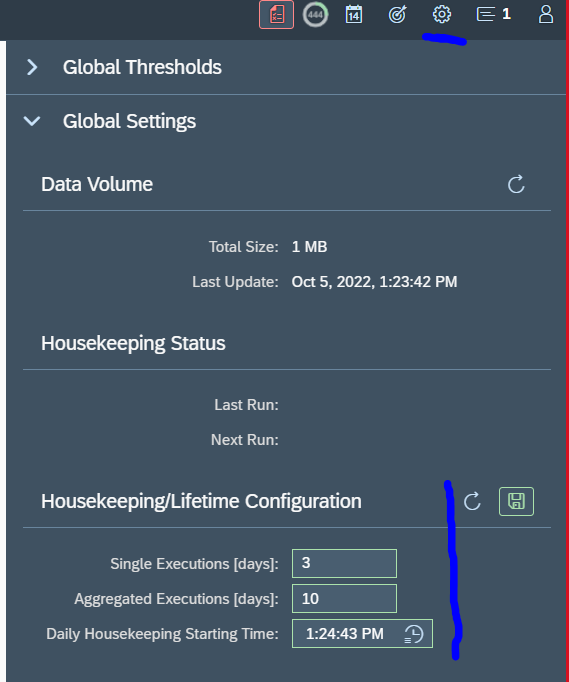
WARNING: RUM can use a lot of data in your database. It can also consume a lot of your Focused Run licensing. If you use too much; reduce amount of systems for which you activate RUM and reduce the retention periods in the screen above. See blog on Focused Run license measurement.
Go to the Systems section and toggle the Activation for the system to On:
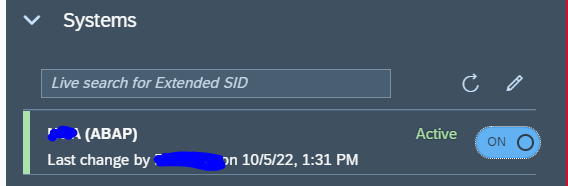
Wait for the configuration and data collection to happen. Take 5 to 10 minutes patience for this step.
After the step, refresh the screen and it should look like this:
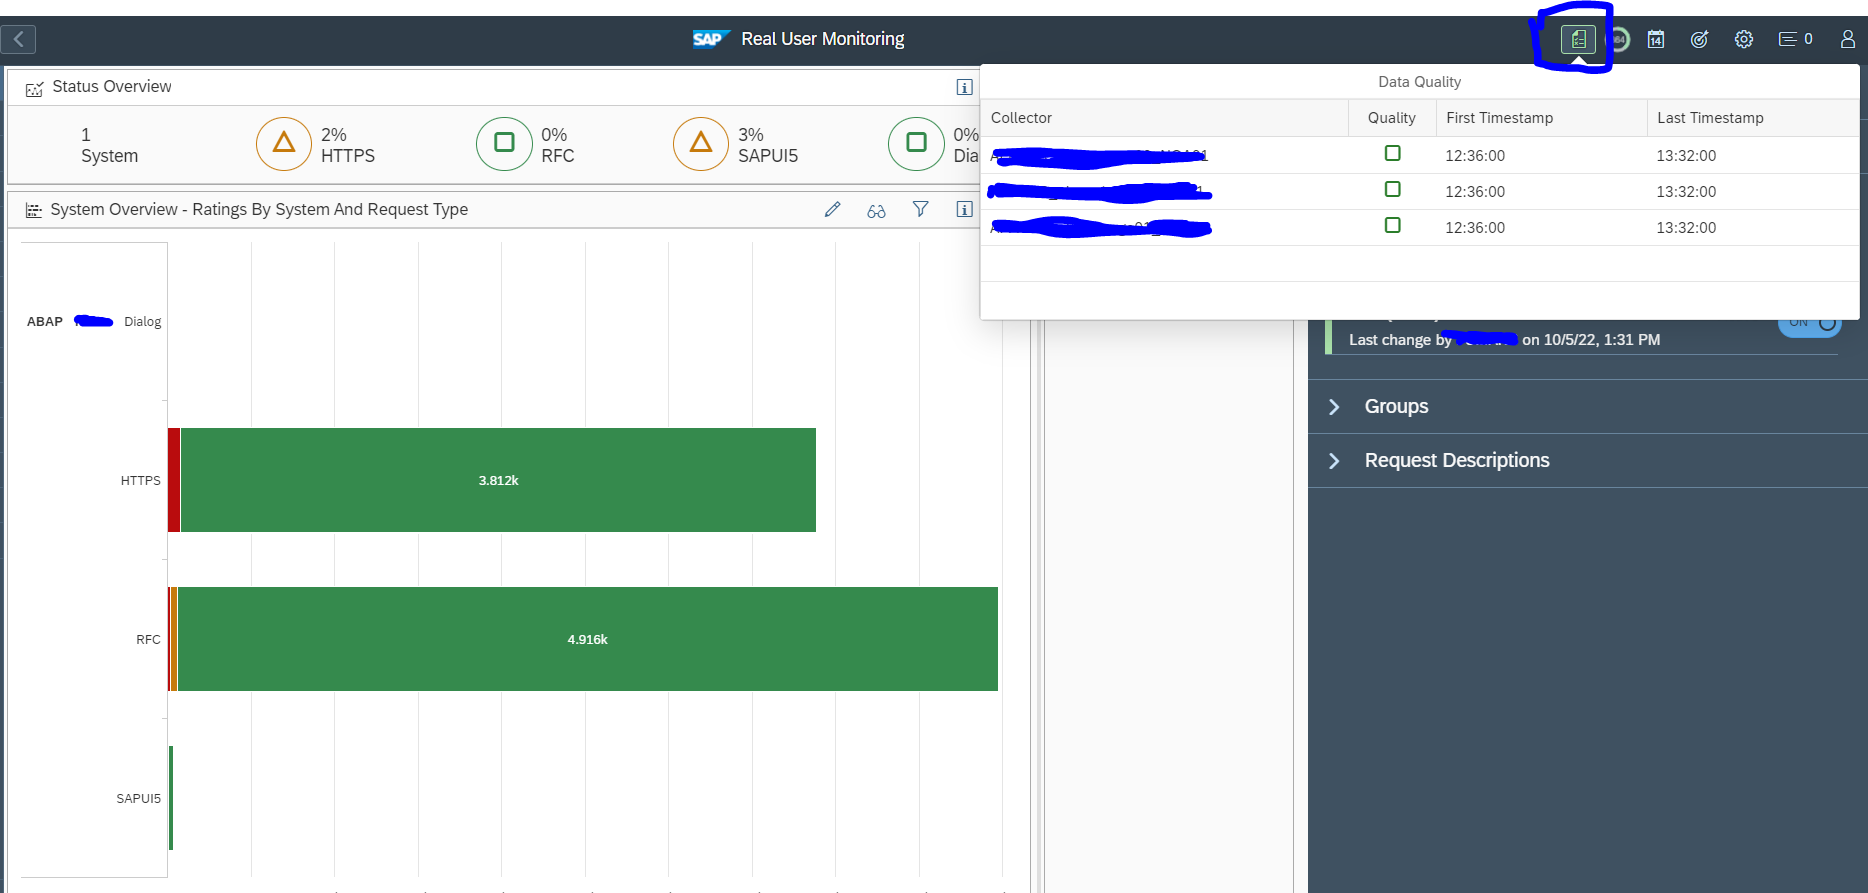
Data should appear on the left. On top, select the icon Data Quality. This shows the data collection status per host. The icon will be red at start and turn green after 30 minutes.
Using Real User Monitoring: request tool
Now the setup is done, we can start to use the tool. The main screen is the requests tool:
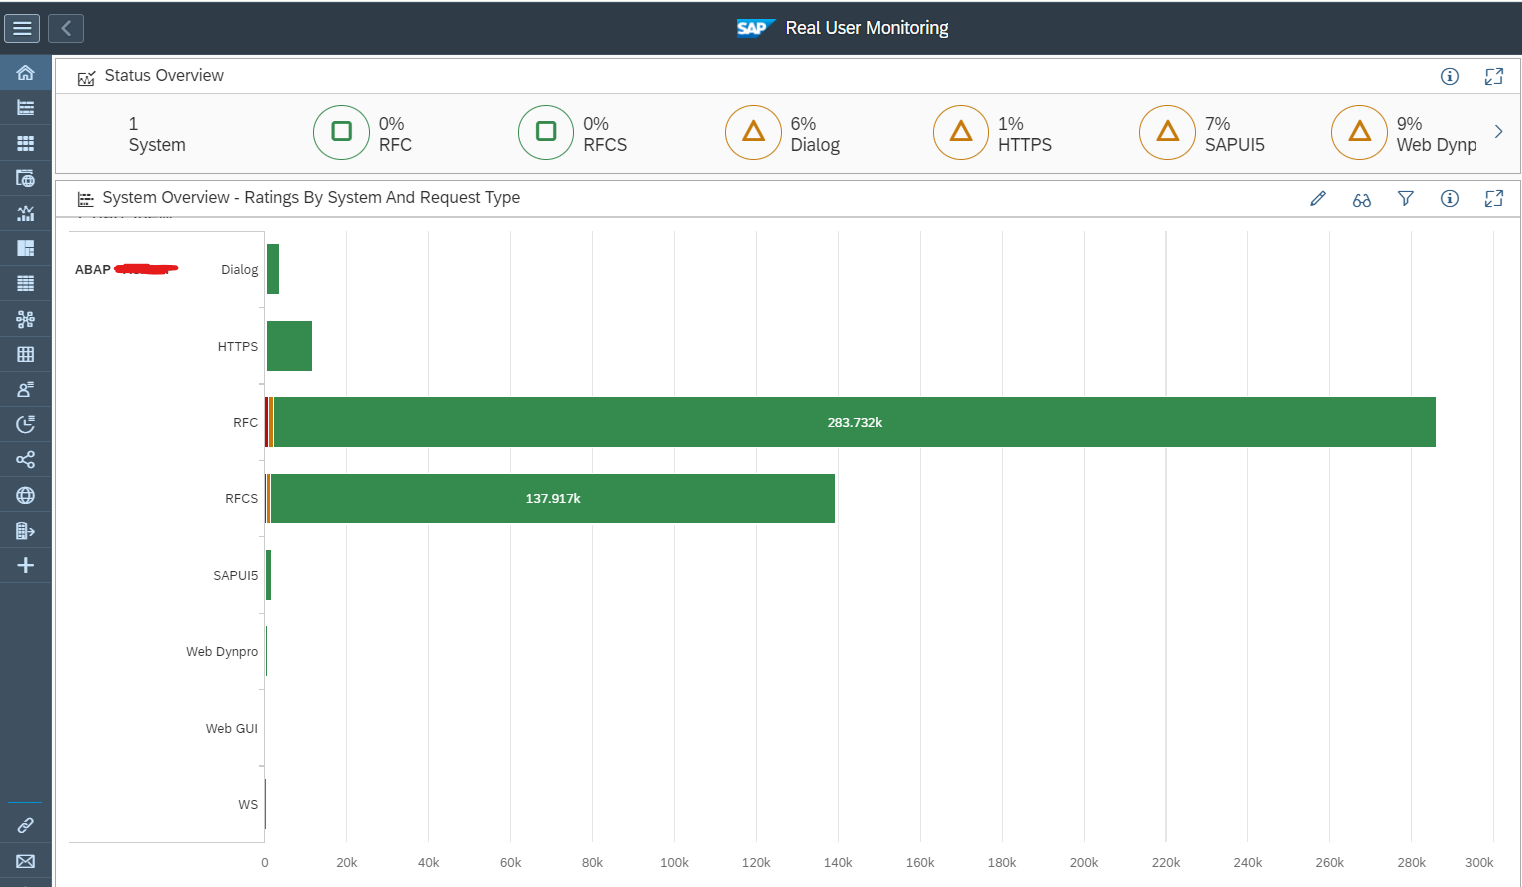
From the start screen you can zoom into the task type you are interested in. As example we zoom in to the task type Dialog:
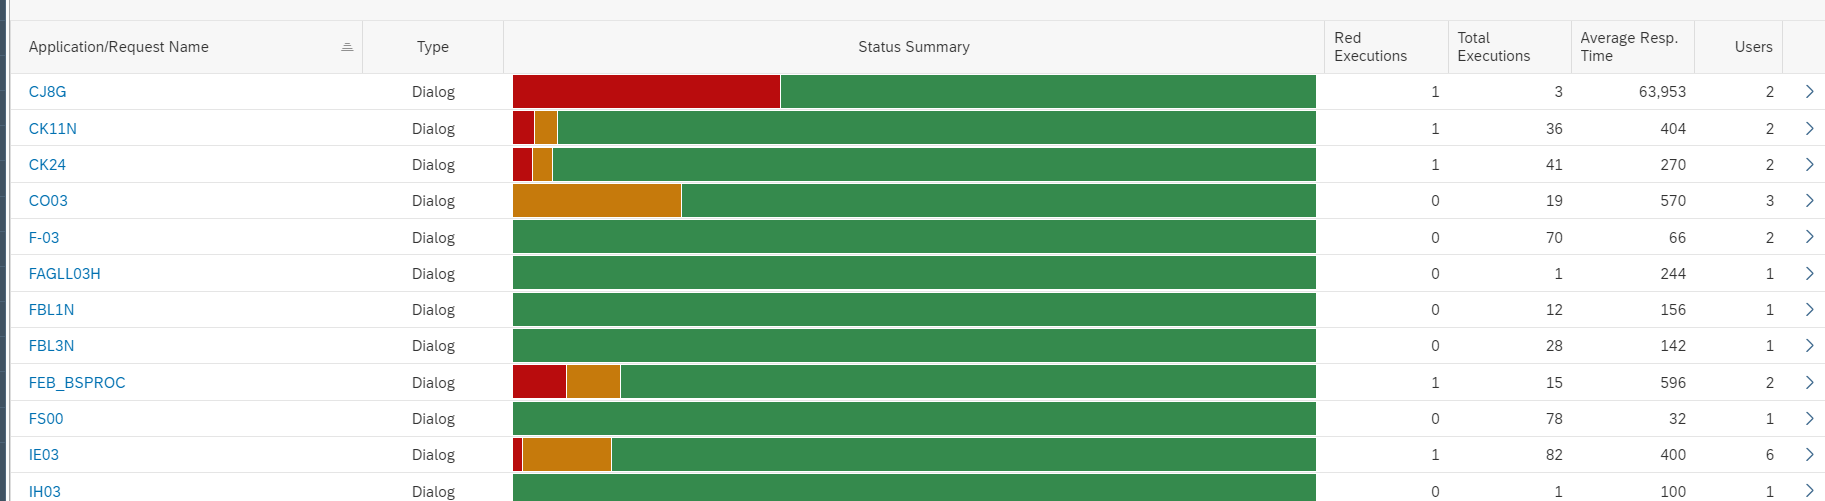
Drill down all the way:
Here you can see for which user and when the action was done. Unfortunately the action description is pretty technical: action 2000 in transaction CJ8G still might leave you a bit puzzled.
Using Real User Monitoring: cards tool
The second tool is the cards tool:
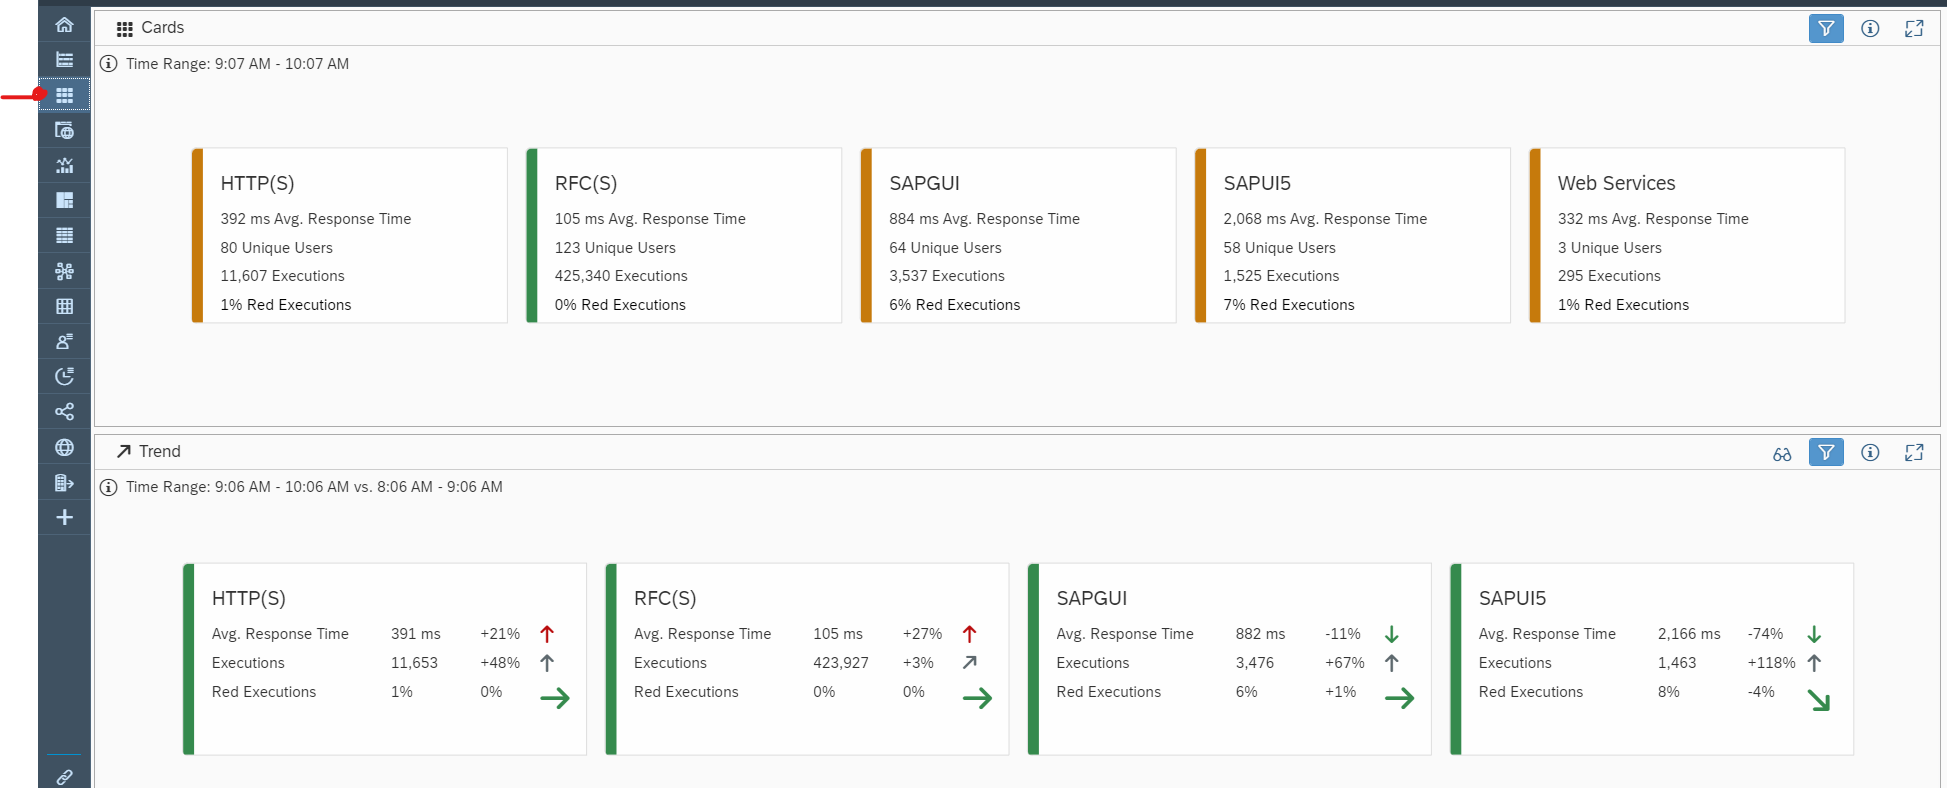
Here the entry point is the task type or trend in card format.
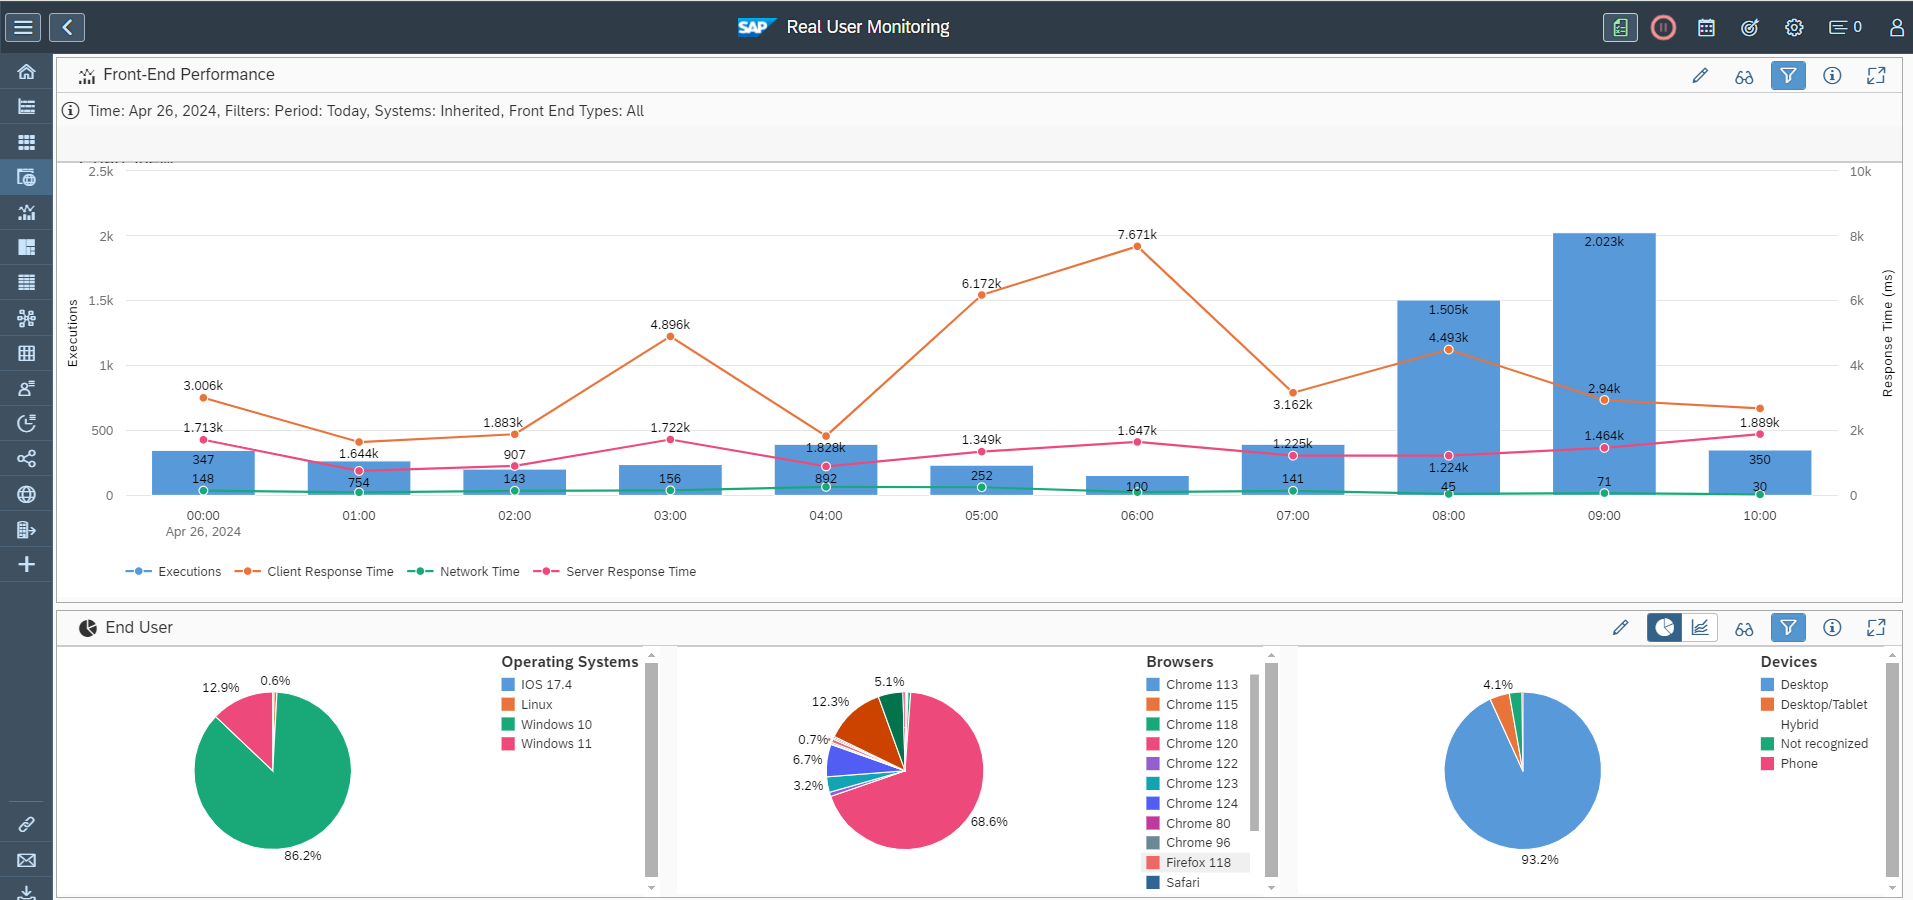
Using Real User Monitoring: front end tool
The front end tool gives an overview of front end response times and on clients used on your system:
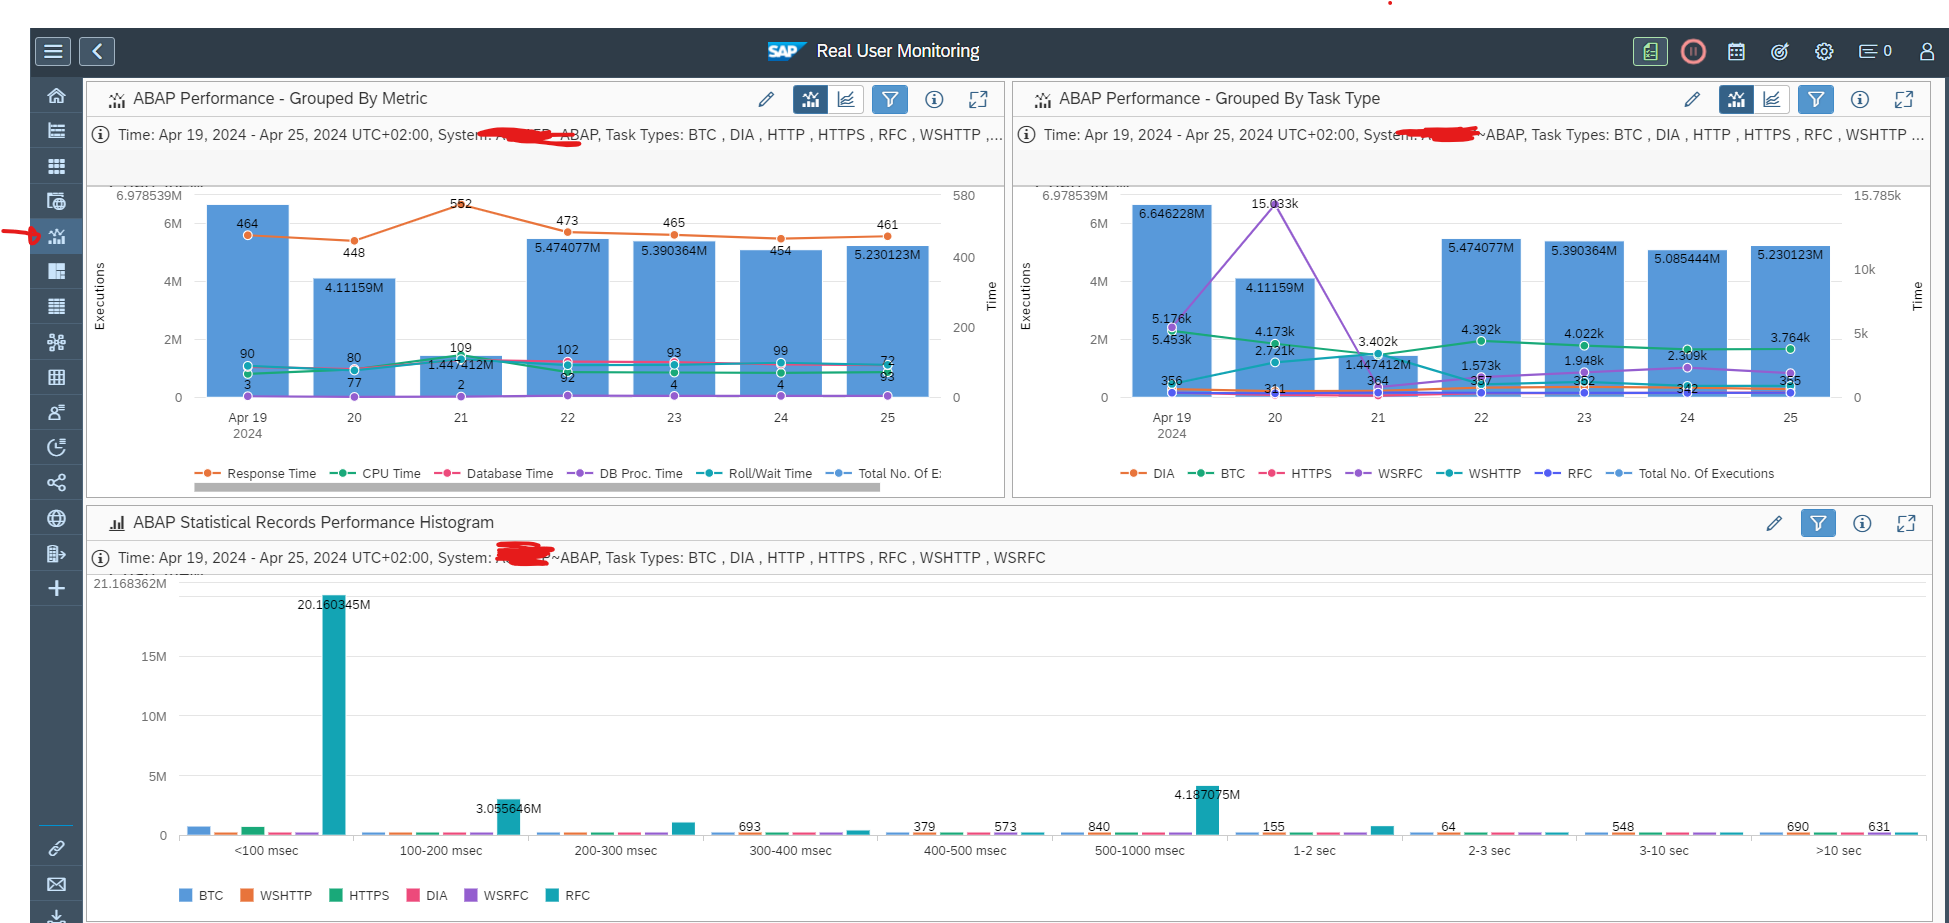
Using Real User Monitoring: back end tool
The back end tool gives an overview of the back end performance and distribution of the response times:
Using Real User Monitoring: hot request tool
The hot request tool gives a cross section for high usage and performance.
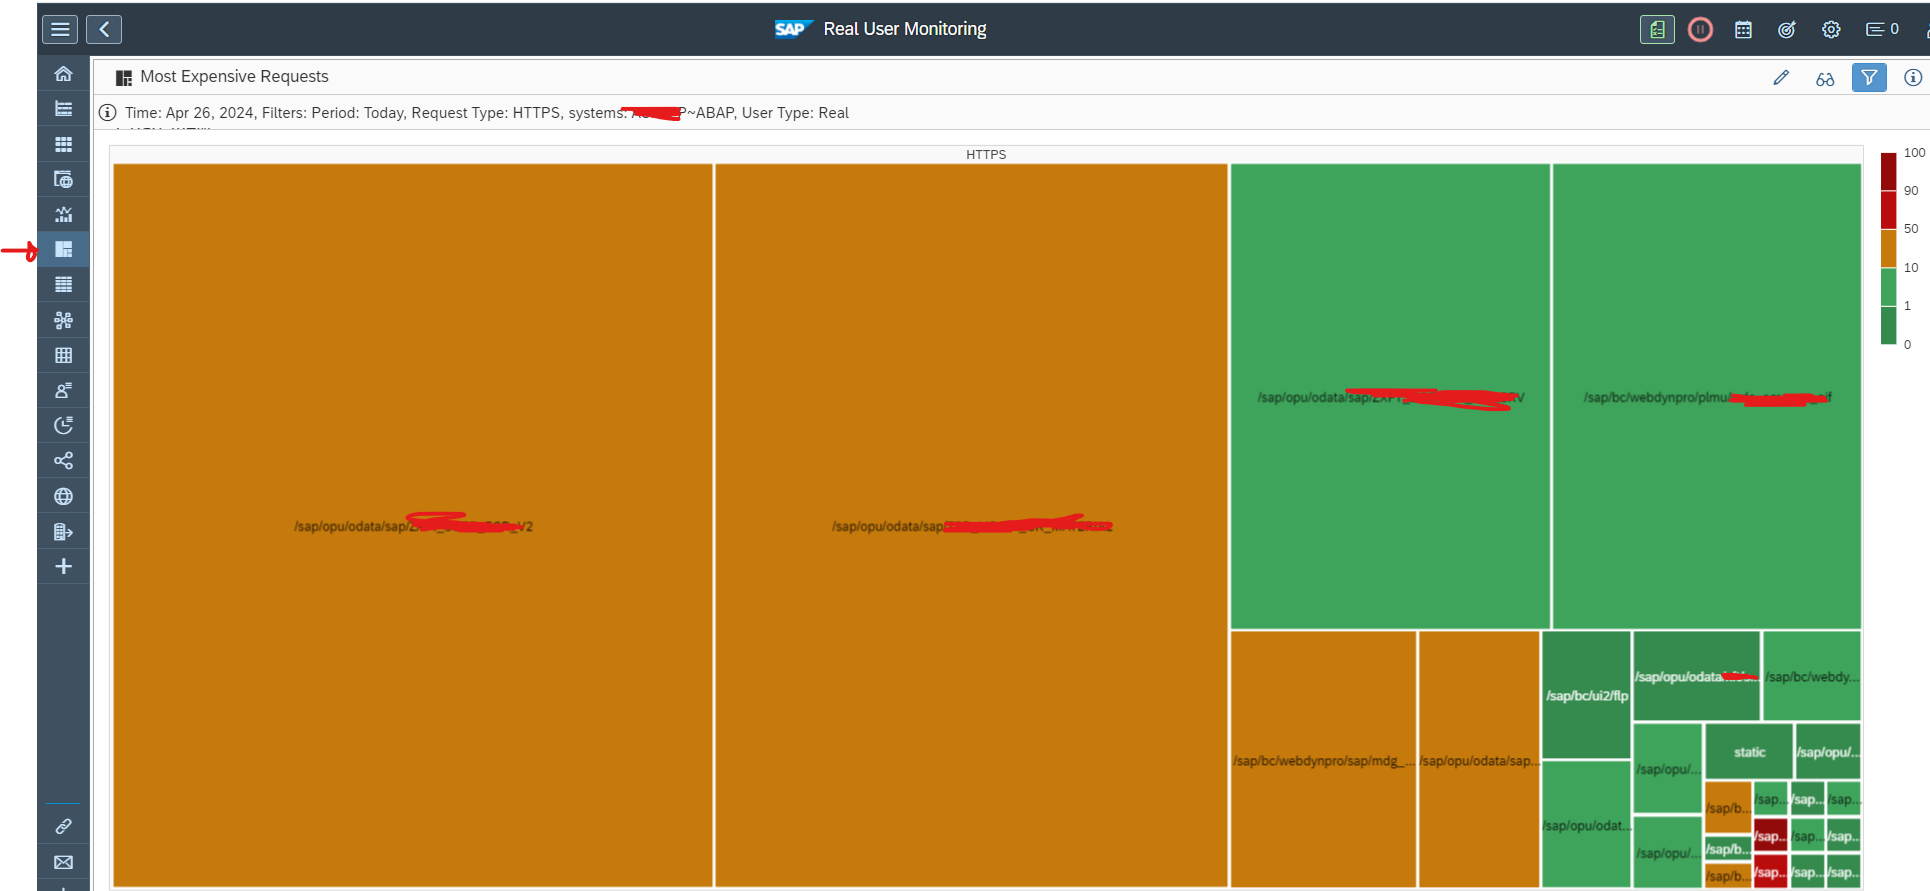
If a part is used more, the block size is larger. In this caser, zooming in on the less used red part might be useful. But is it also interesting to analyze the large used orange blocks, since a lot of users are impacted.
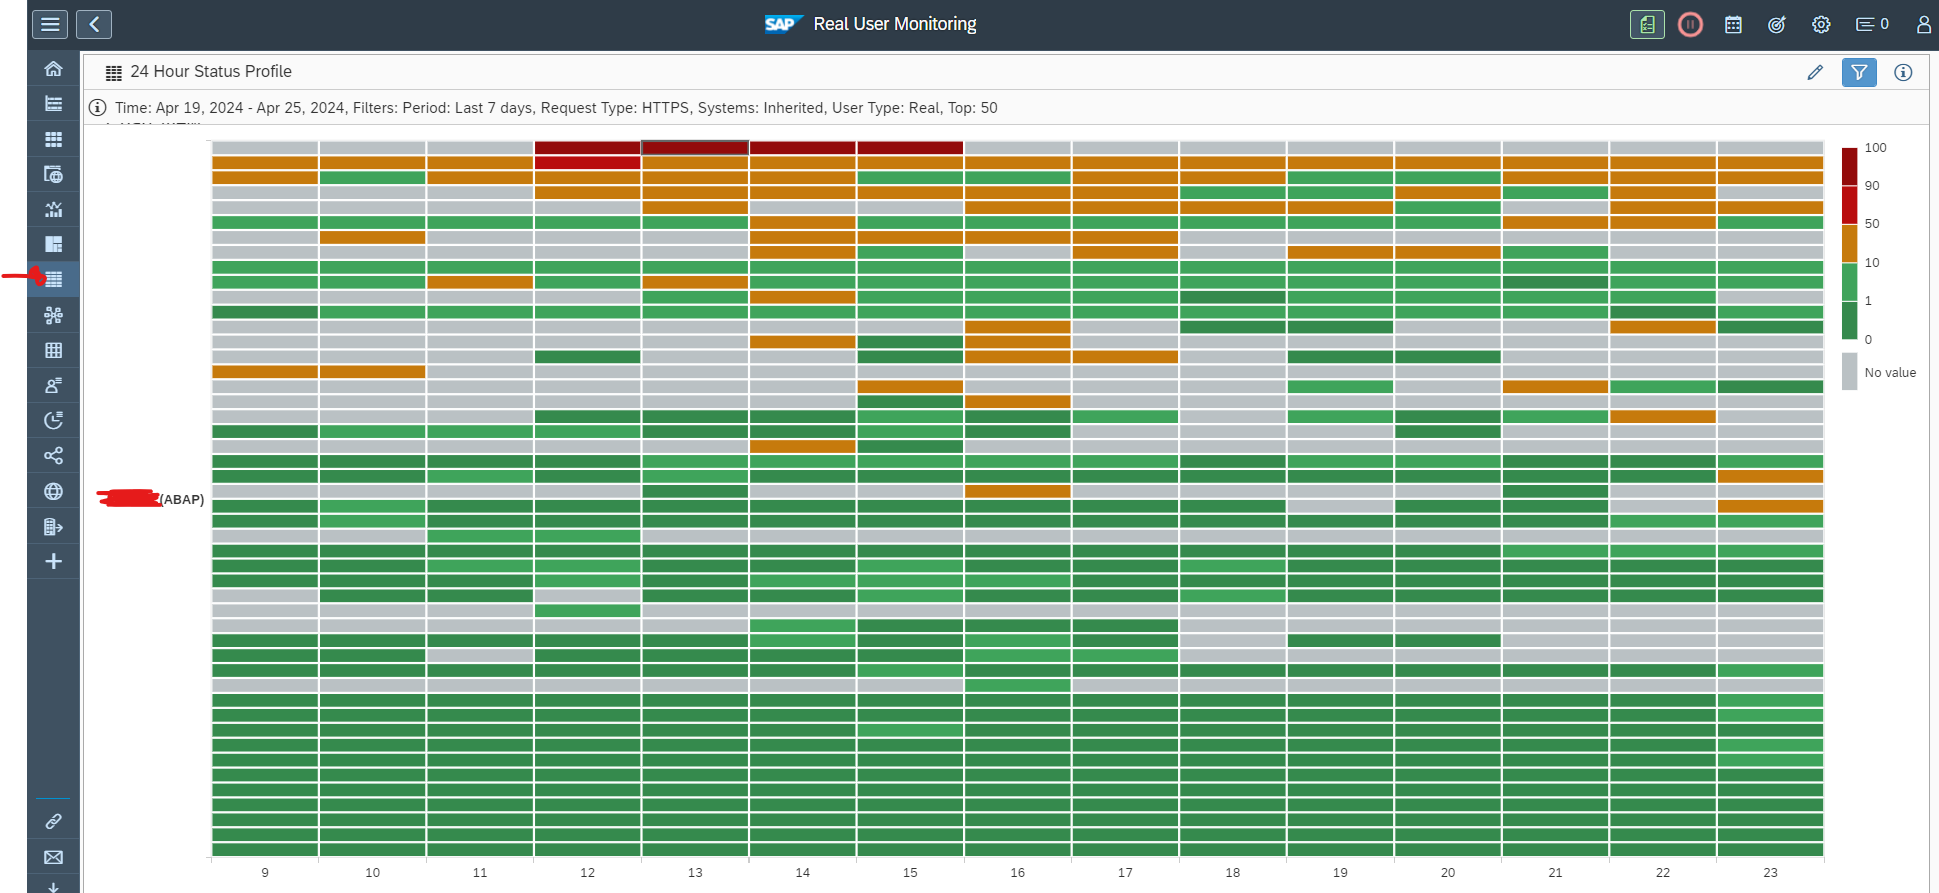
Using Real User Monitoring: 24 hour profile
The 24 hour profile tool can be used to see if there are hours of the day where performance is worse than others. Some might be expected. But also: you might want to put in extra capacity to deal with peak loads. Or schedule some intense batch jobs at different times.
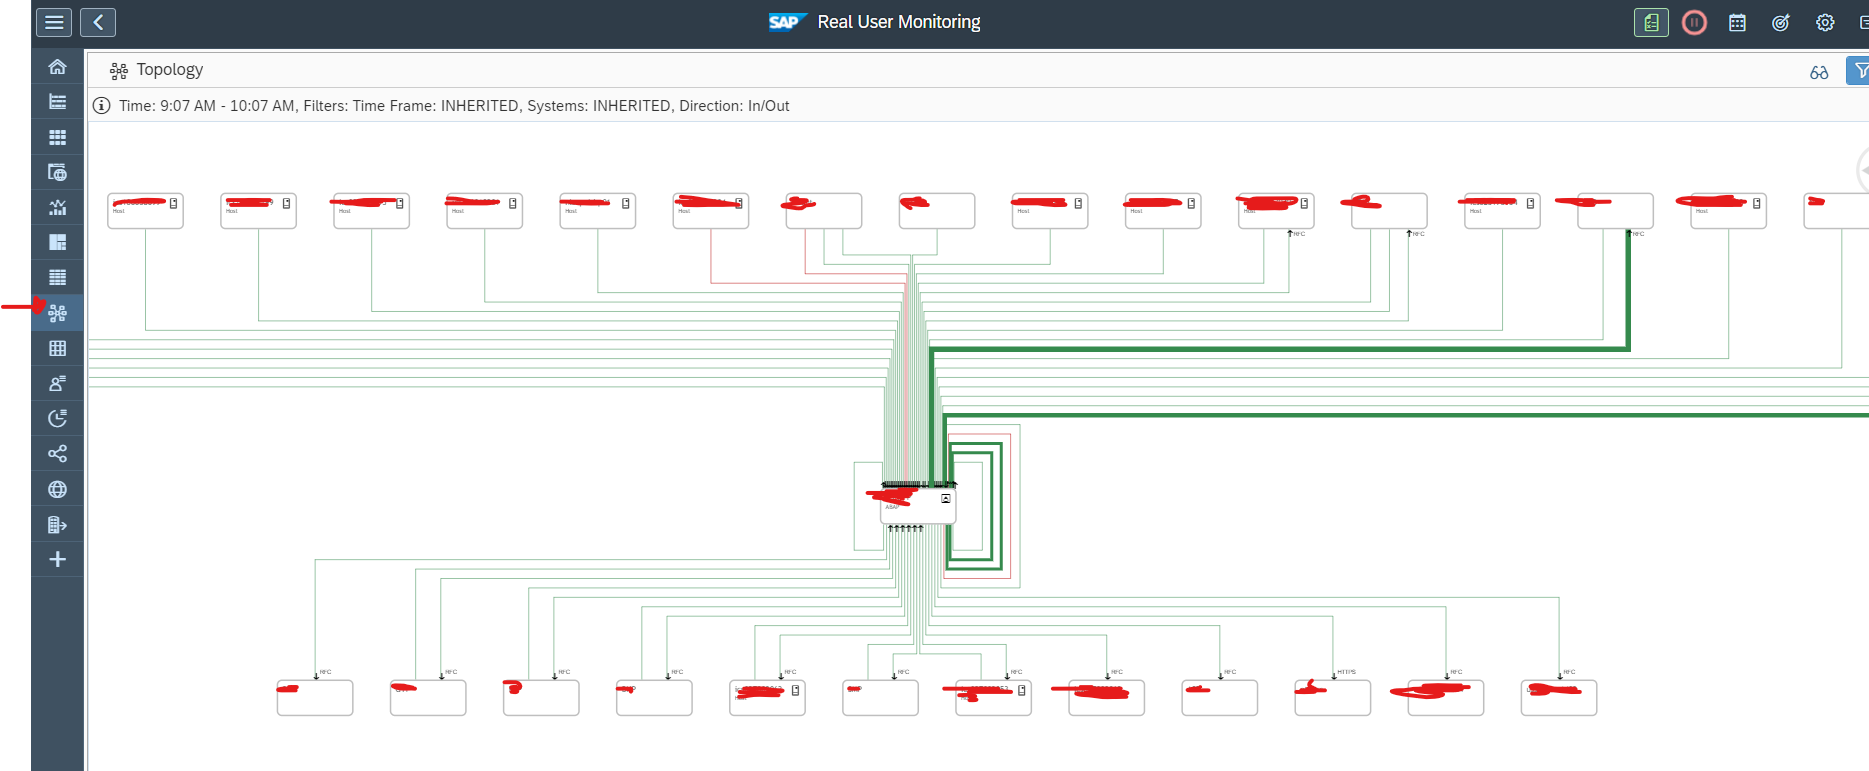
Using Real User Monitoring: topology
The topology tool can help you to analyze where data flow to and from your system are running and with which performance quality:
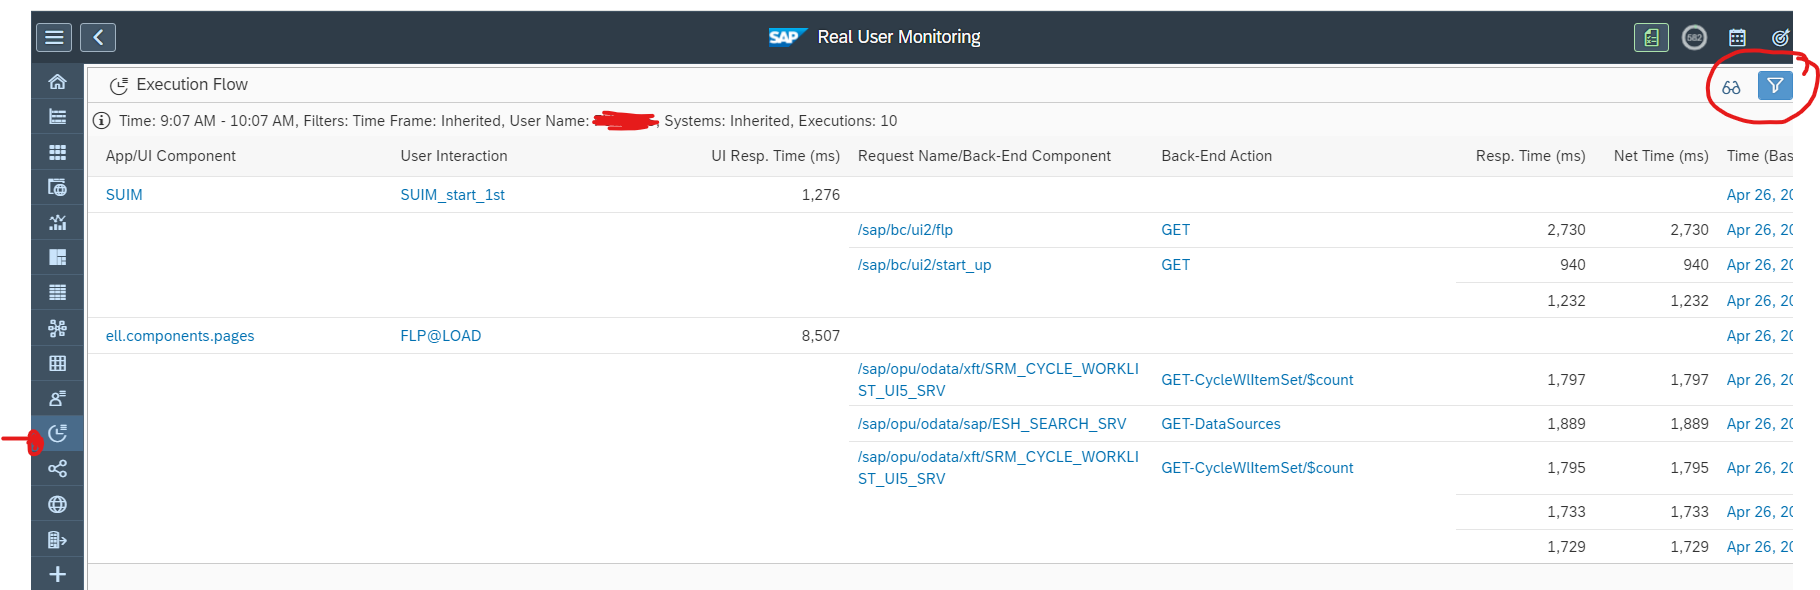
Using Real User Monitoring: execution flow
In some cases a specific user is complaining about poor performance. You can use the execution flow tool to filter on a specific user ID. After opening the tool, press the filter button to detail the user ID:
More tools
RUM has many more tools. Just explore the menu on the left side if another tool is useful for your situation.