SAP Focused Run Alert Management application allows us to create a custom dashboard that can help us to report on alerts as per our custom alert reporting needs.
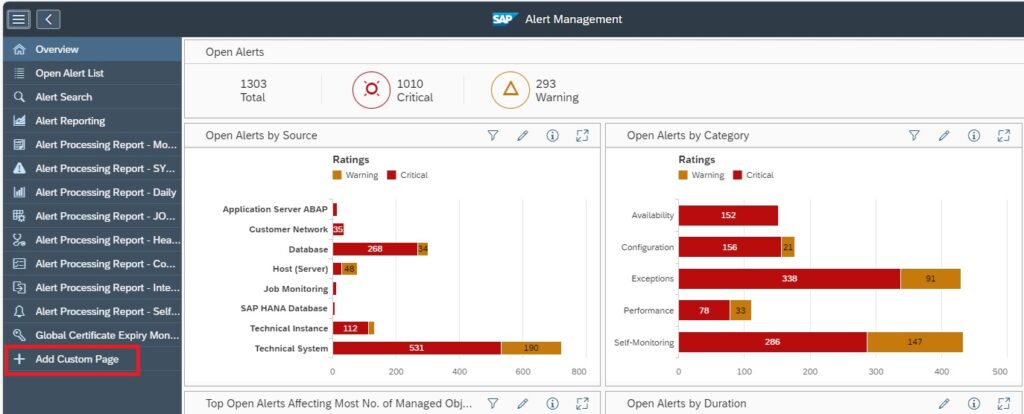
To create a custom dashboard, in the Alert Management App, click on the +sign (Add Custom Page) on the navigation panel.
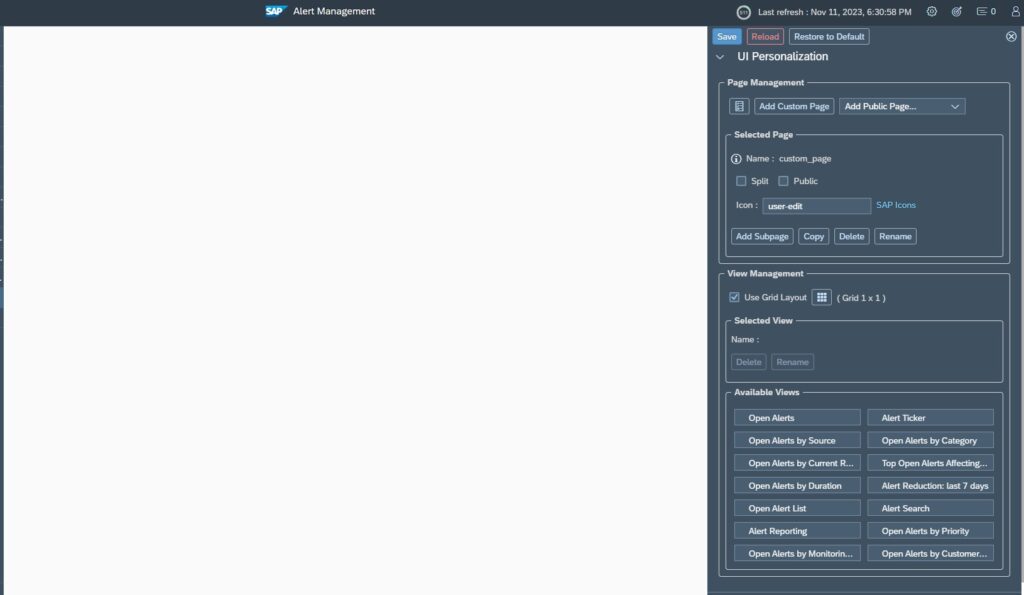
Upon clicking on Add Custom Page , a blank pane is displayed along with the setup panel to its right.
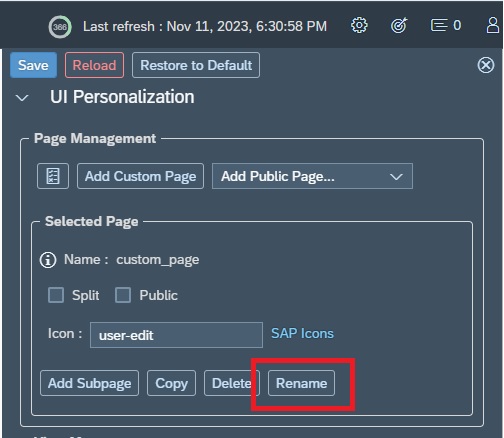
The first step in setup is to give a name to your dashboard. For this click on Rename button in the setup area Page Management.
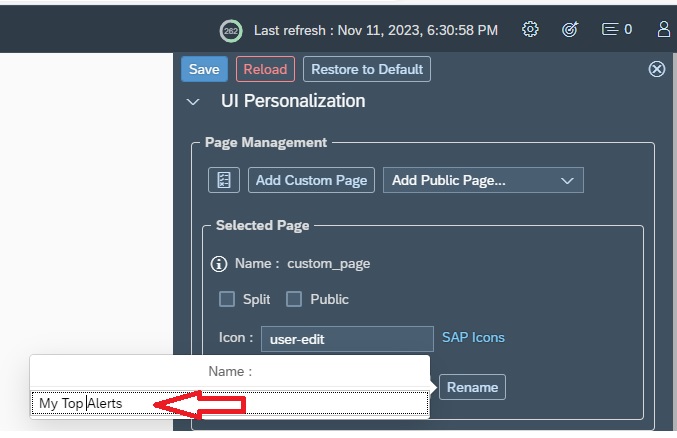
In the pop-up provide the name for your dashboard.
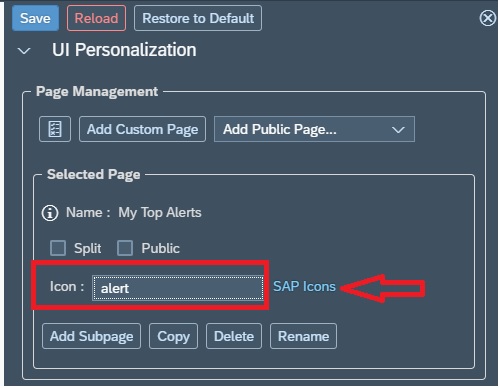
You can also give a meaningful Icon to your dashboard that will be displayed in the navigation panel. For this provide the sap icon name in the Icon field. To get a list of available icons you can also look in the SAP Icons link which takes you to the Icon explorer.
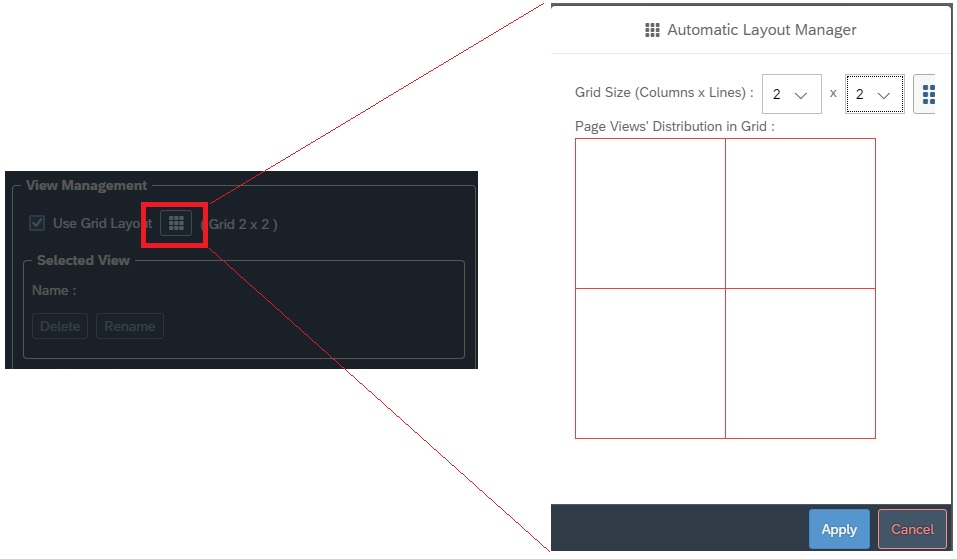
The next is to specify the grid layout (Number of rows and columns)in the view management section of setup area. By default it is 1×1 which means you can add only 1 dashboard. If you want to add more dashboards, accordingly you can adjust the grid.
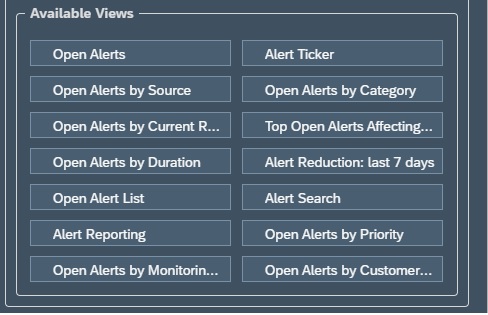
Then you need to select a view, based on what you want to show in the dashboard, by selecting from the list of available views. You can select a view by simply dragging and dropping in the dashboard layout.
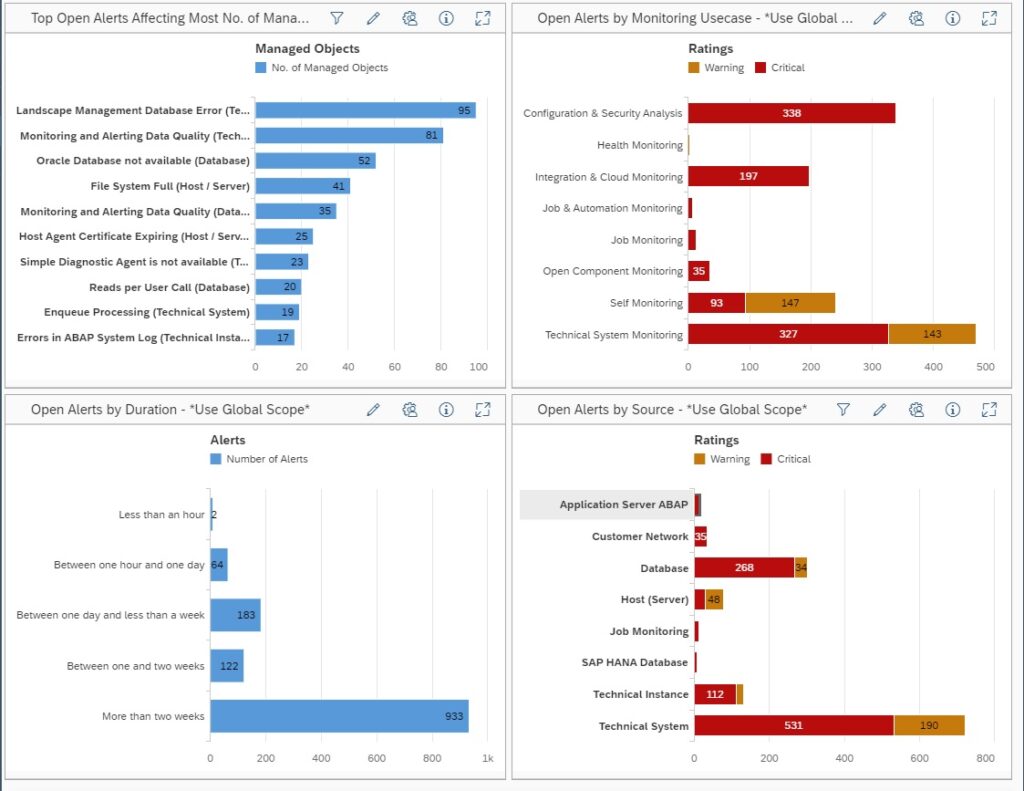
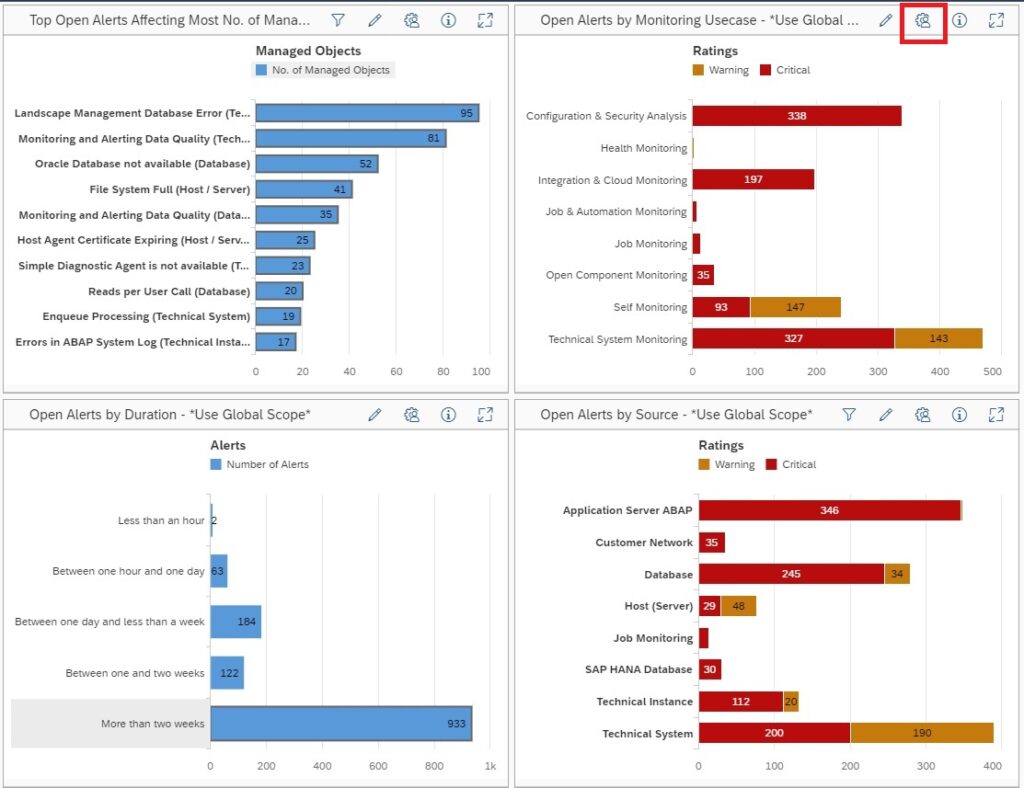
In this example we have selected 4 views in the 2×2 grid layout.
- Top Open Alerts affecting most no. of Managed Objects
- Open Alerts by Monitoring Usecase
- Open Alerts by duration
- Open Alerts by source
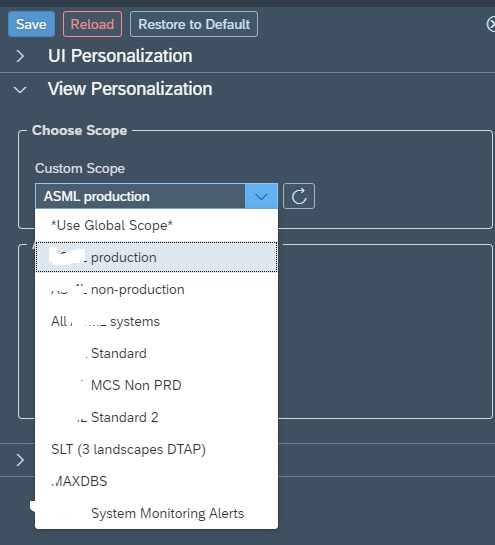
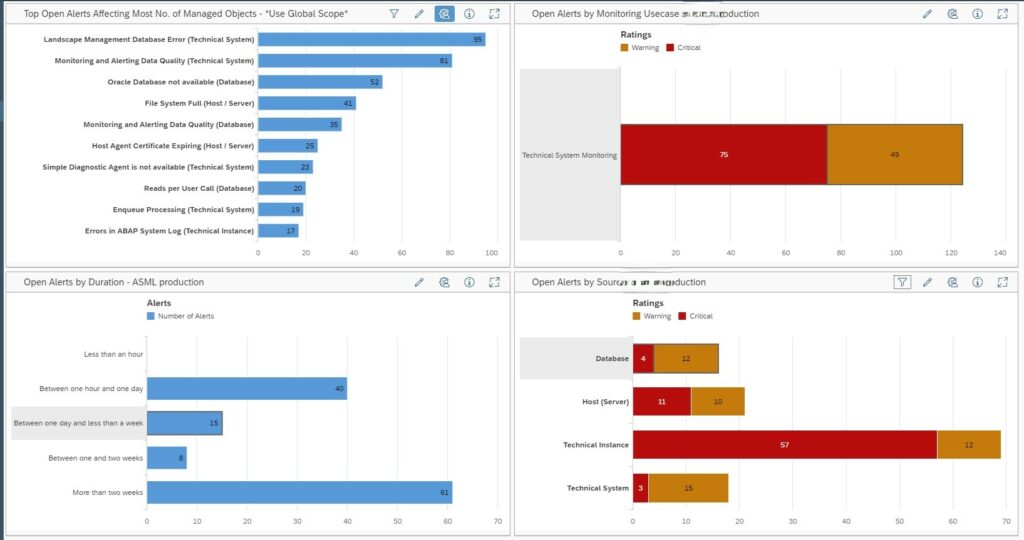
By default all the dashboards in your custom dashboard will use the Global Scope, the scope inherited from the scope you selected while opening the Alert Management App. You can also select a custom scope for your dashboard. For example in this case we want to filter for all production system alerts. For this click on the setup button of the dashboard you want to specify the scope.
Then in the setup area, in the scope selection, select your custom scope from the drop down list. Note: You must have already created your custom scope in the Scope management section.
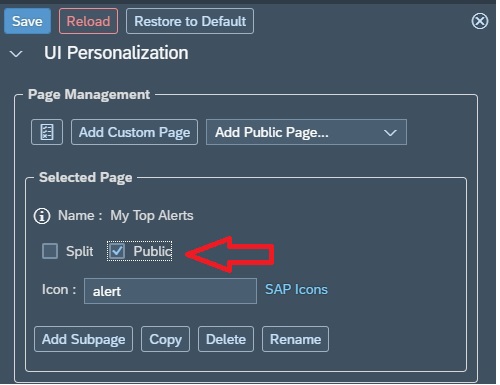
Once you have finalized your dashboard you can publish your dashboard by marking it as public so that others can also use the dashboard.
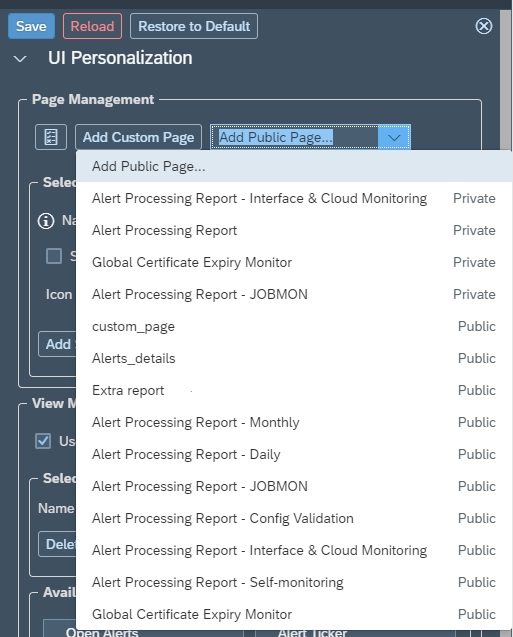
However, by default the public custom dashboard is not added in the navigation panel of all other users. To be able to view the dashboard a user has to again click on the + sign in the navigation panel, and then in setup area select the public page.
<< This blog was originally posted on SAP Focused Run Guru by Manas Tripathy (Simac). Repost done with permission. >>
