Using the Alert Management function…

The alert management function is a central alert inbox function for SAP Focused Run. All alerts from all tools are coming together in the alert inbox.

Questions that will be answered in this blog are:

  • How does the alert inbox work?
  • How can I get a good overview of all the alerts?
  • How can I mail an alert?
  • Which actions can I perform on an alert?
  • Can I set up my own alert dashboard?
  • Can I have Focused Run automatically confirm some of the alerts, when the system detects all is ok again?
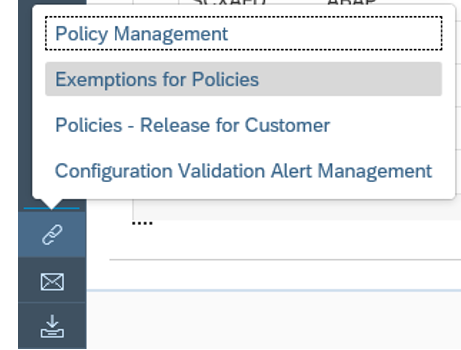
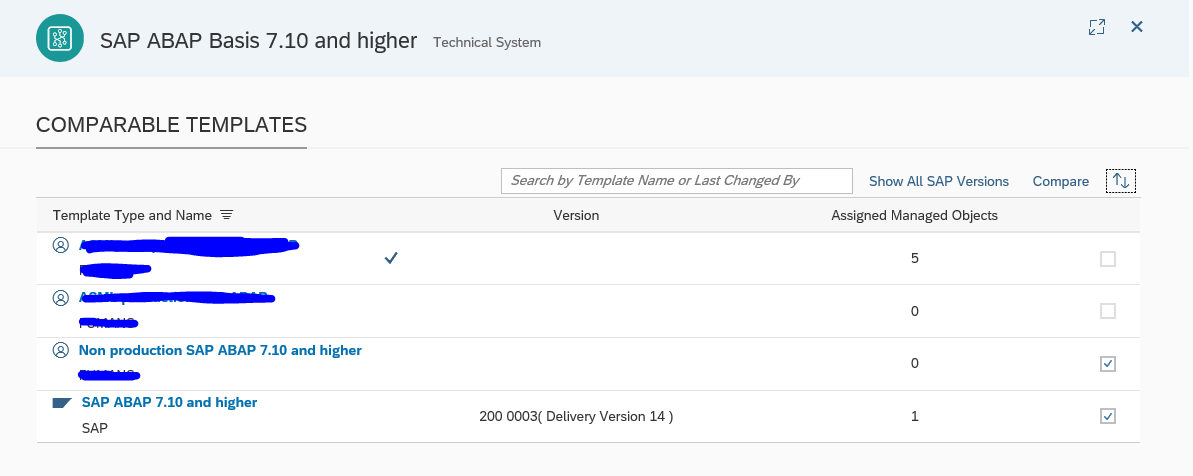
Alert inbox

To open the Alert Inbox, click on the FIORI tile:

Don't let yourself be distracted by the high number. This is the total unfiltered amount of alerts. It will contain alerts from production and non-production systems. It will be important and non-important alerts.

Now the open alert overview dashboard will open:

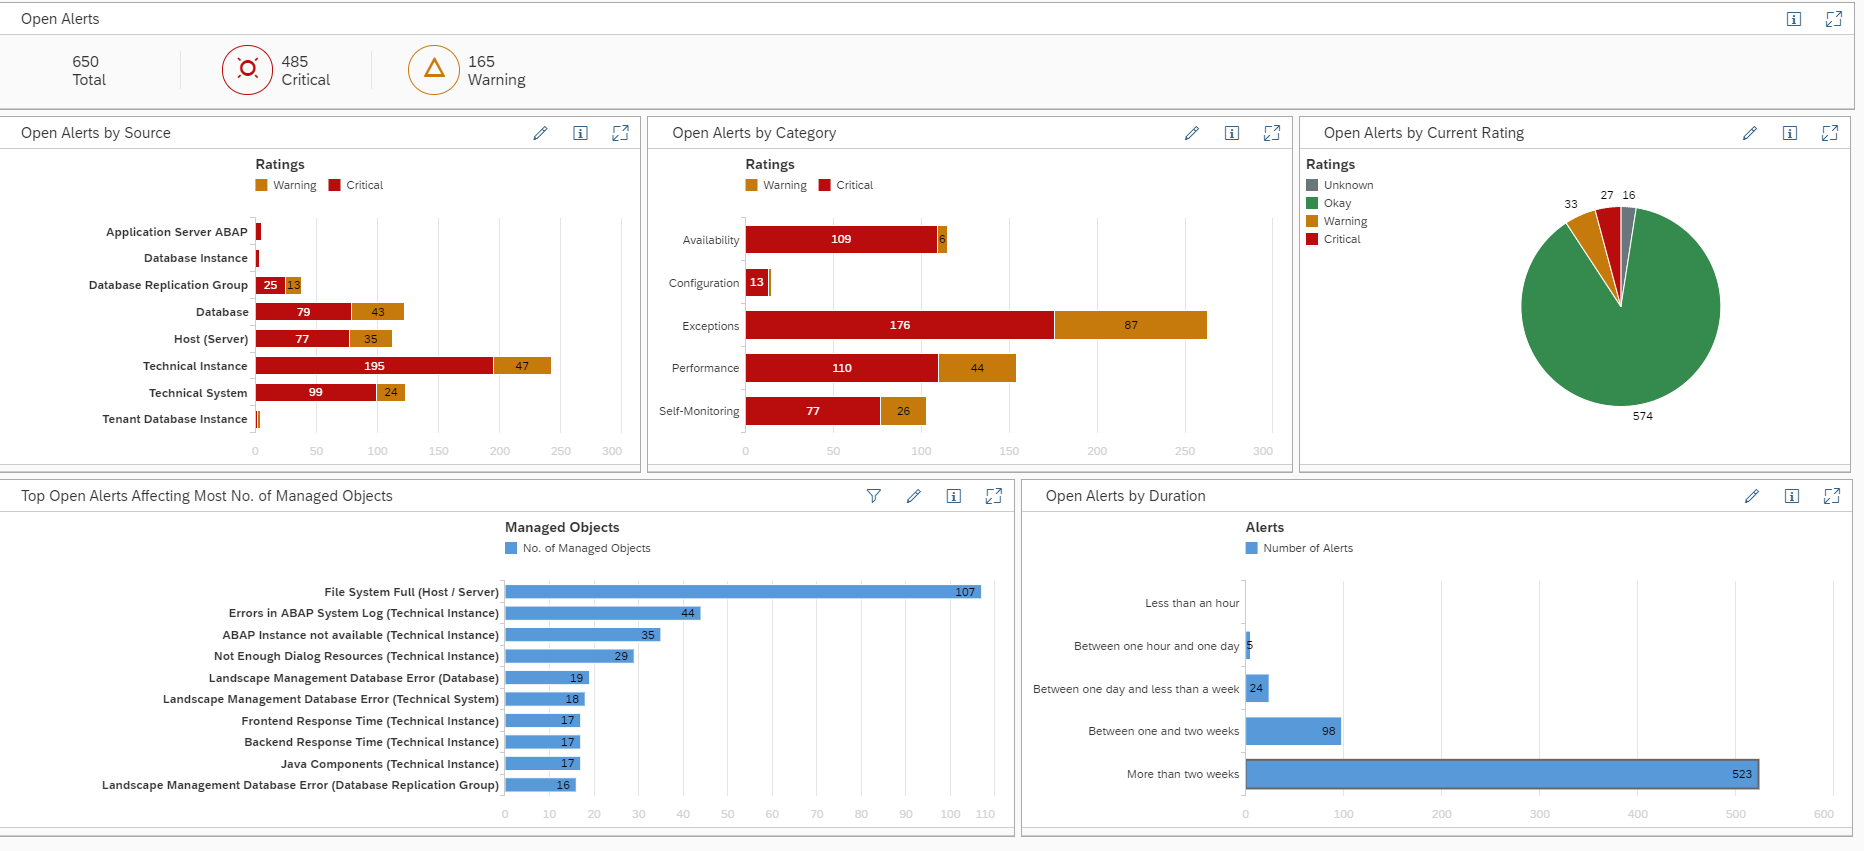
There is a lot of information on this screen.

Top left are the open alerts by source. This means the open alerts by application, instance, database. In the middle top are the open alerts by category (like availability, exceptions, etc). Top right is the open alerts by current rating. Bottom left is the top type of open alert by type of metric that is causing the alert. Bottom right is the distribution of open alerts by age.
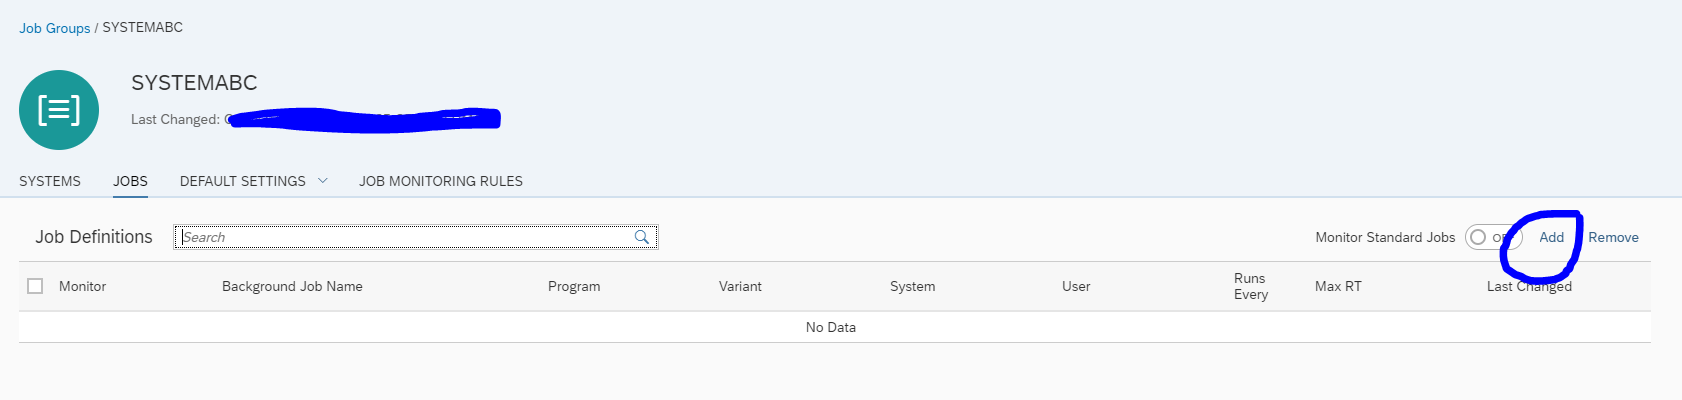
Processing an alert

From the overview you can choose two ways to start:

  1. On the top right section click on the Critical alerts that are currently still open.
  2. On the left, select the open alert list icon:

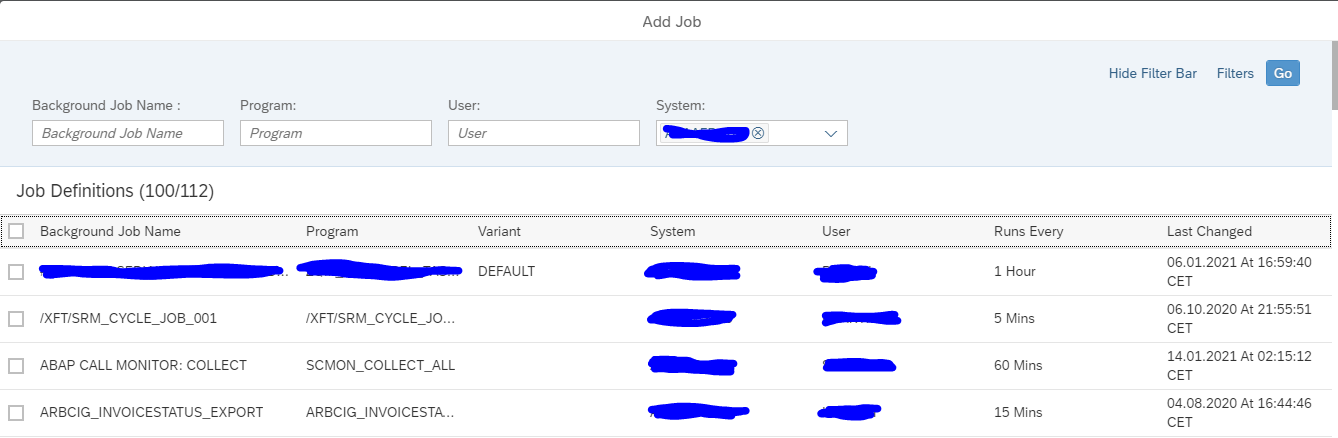
Both options will bring you to the list of open important alerts:

The sorting is done from Very High and then High, etc, already. The most important open current alerts are on top. This list can also be exported to Excel.

Clicking on an alert will open the details:

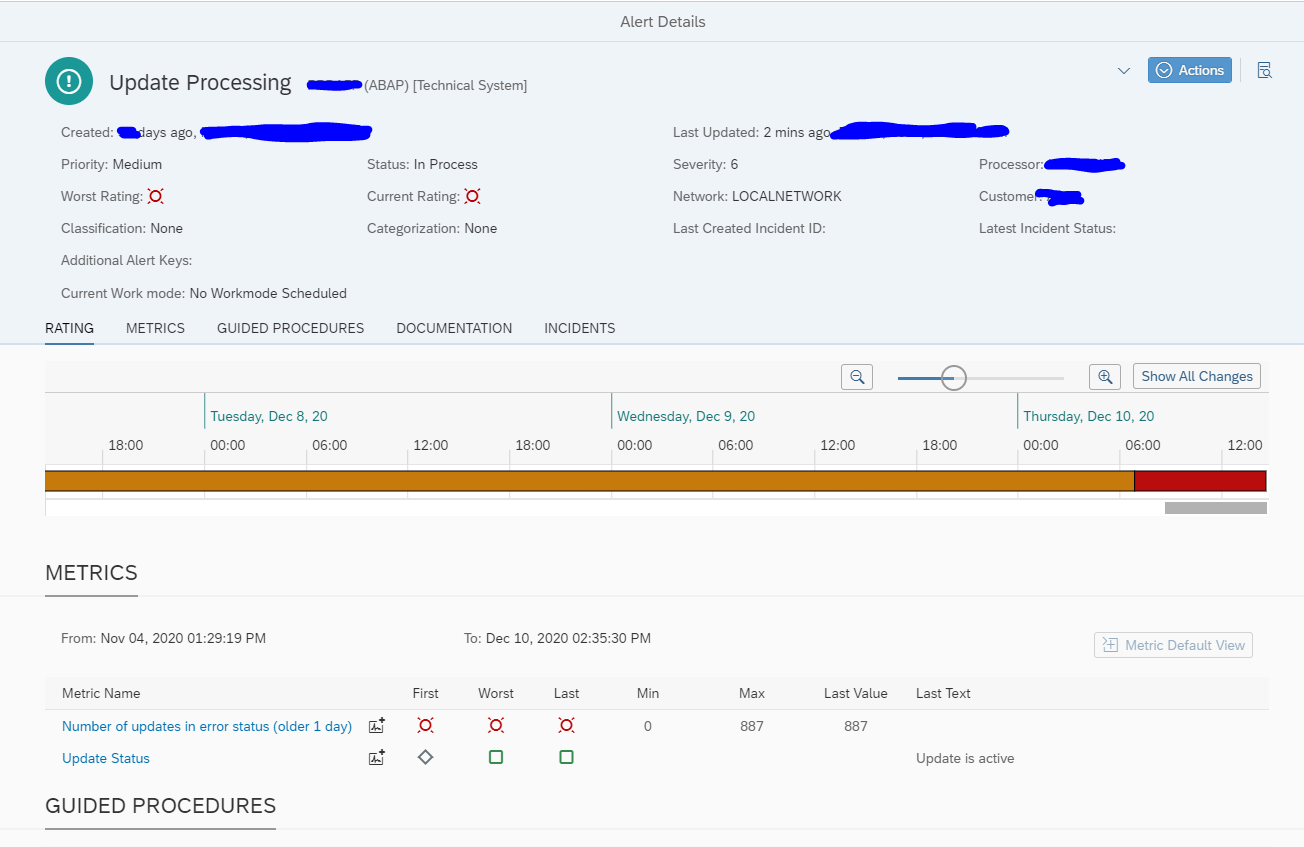
Here you can see the history and current status. It can be that the alert is till red, but it can also be that Focused Run detects that the current situation is now ok. It will still leave the alert open for you to analyse and confirm.

You can click on the Actions button to get the follow up action menu:

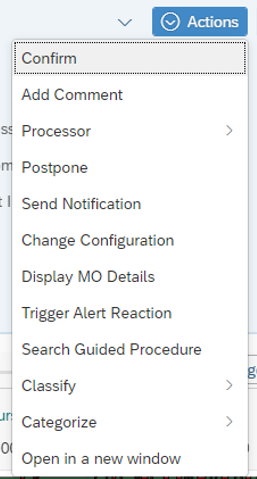
  • Confirm the alert will close the alert.
  • Add a comment: add text to the alert.
  • Add or change a processor: assign a user ID who should pick up the alert and is responsible for the alert.
  • Trigger an alert reaction (for example to SAP solution manager IT service desk or outbound integration to for example ServiceNow)
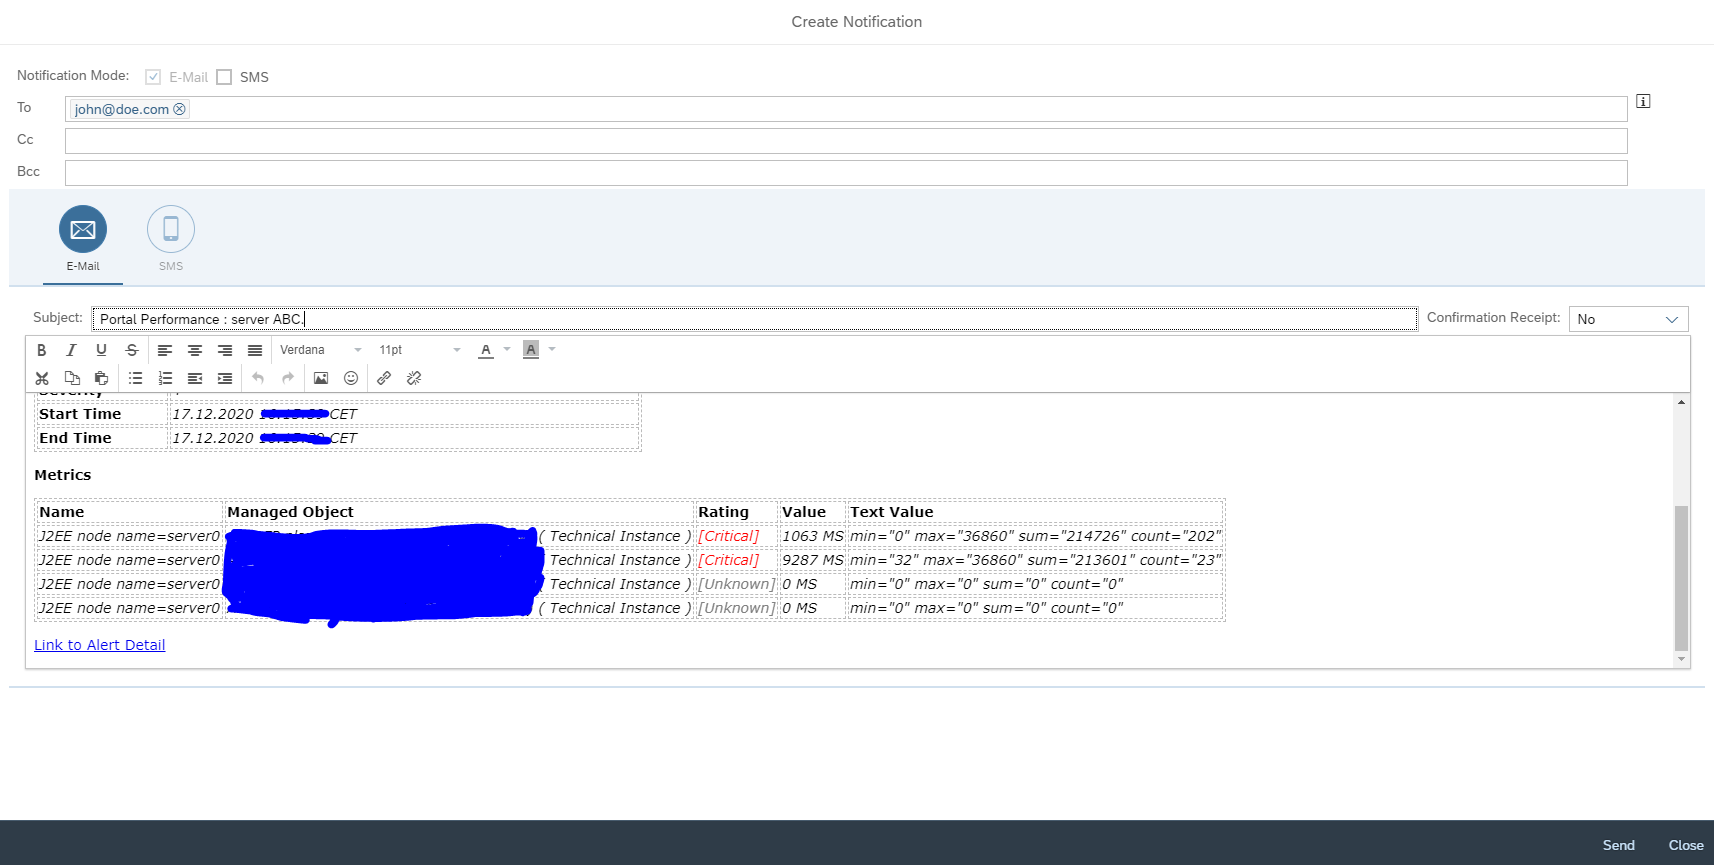
  • Send notification will give you the option to mail the alert:

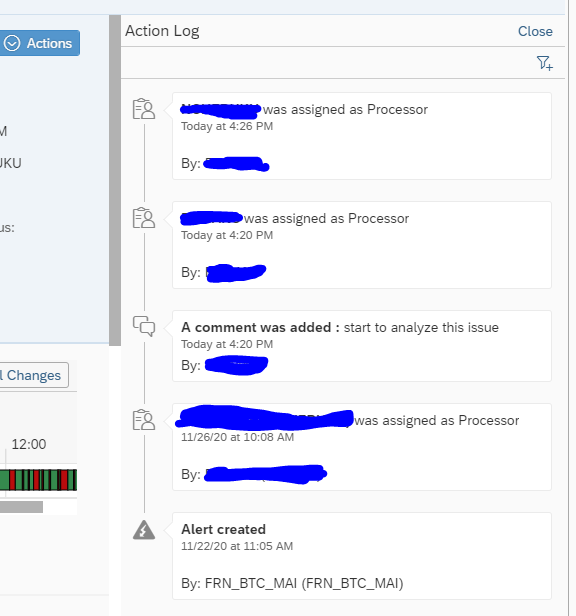
Using the action log button:

you can see the action log for the alert:

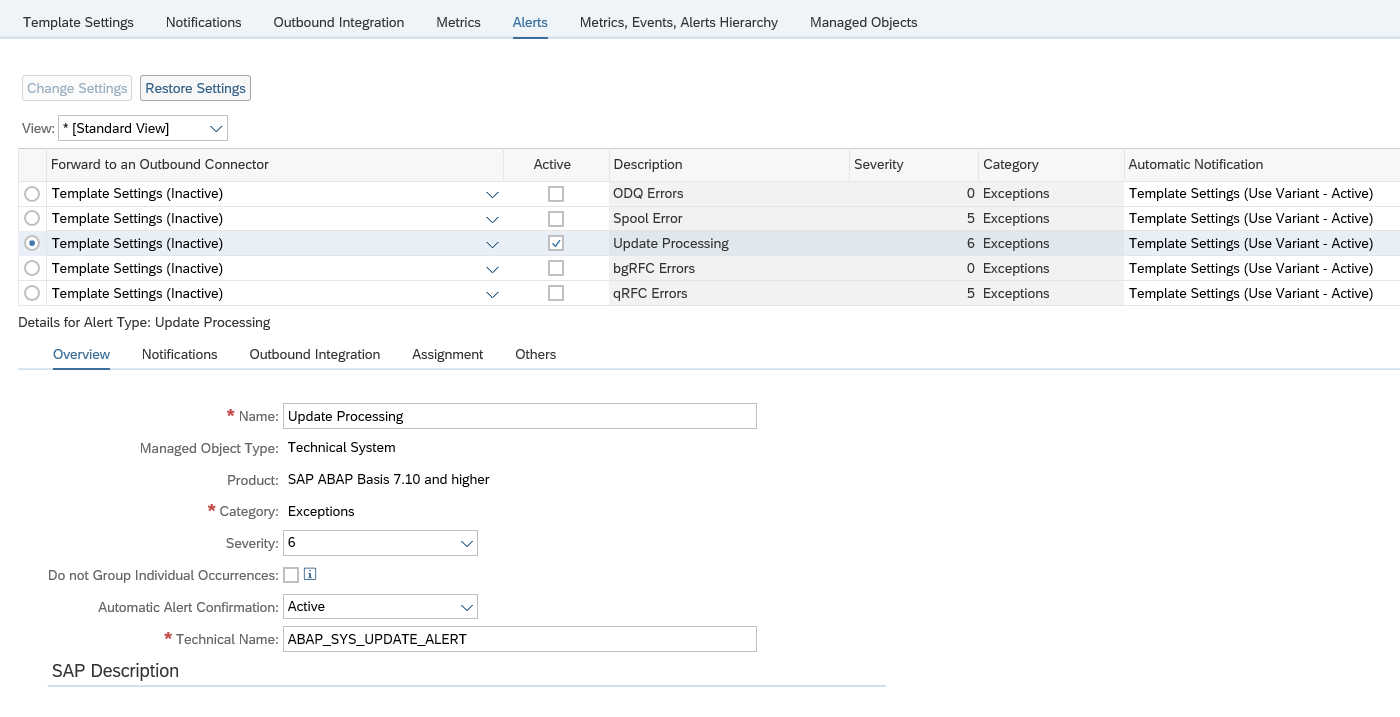
Automatic confirmation of alerts

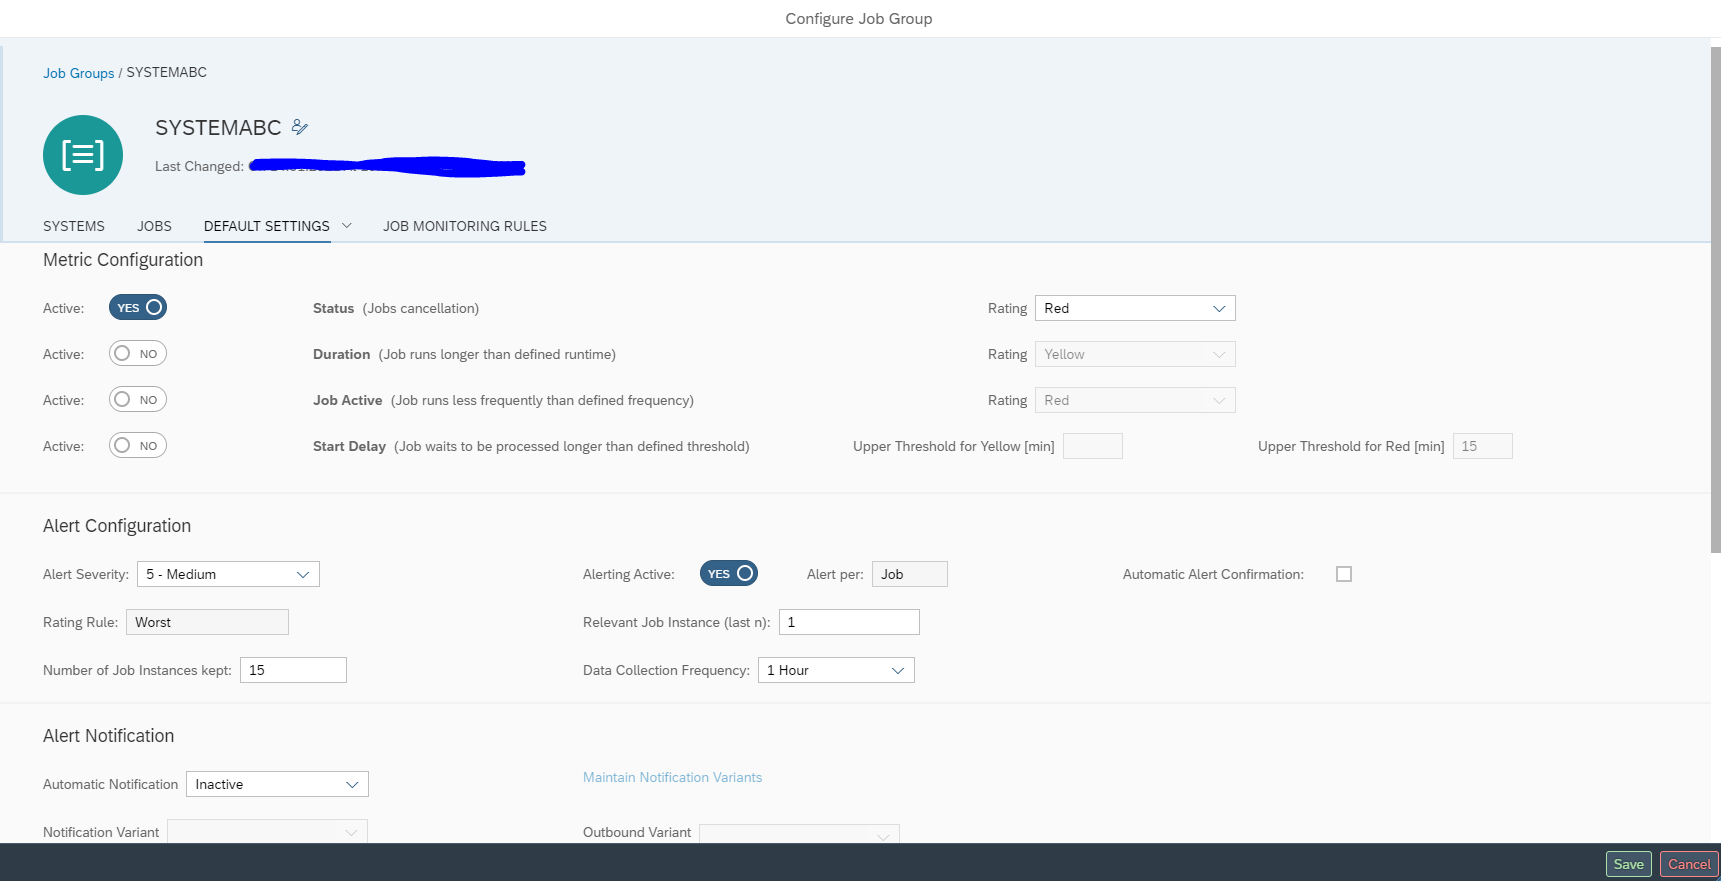
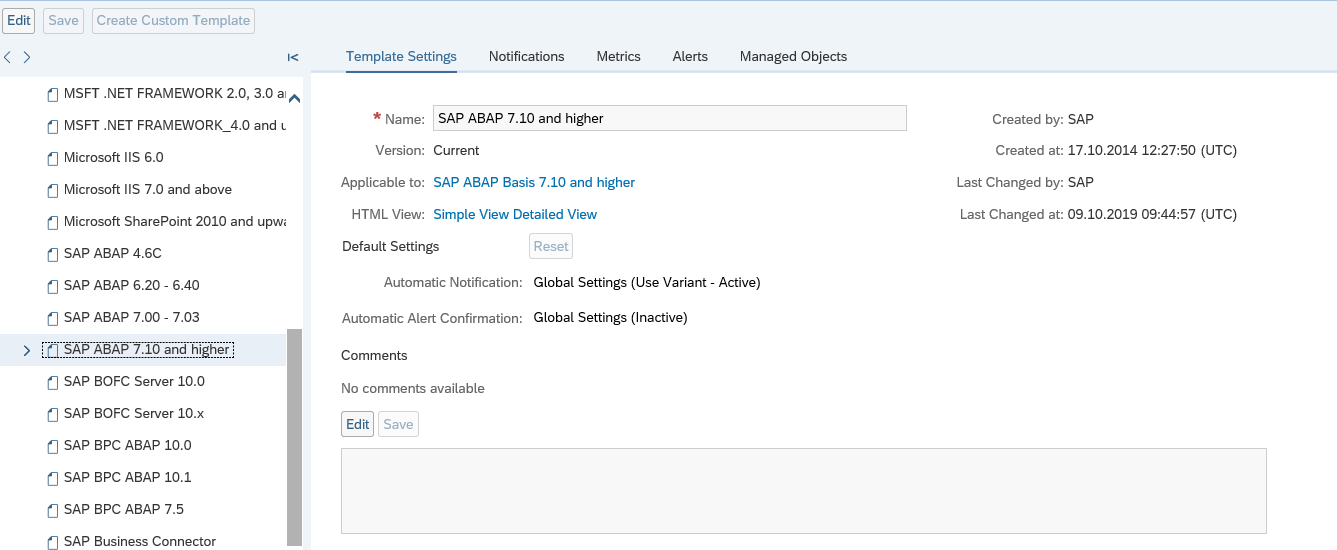
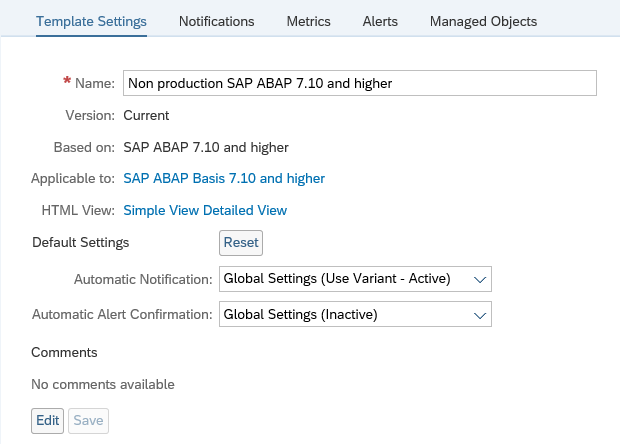
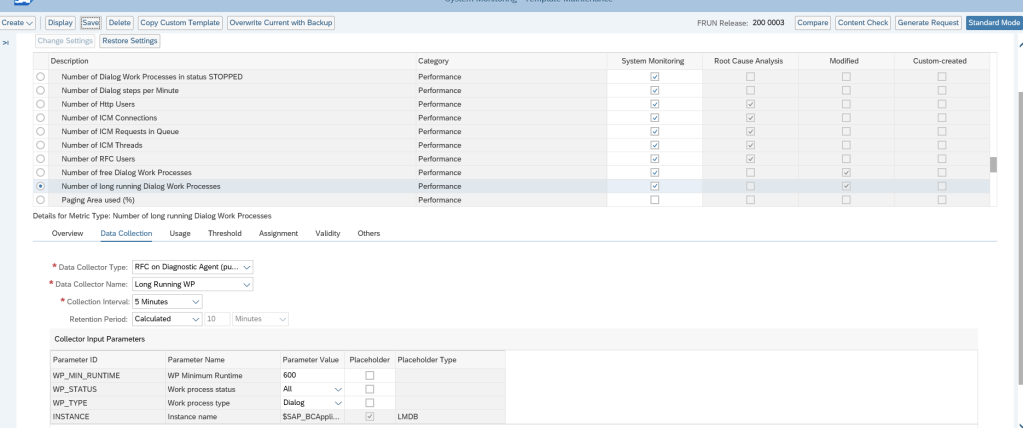
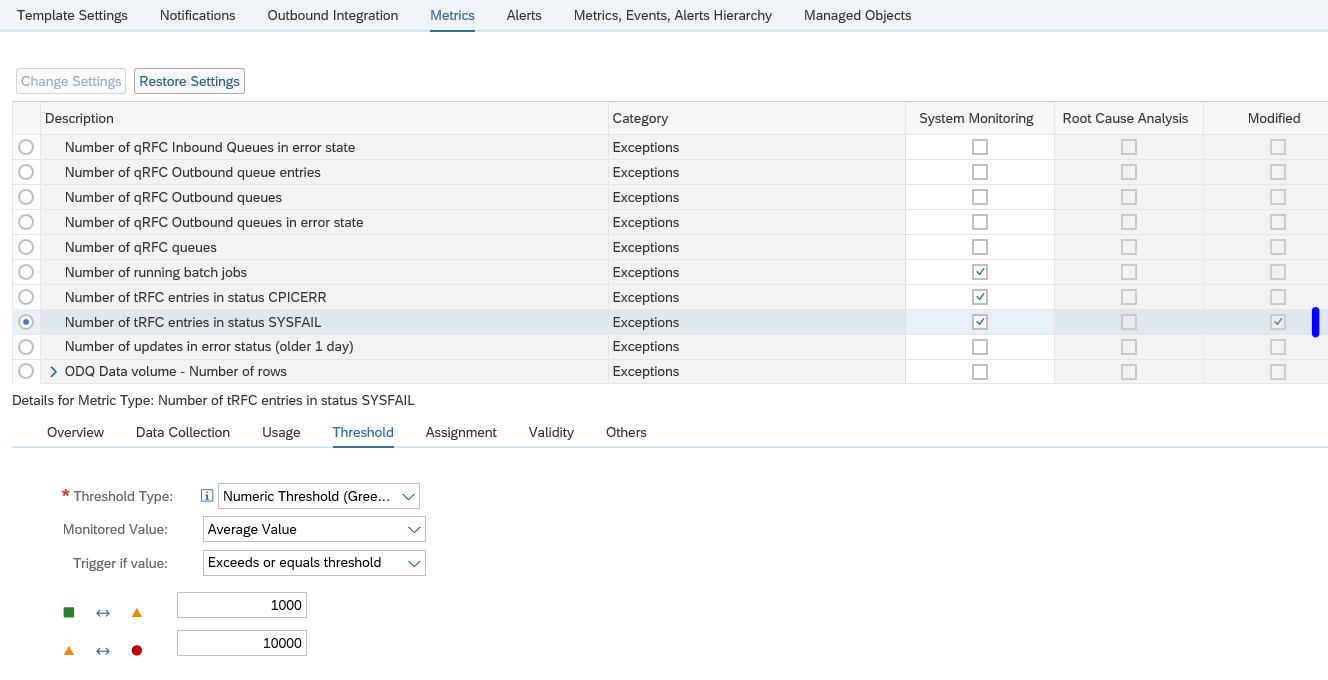
For some type of alerts, you might want to activate the automatic confirmation. This automatic confirmation is set at template level. Read this blog on the details. If it is set, the alert will still be created. The alert will remain open until the system detects the issue is gone. If gone, the system will automatically close the alert.

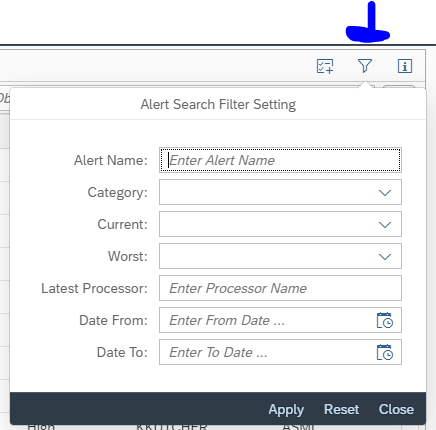
Alert management search

With the looking glass left you goto the Alert search overview. Here you can search in any way you want on the alerts, including free text search:

Top right you select extra specific filter criteria:

Alert reporting

In the left you can select the option Alert Reporting where the default alert report will open:

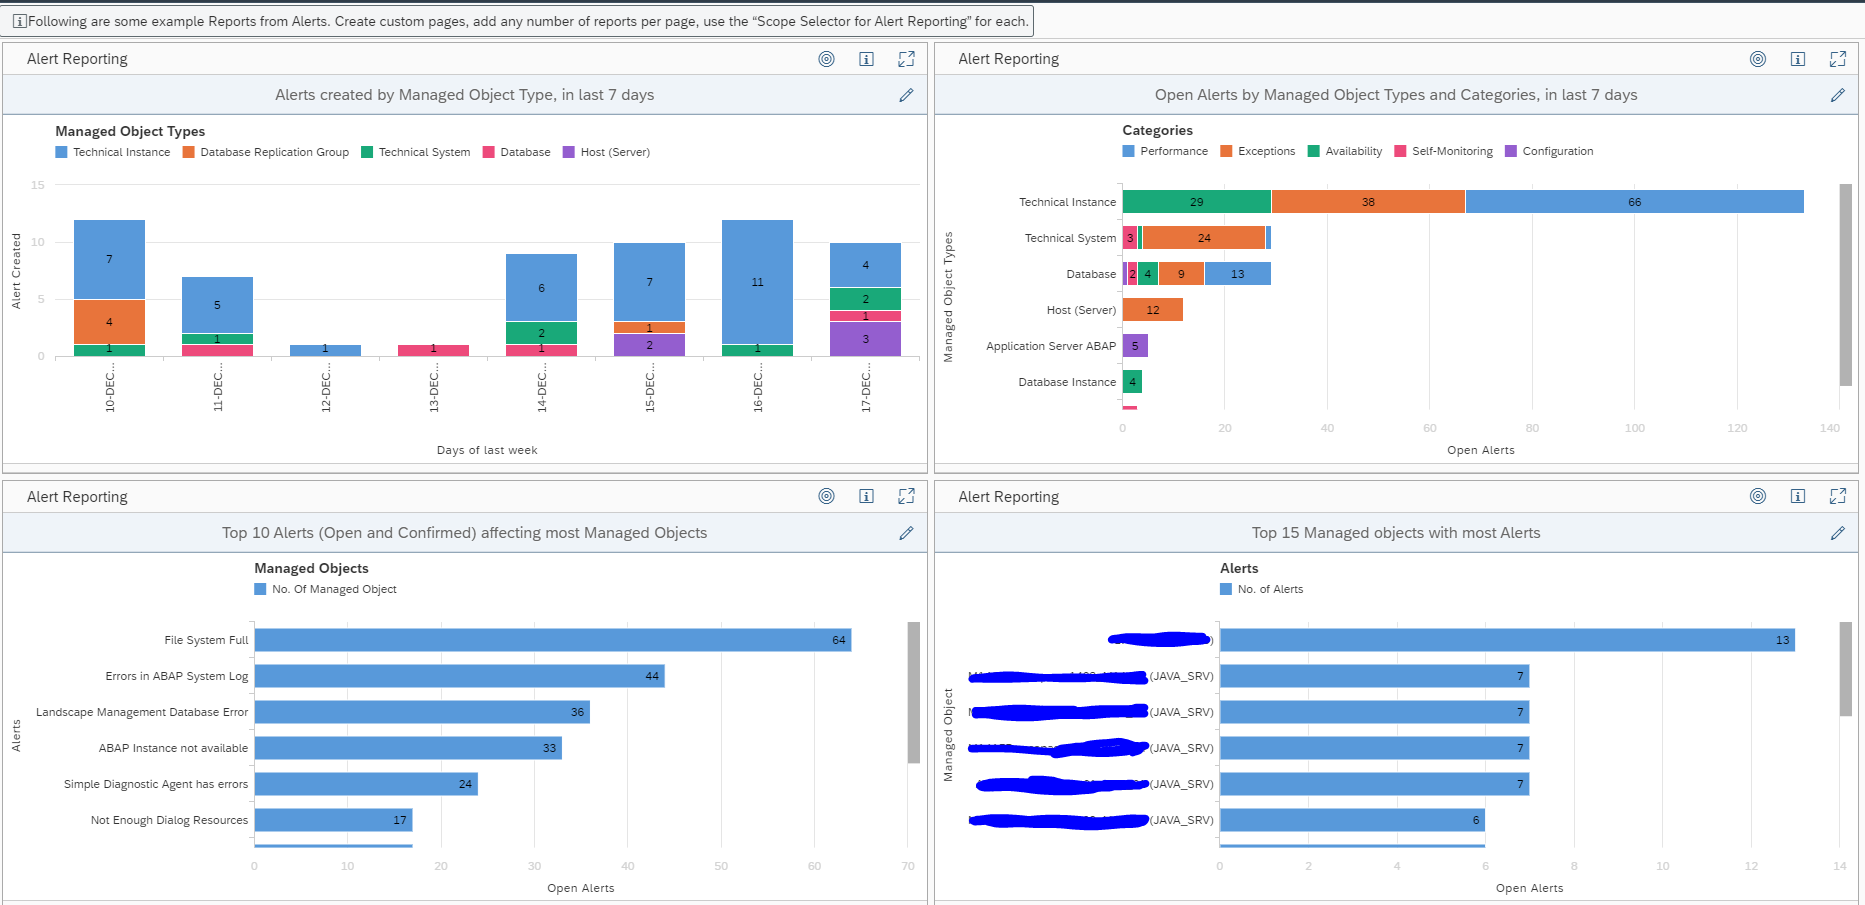
Clicking on any colored bar will bring you to the detailed list. From the list you can filter down to the details.
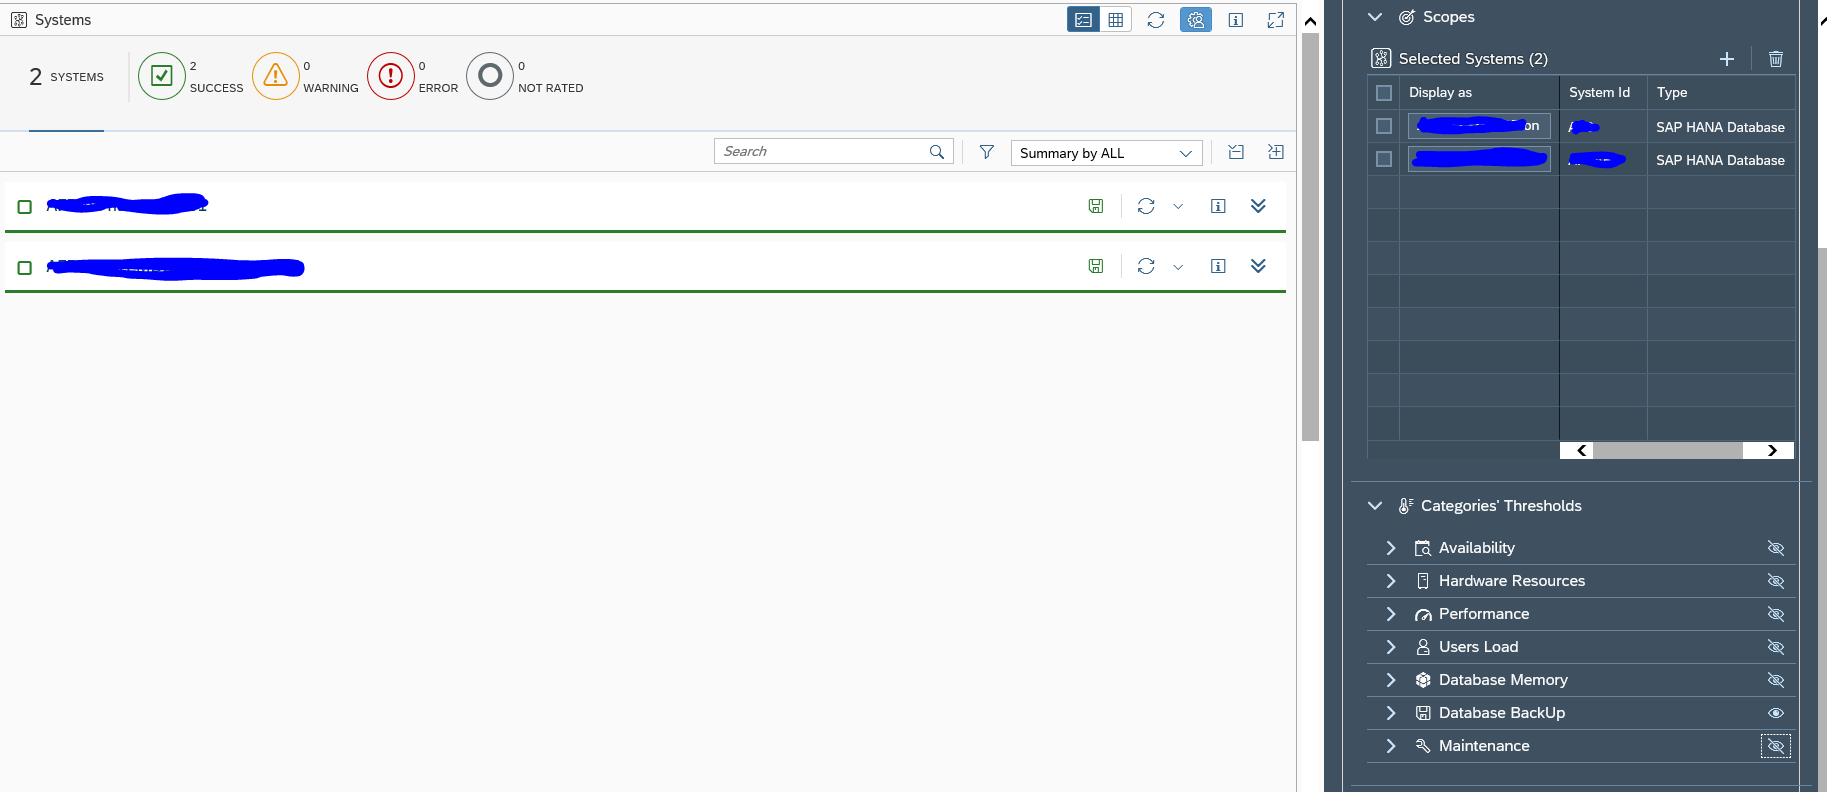
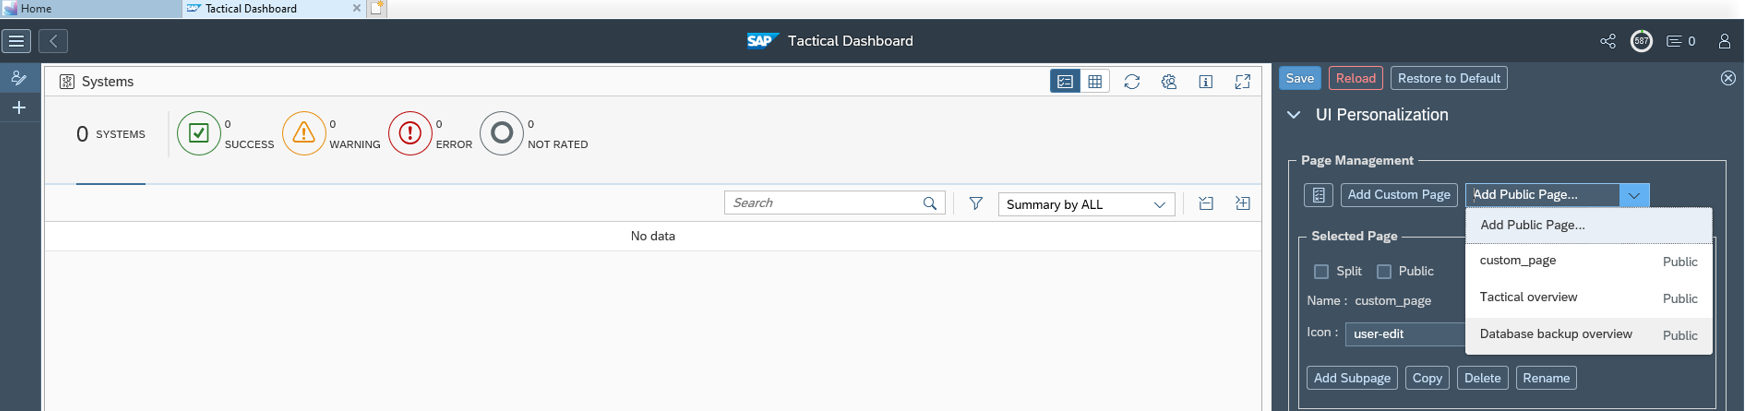
Custom alert page

By clicking on the + icon on the left button bar, you can add your own alert page:

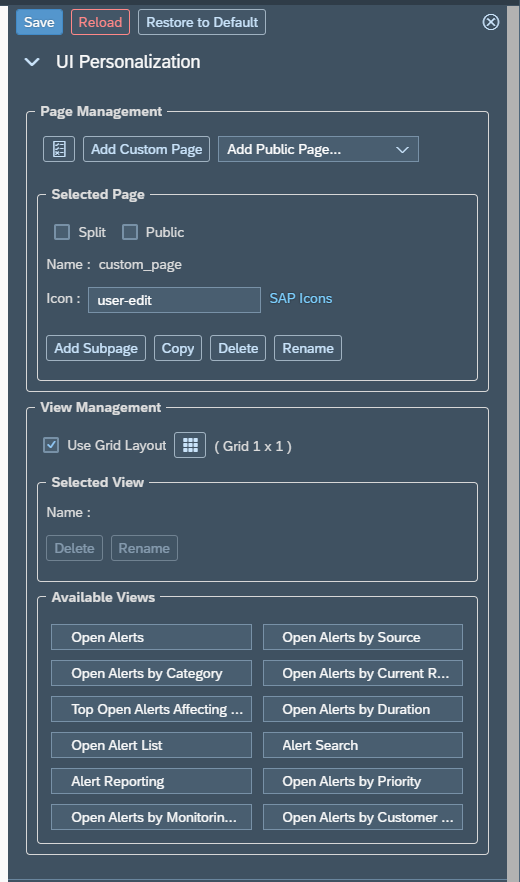
The UI is the same as for the tactical dashboards. Read more in that blog on how to configure the dashboard.

Batch job monitoring setup Focused Run 3.0…

This blog will explain how to setup batch job monitoring in SAP Focused Run 3.0. If you are using SAP Focused Run 4.0: read this blog on batch job monitoring setup in Focused Run 4.0.

The usage of batch job monitoring is explained in the overview blog for batch job monitoring.

Questions that will be answered are:

  • How to setup batch job monitoring?
  • Can I monitor batch job start delay?
  • Can I monitor batch job duration?
  • Can I monitor if specific error messages occurred in the job log?
  • Can I alert on batch jobs?
  • Can I notify on batch jobs errors by sending mails?

Batch job monitoring setup

To setup batch job monitoring start the Batch job monitoring FIORI tile:

On the top right now open the configuration screen by clicking on the wheel icon:

The batch job groups now open. Select the pencil icon to change:

In the next screen press the New button to add a new Job group:

A batch job group can be set up in many ways:
1. You define one group for each system.
2. You define a group per functionality that crosses multiple systems.
3. Combination of the above. For example all technical jobs are clustered.
Think twice carefully on this setup before you start to implement. Changing between the concepts can be costing a lot of work.

Give the new group a name:

Give the new job group a good description and add the systems:

Save the definition.

First goto the third tab to make the default job settings:

The default job settings will be applied to any job added to the group. You can still fine tune per job later on. It is best to start with job status monitoring first. And only switch on the more advanced options later on for specific jobs only.

Save your settings again.

Now go to the jobs tab and press the add button to add new jobs:

In the selection screen that pops up now, it is very important to first select the system you want to read the jobs from, and then press go:

Focused run will now read the jobs from the remote system. In the list, select the jobs you want to monitor. You can select them mass as well. Then press ok.

Save your work.

The selected jobs are actively monitored now.

The jobs need to run first before they are visible in the batch job monitoring overview screen. Especially for the weekly and monthly running jobs.

Fine tuning the job monitoring: job errors

Fine tuning of the job monitoring can be done on the monitoring rules tab. First select the job to fine tune:

Now you can start to make deviations from the default.

In the example above the job duration monitoring was activated. Note here that you should set 2 thresholds: 1 for yellow and 1 for red.

The third option is job activity: this you switch on for jobs you need to have running at a certain frequently.

The fourth option is the job delay: some job really must be started in time without delay. Indicate here after which time an alert should be generated if the job does not start in time.

The last option is to check the job log messages. Here you can check for messages in the job log. Usage example: a job might have finished technically correct, so the job cancellation is not triggered. But inside the job log a functional error might occur. This error code you can pickup here and trigger an alert in the job monitoring.

Fine tuning the job monitoring: alerting

In the second block you can fine tune the alerting per job:

You can choose here to automatically confirm the alert if the system detects that the next batch job run went ok.

The other important fine tuning possible here is decide how many job failures in a sequence are needed before the alert is raised. For example, you have a job that runs every 10 minutes, but on average fails twice per day and is normally corrected the next run. In this case you can set the Relevant job instance counter to 2. This way 2 failed jobs in a row will alert. If it is recovered after a single wrong run there is no alert generated (here you must also fine tune the data collection frequency).

In the alert notification section you can assign an alert notification variant (this holds the mail template and receivers). In the default setup, you normally set the notification towards the basis team. But for some job(s) you might also want to notify a functional or business team.

Reference

The full setup guide for batch job monitoring can be downloaded from the SAP Focused Run expert portal via this link.

System down monitor…

A special function is System Monitoring is the System Down Monitor. This overview directly gives an overview of the systems that are considered down by SAP Focused Run and the systems which are set to having maintenance.

Questions that will be answered in this blog are:

  • How can I quickly get an overview of all my systems that are down?

System down monitoring

In the system monitoring screen select the System Down monitoring icon on the left icon bar (here indicated with the arrow):

You can see systems that are down and which ones that are having planned maintenance. If you have set up the SLA management, it will also show that aspect.

If you want to zoom in on the issues, press the i icon right of the system. Then select Links to go to the respective tool for further investigation:

For systems down the best tools are usually the System Analysis and the Alert Event management.

Changing settings

You can change the layout settings with the glasses icon:

You can show/hide the SLA and charts section as per your need.

Definition of down

The definition of down is in Focused Run: any red alert in the availability metrics. This can be:

  • Complete system down
  • One of the application servers is down
  • Core function is down (for example ABAP stack is up and running, but the Https is not available)
  • Important subfunctions are not working (for example in the SLT system 1 or more source systems can not be reached)

Tactical dashboard…

The tactical dashboard is a nice dashboard to check you system status across multiple systems. Items that are part of the tactical dashboard is database backup status, performance, logged on users, software maintenance status.

Questions that will be answered in this blog are:

  • How to use the Focused Run tactical dashboards?
  • How to fine tune the tactical dashboards?
  • How to setup your own tactical dashboard?

Tactical dashboards usage

To start the tactical dashboard, click the corresponding FIORI tile:

You now reach the tactical dashboard overview screen:

By clicking the Expand Group icon at the right you get first level of details:

By clicking the tile you are interested in you get the details.

Examples are hardware resources for current week and last month:

Dialog response times:

Amount of logged on users:

And software maintenance status:

More on the age of software components can be found in this detailed blog.

Configuration of dashboard

By clicking the personalization button top right:

you will reach the configuration screen. Here you can add and delete systems from the overview:

And you can set the view properties and thresholds for each of the categories:

This fine-tuning you do as per your companies needs. By clicking on the Visibility symbol, you can hide an aspect from your overview. Like above the Database backup was put to invisible.

Creating your own tactical dashboard

You can create your own tactical dashboard for your own specific needs. We will take the example here to make a dedicated dashboard for the backups. Since we want to check daily in the overview if the backups were successful.

Start by clicking top left on the big + symbol to add a new dashboard:

The personalization view screen will open:

Important here are a few things. Set the tick box Public if you want to share this dashboard. Find the keyword for the right SAP icon (use the SAP icons link and read this blog). Rename the dashboard by clicking the Rename button.

Now Save the page. Close the personalization. You are now in the empty screen. Open peronalization again to add the system(s):

Also hide the not needed views. On the left hand side you can immediately see the result updating.

Hint: start with one or two systems only when making a new dashboard. First fine tune what you want to see. When all is ok, add the systems later. If you have a lot of systems, the updating of the left hand screen will be slowing you down.

Don’t forget to save off course.

Using a dashboard created by a different user

If you want to use a dashboard created by a different user, go to the personalization option and select the add page option:

Now you can select any created dashboard, which has been set to public.

If you don’t see the correct dashboard, check with the owner that he made it public.

Create custom metric for system monitoring…

In some cases you want to have your own metric defined to fine tuning the system monitoring template.

Questions that will be answered in this blog are:

  • How do I create a custom monitoring metric?
  • Do I need to re-create the custom metric per monitoring template?
  • What are examples of custom metrics?

Creating custom metric

In this example we create a custom metric to make sure that the user WF-BATCH is not locked.

There is already a metric in the ABAP template that is called User Lock Status. This can be used as a basis for our custom metric.

Goto your template into change mode and on top left choose Create (you need to be in Expert mode first):

And select Metric. Now the screen opens for a new metric creation:

Fill out the details, and create a custom description:

Now go to the tab Data Collection:

Copy the data from your reference metric here. Don’t forget to fill out the Parameter Value. In this case WF-BATCH. Also make sure you have a reasonable Collection Interval timing. Not everything is need to be collected every 5 minutes.

Now go to the tab Threshold:

Configure your threshold setting.

Now press the Next button and assign the metric to the correct group:

Now press Finish to save the metric.

The new custom metric is now available in the monitoring template:

You see that this one has the Custom created marked. Later you can use the filter on Custom created column to quickly find it again.

Deploying custom metric to other templates

If you have to deploy the custom metric to other templates: so far this is a manual action. Per template you have to re-create the same custom metric. I have not found a nice way of re-using custom metrics yet.

Examples of custom metrics

Examples of custom metrics:

LMDB: set IT admin role…

This blog will explain how you can set the IT admin role in the LMDB (Landscape Management Database).

Questions that will be answered in this blog are:

  • How to set the IT admin role in LMDB?
  • Why is it important to set the correct role?

Setting the IT admin role in LMDB

Goto the LMDB Object Maintenance FIORI tile:

Search for your system:

Select the system and press Display to open the detail screen:

Press Edit to change. Now change the IT Admin Role and press Save.

Why is this important?

The IT admin role is important for the scope selection. When you have set the IT admin roles properly it is easy to filter the scope to for example productive systems only. More details on the blog on System monitoring tips & tricks.

Security baseline validation…

With the help of Security and Configuration validation you can quickly get an overview of the security compliance of your systems.

Questions that will be answered in the blog are:

  • How to convert your security baseline into a SAP Focused Run Policy XML file?
  • Does SAP provide best practices for security baseline?
  • How can I run a check against many systems?
  • How can I see which security parameters are ok and which ones are not ok in one overview?
  • Can I apply a temporary exemption to the policy?
  • Can I be alerted if a security parameter is changed from compliant to non-compliant value?
  • How many security policies should I create?

SAP Security baseline

SAP publishes a generic SAP security baseline template. For more information on this template, read this blog.

On the SAP github for Focused Run, SAP has put the XML policy files that correspond to this security baseline:

The formally published version of the SAP security baseline is version 2.1. The published github files are only updated until version 1.9.

Company security baseline

The SAP security baseline can be used as a quick start. But it still needs to be tailored to your company:

  • Values might need to be altered (example; length of password)
  • Values might not be relevant for you (this normally not the case, but it could be)
  • Extra checks that are not in the SAP baseline need to be added

Exemptions

We will explain later below in the blog how to deal with exemptions. A good example of an exemption is that you have a rule, but cannot apply it to all systems. Example is the login/disable_multi_gui_login parameter. By definition you want to set it to 1 to forbid multiple logons. But for 1 older system this is not possible and you have agreed with security team on an exemption. In this case, you don’t want to have a new policy. You keep the single policy but apply the exemption.

Creating the policy file(s)

With the help of the examples in the SAP security baseline, you can build your own company security baseline policy XML file.

In this file I have made an example which contains a lot of password and logon parameter related checks for the ABAP stack:

Goto the Policy Management FIORI tile:

Create a new policy and give it a meaningful name and description:

Now press the edit button and copy and paste the content:

Now Save the policy, Check and Generate. Now you are ready to run.

You can modify the existing values in the XML sample to your need. After it is changed, Save, Check and Generate again.

Running the baseline policy

Start the Configuration and Security Analytics tile:

Select the Policy, and let the system run to get the results:

By clicking on the tab Checks you can zoom in on which items are not ok:

By clicking on a specific check you get the details for that check, which systems are not ok, and what the current value is in the system:

In this case the value 0 for special character is not ok. It should have been 1.

The tab System/Checks gives you an overview of all systems and all checks in one shot (you do need to expand the columns to more values):

Applying an exemption

Ideally you want to solve all the issue by changing the security parameters to meet the security baseline. This is not always possible. After agreement with your security team an exemption can be applied.

When you have done the security baseline run, click on the bottom left the Links icon and select Exemptions for Policies:

In the next screen press the create button to create an exemption:

Select the policy and the specific check you want to exempt (in our case we use the logon password compatibility as example) and set a due date or date range for which the exemption is valid. By setting the due date, it is valid for all systems.

With a date range, you can make the exemption applicable for selected system(s):

Remark: this one is using date range!

Now you can run the security policy again:

You can see in the text exemption have been applied. Also the tick box for Apply Exemptions has appeared. You can untick the box to run the policy without the exemptions.

Alerting on non-compliant changes

Once you have everything under control and all green (meaning all systems are compliant to baseline, or exemptions are applied), you can set up alerting to inform you that a security parameter was changed into a non-compliant value.

When running the check, go to Links on bottom left of the screen and select the Configuration Validation Alert Management option:

In the next screen now create a new alert:

Important here: carefully set the frequency. Do select the System Scope. If you want to check ABAP systems for production only, do set this into the scope section. And Set it to Active. And Save.

Every day the check will run and you will get an alert upon detecting a new non-compliant item for this policy.

More information on using the alert management function can be read in this blog.

How much policies should I create?

You can have as much policies as you like.

As a best practice, create one big one for your companies security baseline per system type:

  • All ABAP security parameters
  • All JAVA security parameters
  • All HANA security parameters

The initial setup might be quite some work, but once setup and cleaned up, the system will do all the work for you, and you need to check the alerts only.

For special cases you can create dedicated policies:

For ABAP OSS notes you can also create policy files. See this dedicated blog.

Mailing the results

Please read this dedicated blog on how to mail the results of a configuration baseline run on periodic basis.

Security notes validation…

In the previous blog we have explained to run a validation of ABAP security notes against your systems using Focused Run configuration and security validation.

Questions that will be answered in this blog are:

  • How can I quickly run an entire year of security OSS notes versus my systems?

SAP github with security policy source files

SAP publishes files for the ABAP security notes each month on the SAP Focused Run Best Practices GitHub:

Here the policy files for the ABAP security notes are stored per year and per month.

Not all security notes for ABAP stack are in these files: only the ABAP notes which can be applied via SNOTE. Security notes for ABAP stacks which require parameter changes or patches are not part of this check!

For convenience I have collected the files per year.

These files are for convenience. It can be I made a mistake in assembling them.

Uploading the files

Goto the Configuration validation policy maintenance FIORI tile:

Create new policy and copy paste the text from the file:

Do this by choosing Edit and copy and paste the text in the editing section:

Now Save the policy. Check the XML. Generate the policy and check it by pressing Test Policy. Note that these are large files with many checks, so the testing can take some time. Run can be done via the Validate button or by following the instructions below.

Running the Security notes checks against the connected systems

To run the checks, goto the Configuration and Security Analytics FIORI tile:

Select the policy file to run:

Now be patient until the results are ready.

Make sure you expand the amount of columns.

If an ABAP notes is not applied it does not mean your system is not safe. You have define for which CVSS score and which systems you want to apply the security OSS notes, within which timeframe.

More on CVSS score see OSS note 2463332 – Security Note CVSS vector computation – SAP Solution Manager 7.1 and 7.2 and this SAP blog explaining the CVSS scoring in general.

Configuration and security monitoring overview…

This blog will give an overview of the Configuration and Security monitoring function of SAP Focused Run.

Questions that will be answered in this blog are:

  • How does the Configuration and Security monitoring function of SAP Focused Run work?
  • How can I quickly check my security baseline against all my systems?
  • How can I quickly check the status of application of the security OSS notes?

Configuration and security monitoring goal

The goal of configuration monitoring is to compare system settings for security versus the baseline defined in Focused Run. Deviations from the baseline can be reported.

The security validation can be used for:

  • Validation of ABAP security parameters
  • Validation of JAVA security parameters
  • Validation of HANA security parameters
  • Security OSS notes
  • Diverse topics like client opening and SAP_ALL assignments

The technical explanation is perfectly explained on the SAP Focused Run expert portal.

Configuration and security monitoring policy

To view the policies for configuration monitoring click on the FIORI tile for Policy Management:

You now reach the policy maintenance overview screen:

By selecting a policy, you can display the XML definition of the policy:

In a later blog we will explain fine tuning these XML definitions.

Running a policy

With the FIORI tile Configuration monitoring analytics you can run the policy against your systems:

After opening the tile you have to set the scope of systems. Then you reach the initial screen:

Now use the Select button to select the policy you want to run. The system will run the policy against the systems selected in the scope and show you the results:

This is the overview across the systems. By clicking on a row you can zoom into that specific system:

Security baseline validation

The example above is a simple single check. You can define your own XML with your security baseline settings. The running is identical as the example above.

What you can do now as well is go to the Checks tab to see which item has the most compliance issues across all the systems:

By clicking the Systems/Checks tab you can list out all items across all systems:

Remark: the default only shows 4 columns. You have to switch to multiple columns.

For the details on the setup of the configuration baseline, read this dedicated blog.

Read this blog on how to set up mail notification of the configuration baseline result.

Security OSS notes

On the SAP github XML files can be downloaded for security note validation. You upload the XML as a policy in the Policy Administration. You now can run this policy against your systems to follow up on the status of the security OSS notes:

The XML file delivered by SAP checks the base version of the ABAP stack. So not all notes are relevant for all releases. If a note is not relevant the items is blank. If it is green, the note has been applied. If it is red, the note is not applied.

For more information about the setup and running of this function, read this dedicated blog.

SAP solution manager has a similar function called System Recommendations. The setup is more complex and follow up is far more cumbersome than with Focused Run. The only advantage of SAP solution manager System Recommendations is that the security notes content gets updated automatically. With SAP Focused Run you will need to monthly download the latest XML file on the security patch day.

Monitoring based on configuration

The configuration and validation rules can also be used to trigger monitoring. Read this blog for the example of using configuration validation to trigger monitoring events for to-be expired ABAP PSE certificates.

OSS note 3197989 – How to use Configuration and Security Analytics in System Monitoring Alerting – SAP Focused RUN contains a PDF document explaining in detail the steps to perform.

Other use cases

There are many more use cases:

Fine tuning monitoring templates…

This blog explains about fine tuning of the monitoring templates.

Questions that will be answered are:

  • How to update the SAP content for templates?
  • What is a good rule of thumb for the amount of templates to create and maintain?
  • Should I transport the templates or maintain them locally?
  • How to create your own template?
  • How to fine tune a single metric?
  • How to change the alerting settings of a metric?
  • How to assign the template to a system?
  • How to update the template of a system?

SAP content updates

As a starting point you use the SAP pre-delivered content. Also the SAP content gets updated. OSS note 2695734 – Manual Content Update for FRUNCONT200 in Focused Run 2.0 for SAP Solution Manager (FRUN-CONT) is keeping track of the updates. It also explains where to download the content files. For version 3.0 take OSS note 2991255 – Manual content update for FRUN-CONT 300 in SAP Focused Run (FRUN-CONT). And for 4.0 OSS note 3275006 – Manual content update for FRUN-CONT 400 in SAP Focused Run.

Use program RCSU_MANUAL_UPLOAD to upload the downloaded content. Then use the FIORI tile Content management to activate the new content:

And update the content or see it is already up-to-date:

Before you start fine tuning your own templates, make sure the standard SAP content is up-to-date.

Amount of templates to fine tune

In principle it is up to you to generate as much templates as needed. Initially it seems a good idea to have many different templates. The setback is that fine tuning a specific metric that is valid for all templates, you need to repeat this action. Also when you have fine tuned a template, you need to update the attached systems.

A good starting point for fine tuning is to have 2 templates to start with:

  1. Template for productive system
  2. Template for non-productive system

The template for productive system can have more metrics activated with sharper thresholds for generating alerts.

The main goal for a non-productive template can be focused on system availability only.

For productive system you want to manage all aspects of a system including performance and all content exceptions.

Local maintenance or transport

The template maintenance can be done on a productive Focused Run system directly. Or you can choose to maintain the templates on a trial/test Focused Run system, test it there, and then transport it to the productive Focused Run system. The transport is the best approach that gives the most control.

Who should fine tune a template?

This is an organisational question. If you let everybody maintain the templates and metric content of the templates, you will quickly loose control. Best to limit the amount of people to maintain the template settings. Be careful when handing out template control to a service provider. They tend to change the thresholds to very high levels, so they get less alerts. In stead of solving the alerts….

Creation of own template

Open the template maintenance FIORI tile:

Select the template you want to fine tune. In this example we will fine tune the Technical System template for ABAP 7.10 and higher:

Press the Edit button and then the button Create Custom Template:

Give the template a good name. The most descriptive text must be at the beginning.

Fine tuning the template

Case 1: include or exclude in monitoring

Goto the metrics tab:

In the system monitoring you can switch on or off metrics. Press save after each change to save your setting changes.

Case 2: fine tune data selection

In the standard SAP delivery there is an alert for Number of long running Dialog Work Processes. Goto the Expert mode (button top rights), then select the tab data collection:

Go into edit mode via the Change Settings button, and you can update the field value in parameter value for WP_MIN_RUNTIME to your needs.

This is just an example. You can fine tune a lot of metrics in this way.

Case 3: fine tune threshold and alert settings

If you want to change the thresholds, first click on the expert mode button on the top right corner. Then press the Change setting button to edit the Threshold tab settings:

In this example we changed the type from Numeric (green/red) to Numeric (green/yellow/red) and we changed the values. The modified column indicates that we have changed a metric and that the definition is different from the standard SAP one.

On the Alerts tab you can make changes to the alert settings:

You can change the following:

  • If an alert is to be generated or not (Active means, alert is generated)
  • Severity of the alert
  • If an alert will be automatically confirmed when the system detects that the issue is solved
  • If an automatic notification will be send or not (see this blog to set up mail notification)

The usage of alerts, will be explained in this blog.

The configuration of automatic notifications is explained in this blog.

In the last tab Managed Objects you can see there are no systems assigned yet to the newly created template.

Assigning custom template to a system

To assign a new custom template to a system, goto the Individual maintenance FIORI tile:

Select the system and press the button Change assignment and assign the wanted new template:

Now press the button Reconfigure to effectuate the template change.

Automation of template assignments can be configured as well by using rules. This is explained in this blog.

Template updates

If you have systems assigned to a template, and you have executed template changes, goto the tab Managed objects in the template maintenance screen:

Select the systems and press the Apply and Activate button. The system will apply the updated template now.

If you use transport mechanism for template updates: after transport import, you need to go to the updated templates, and still to the update assignment. This is not automatically done after the transport.

Compare templates

In the main screen of template maintenance you can select the button Compare to start the template comparison app. Select the templates to compare:

You now see the delta’s between the templates:

Creating custom metrics

Creation of custom metrics is possible. Read more about it in this blog.

The setback of custom metric is that it needs to be created each time for each template. This is another reason to keep the amount of custom templates as low as possible.