Adding Custom Dashboards in Alert Management…

Create Custom Dashboards for Alert Reporting in Alert Management

SAP Focused Run Alert Management application allows us to create a custom dashboard that can help us to report on alerts as per our custom alert reporting needs.

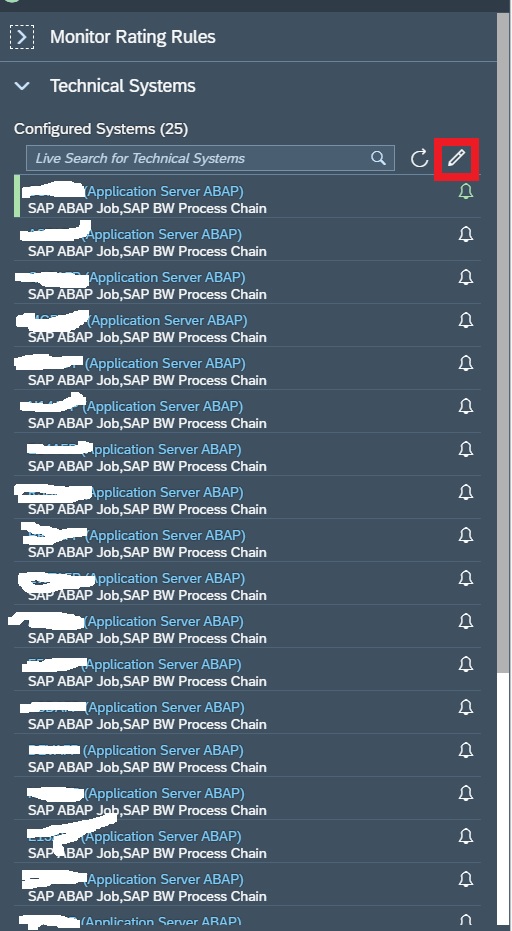
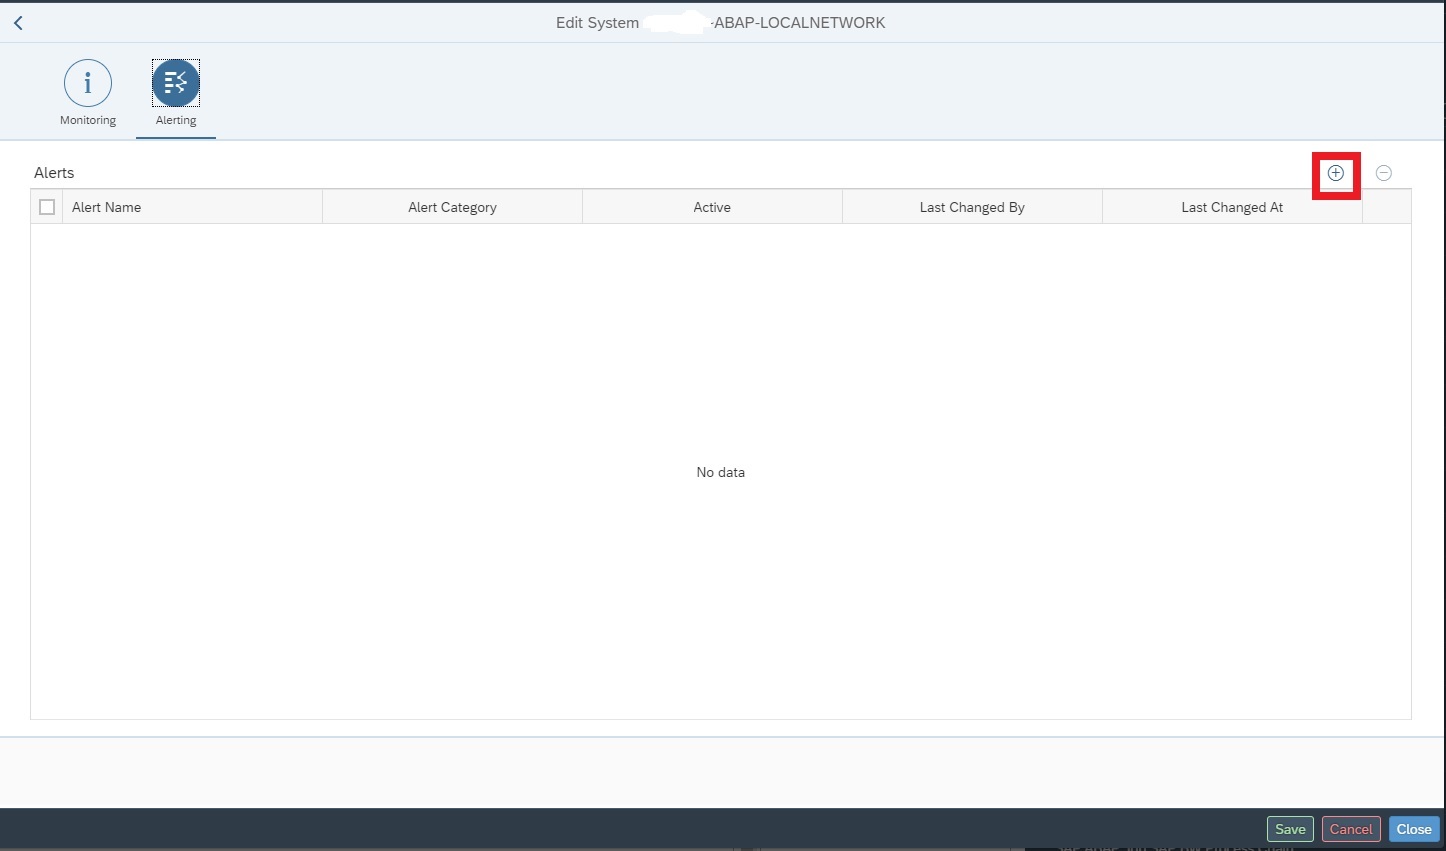
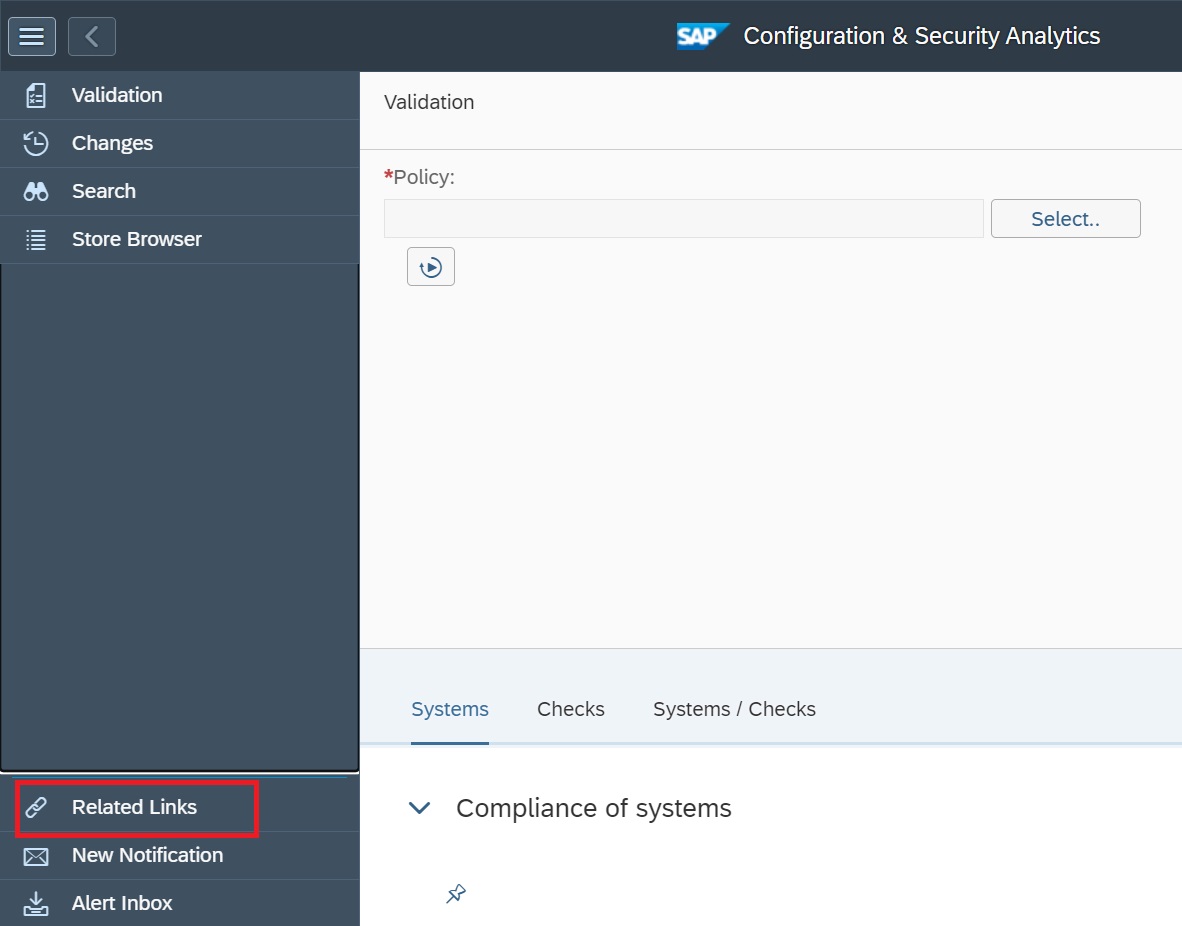
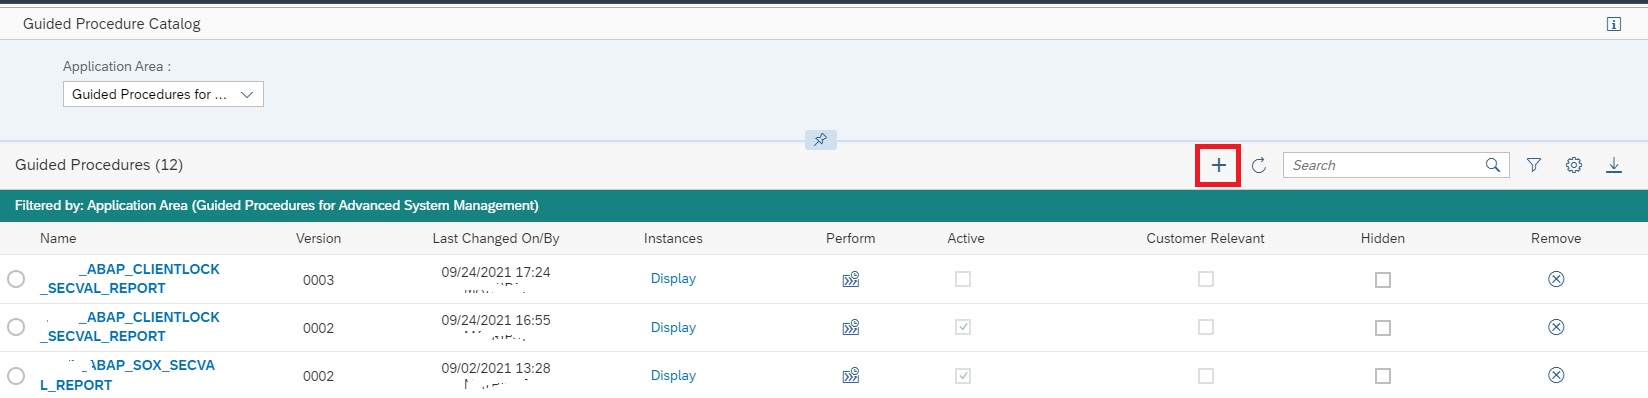
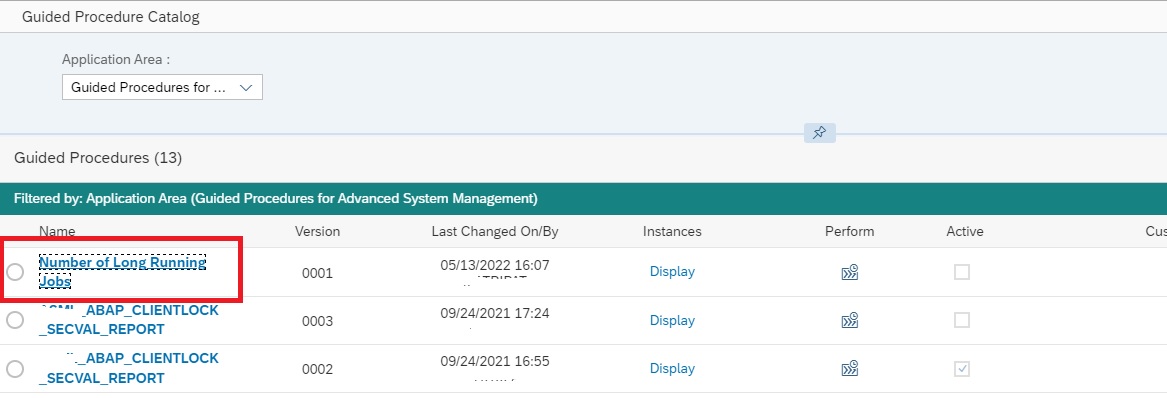
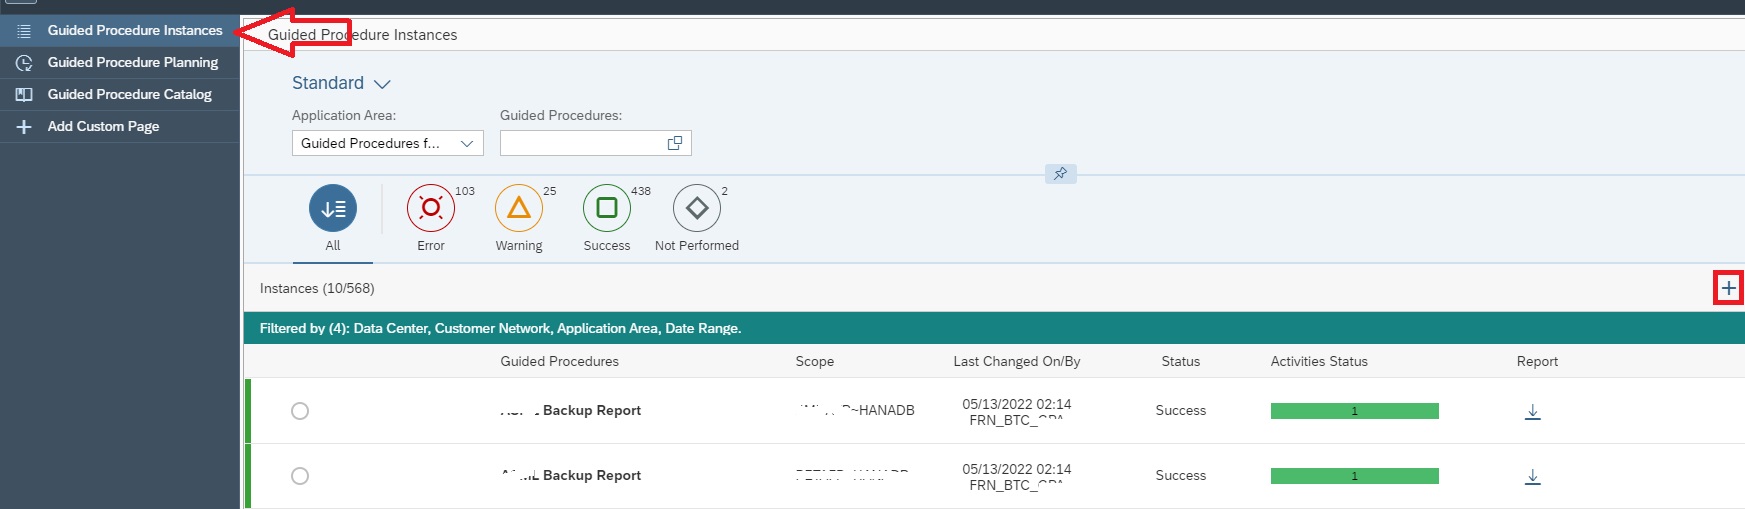
To create a custom dashboard, in the Alert Management App, click on the +sign (Add Custom Page) on the navigation panel.

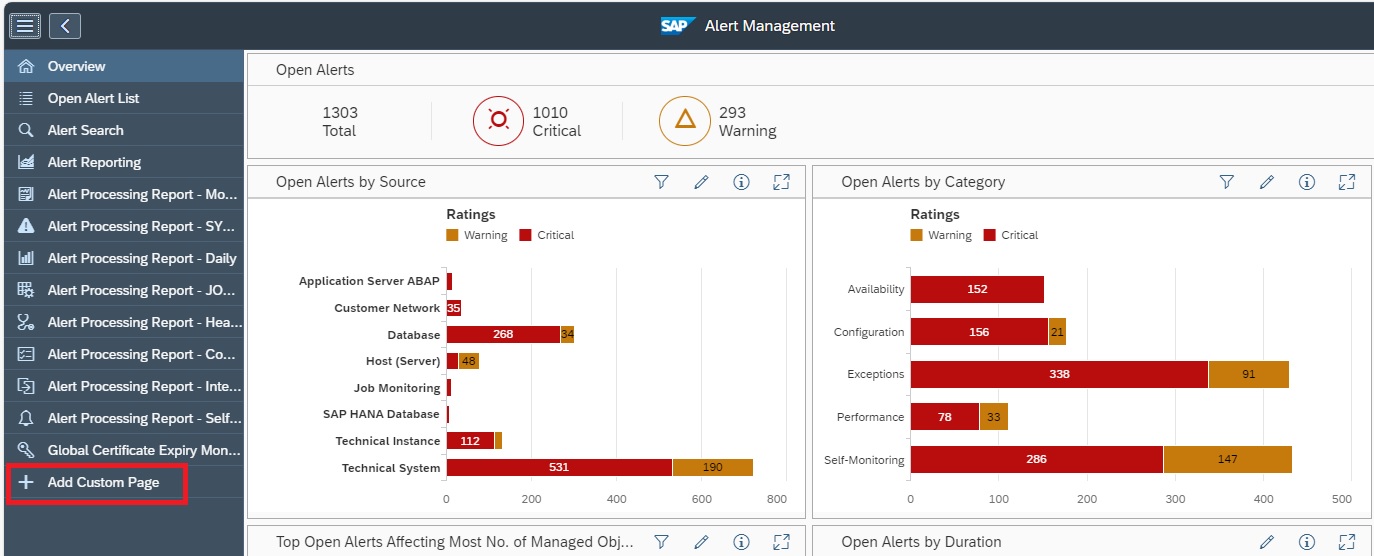
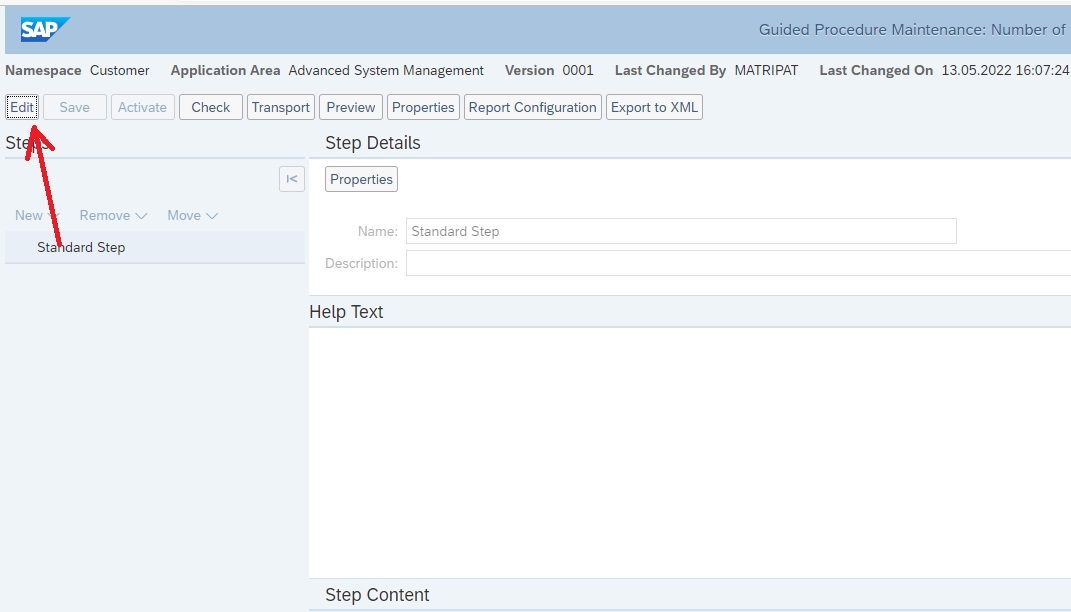
Upon clicking on Add Custom Page , a blank pane is displayed along with the setup panel to its right.

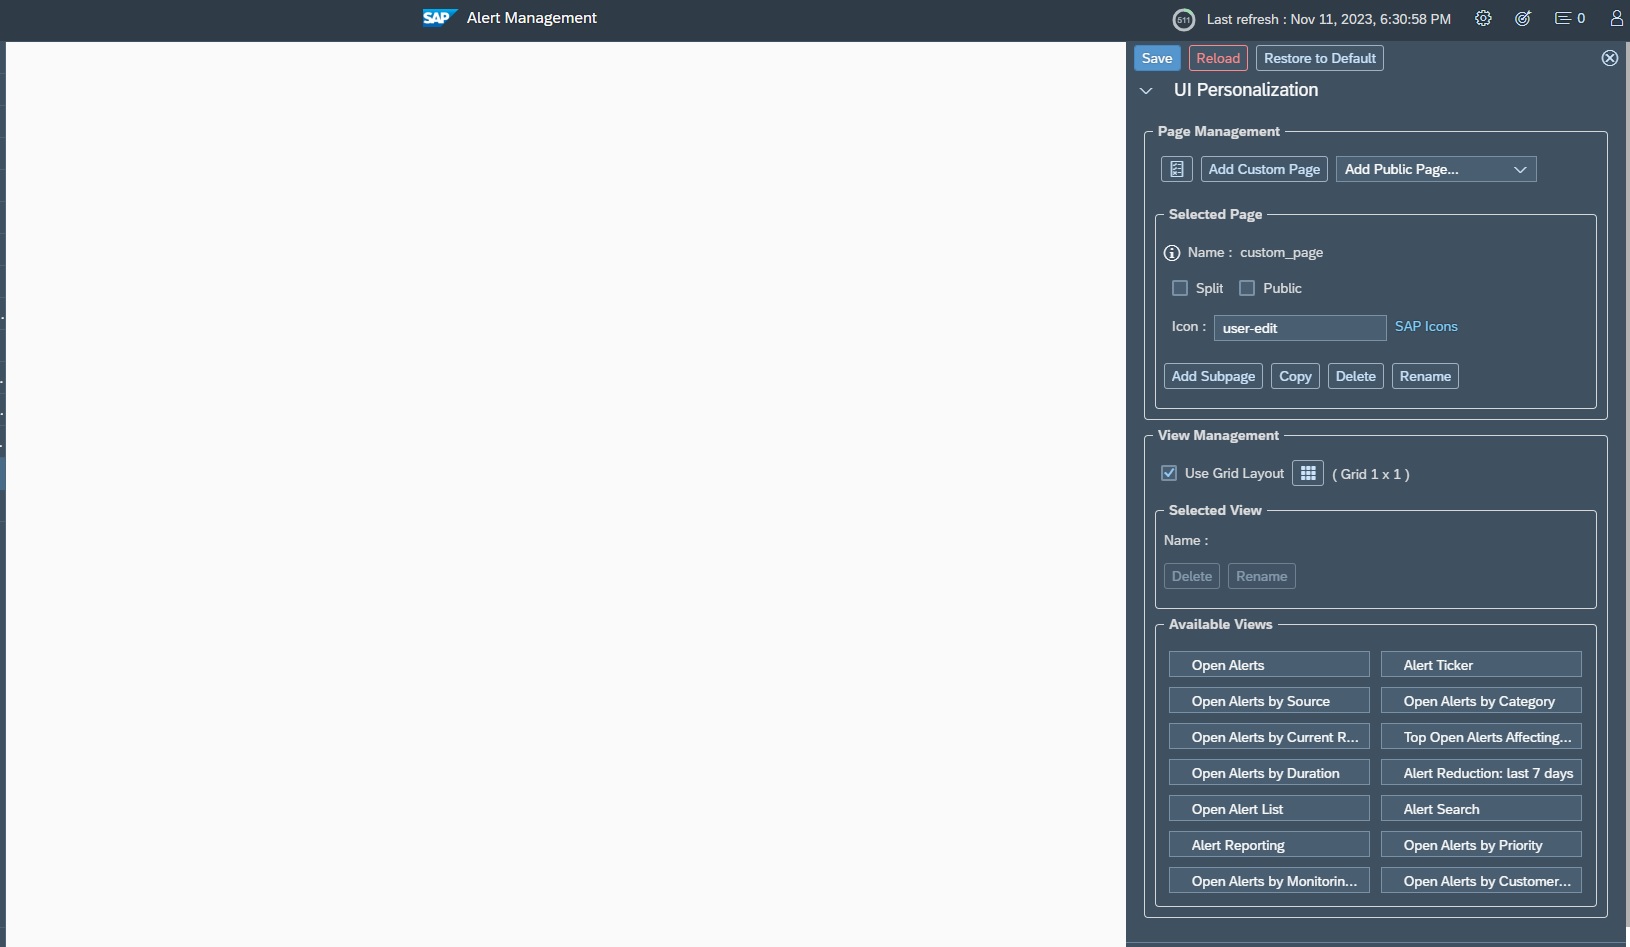
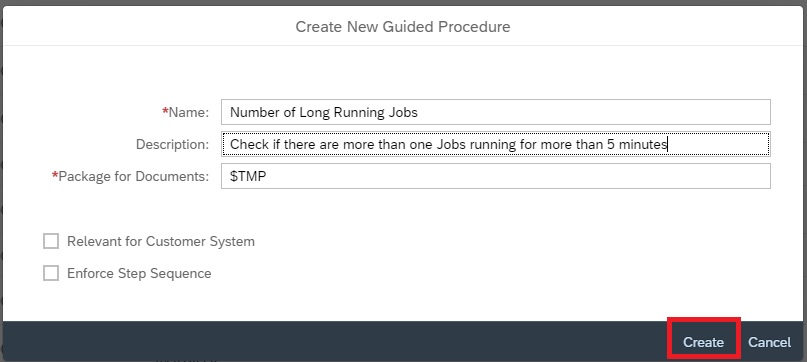
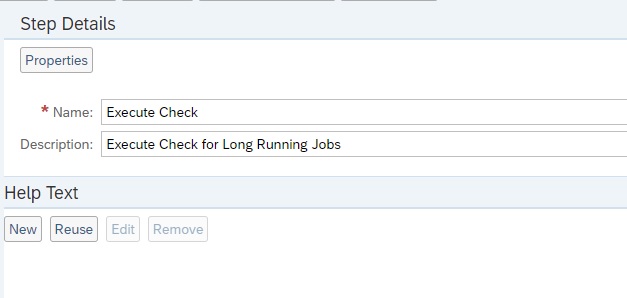
The first step in setup is to give a name to your dashboard. For this click on Rename button in the setup area Page Management.

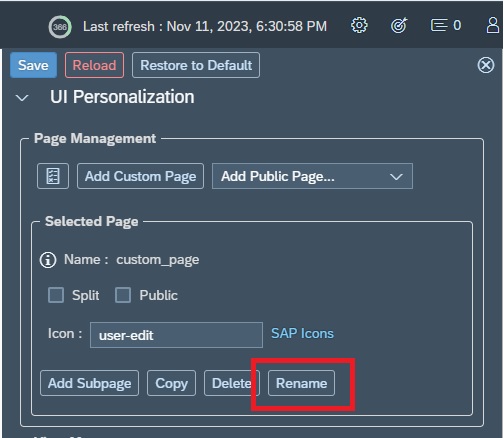
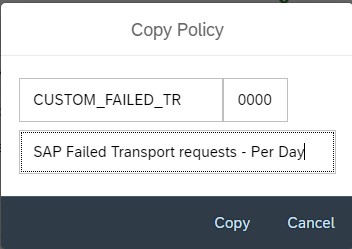
In the pop-up provide the name for your dashboard.

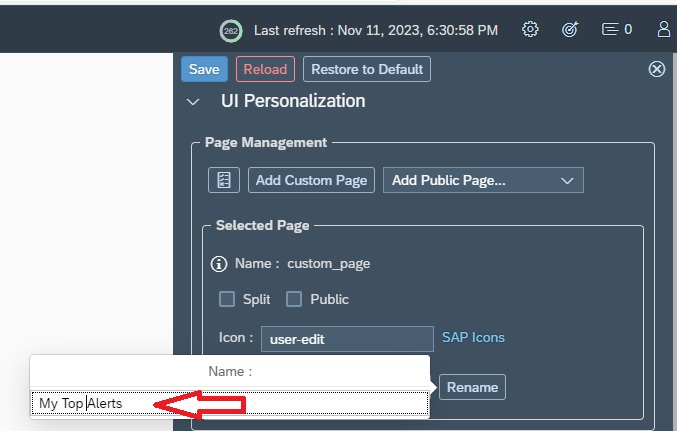
You can also give a meaningful Icon to your dashboard that will be displayed in the navigation panel. For this provide the sap icon name in the Icon field. To get a list of available icons you can also look in the SAP Icons link which takes you to the Icon explorer.

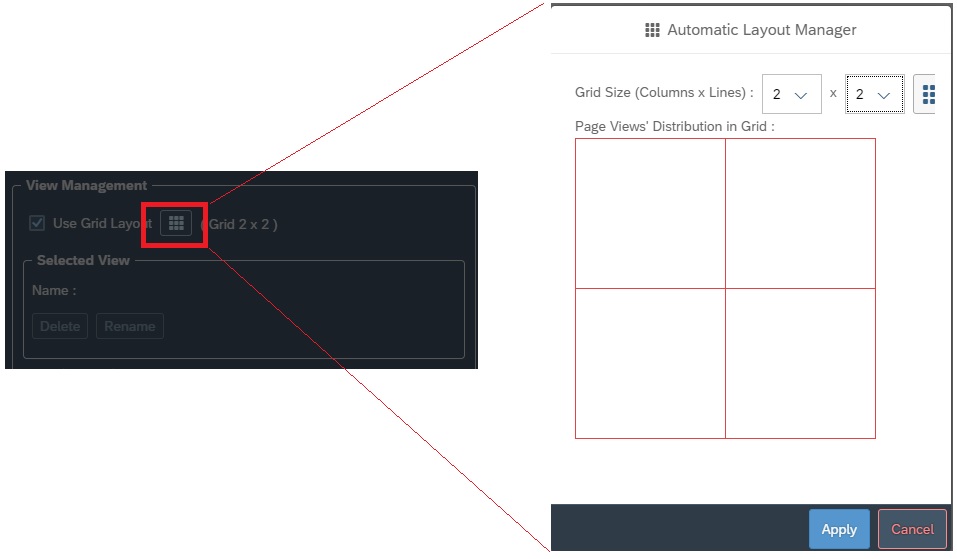
The next is to specify the grid layout (Number of rows and columns)in the view management section of setup area. By default it is 1×1 which means you can add only 1 dashboard. If you want to add more dashboards, accordingly you can adjust the grid.

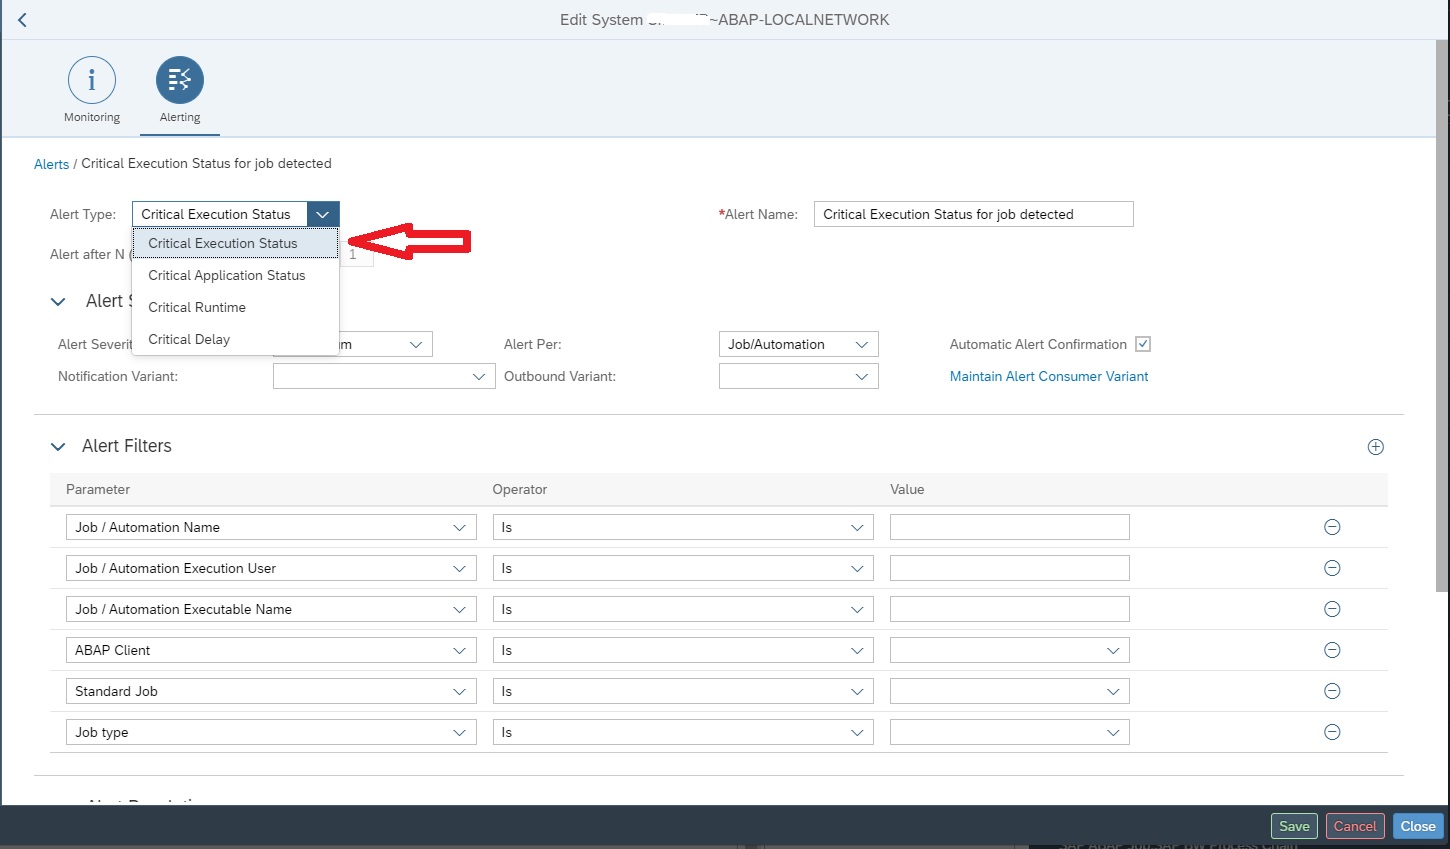
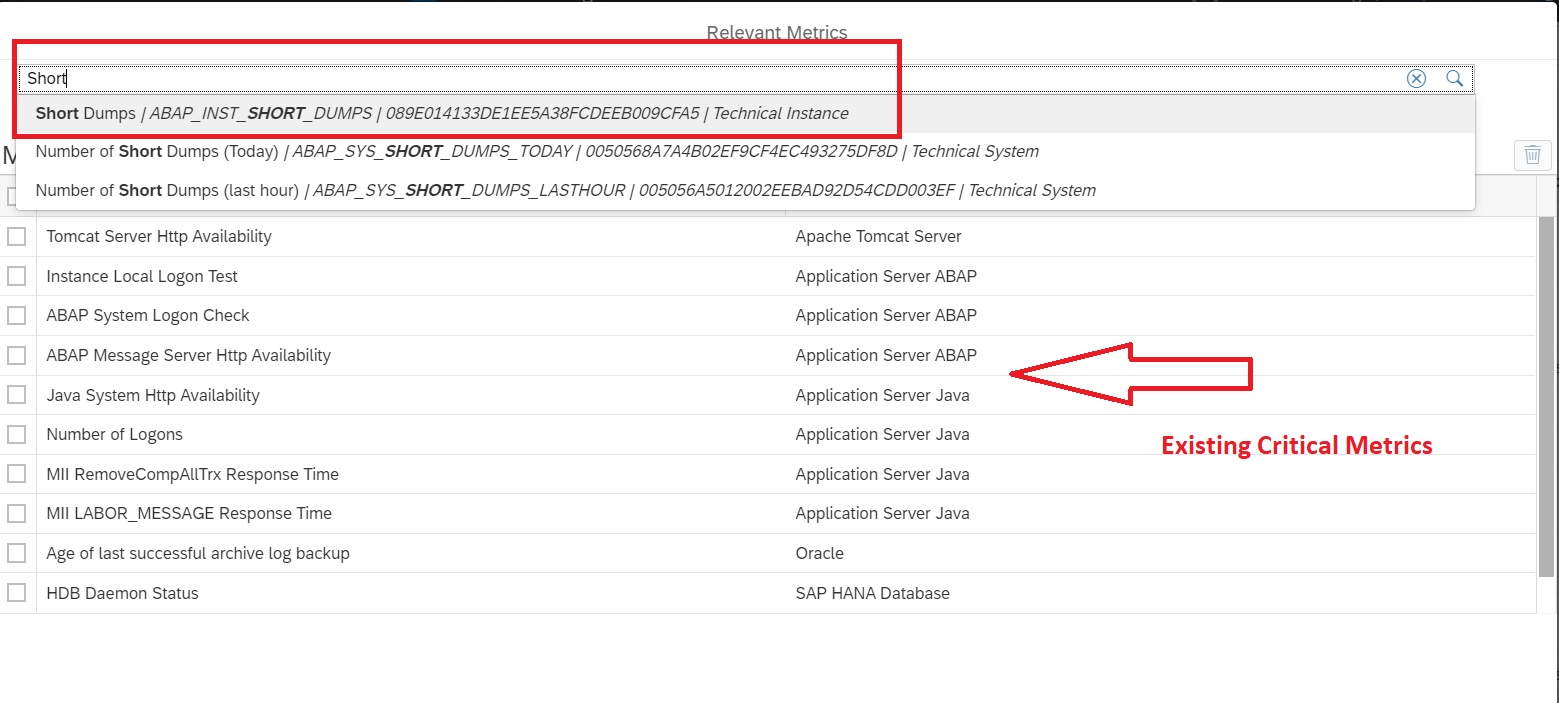
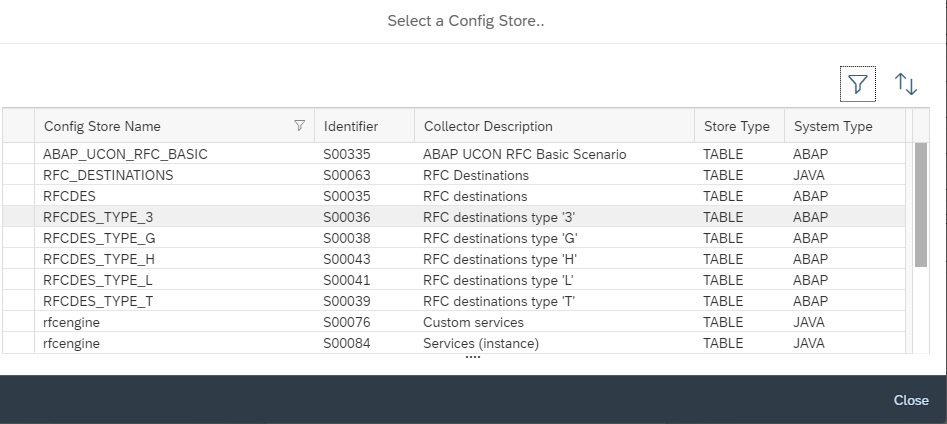
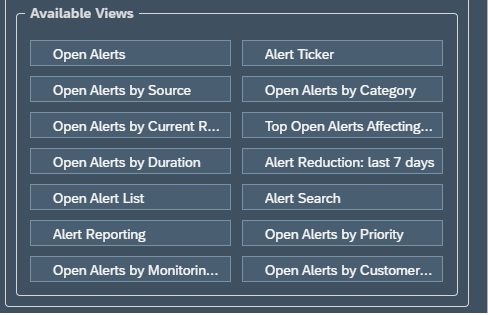
Then you need to select a view, based on what you want to show in the dashboard, by selecting from the list of available views. You can select a view by simply dragging and dropping in the dashboard layout.

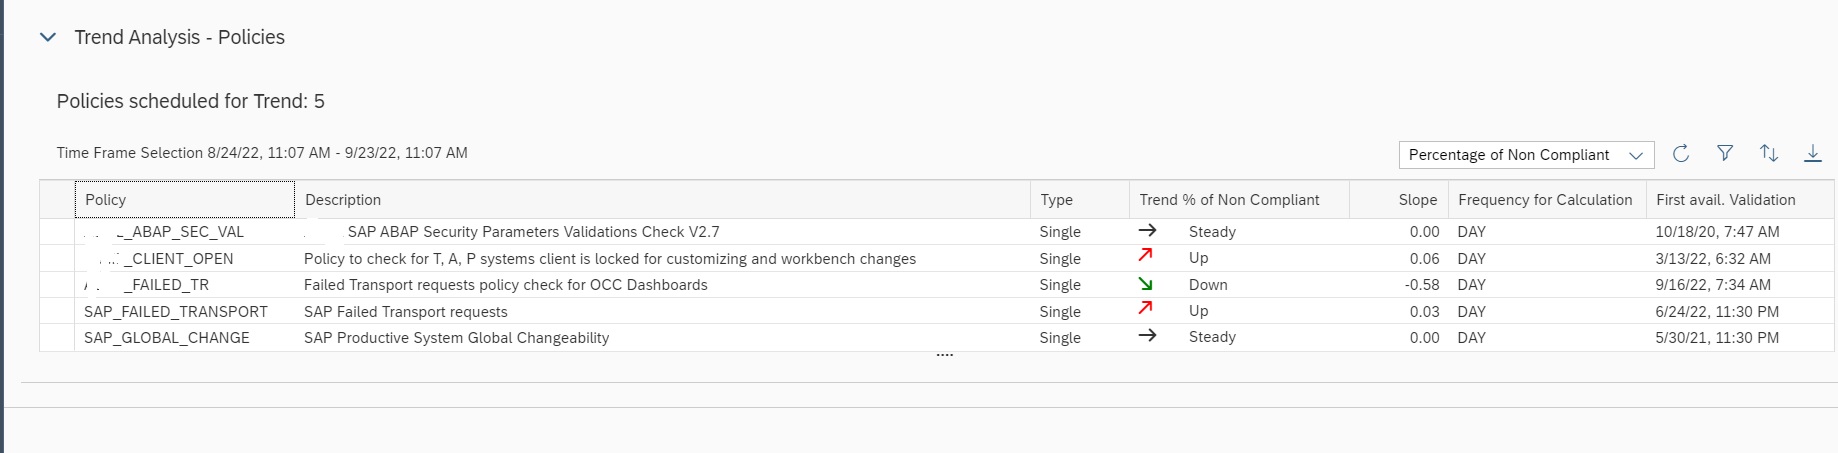
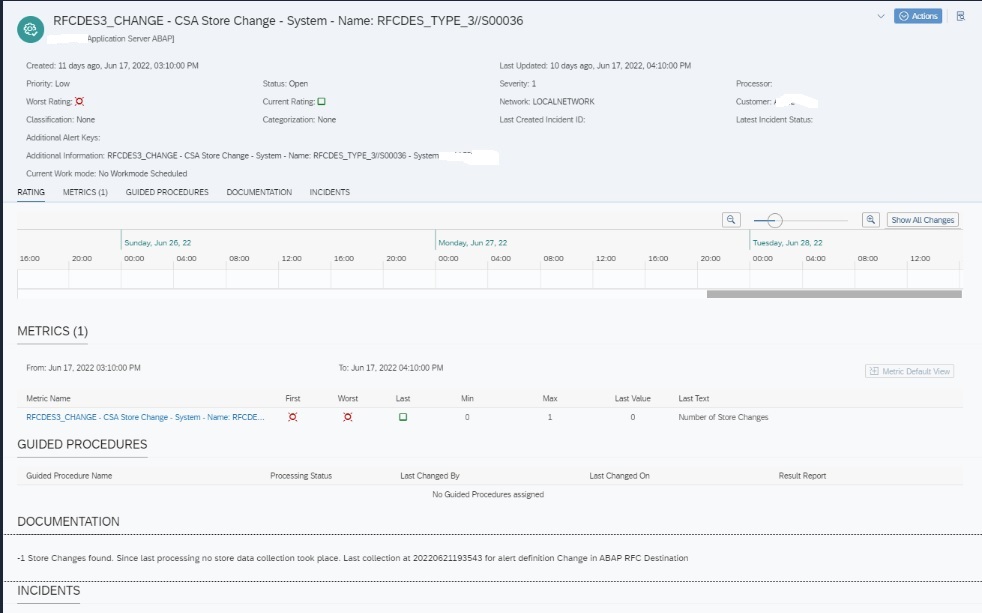
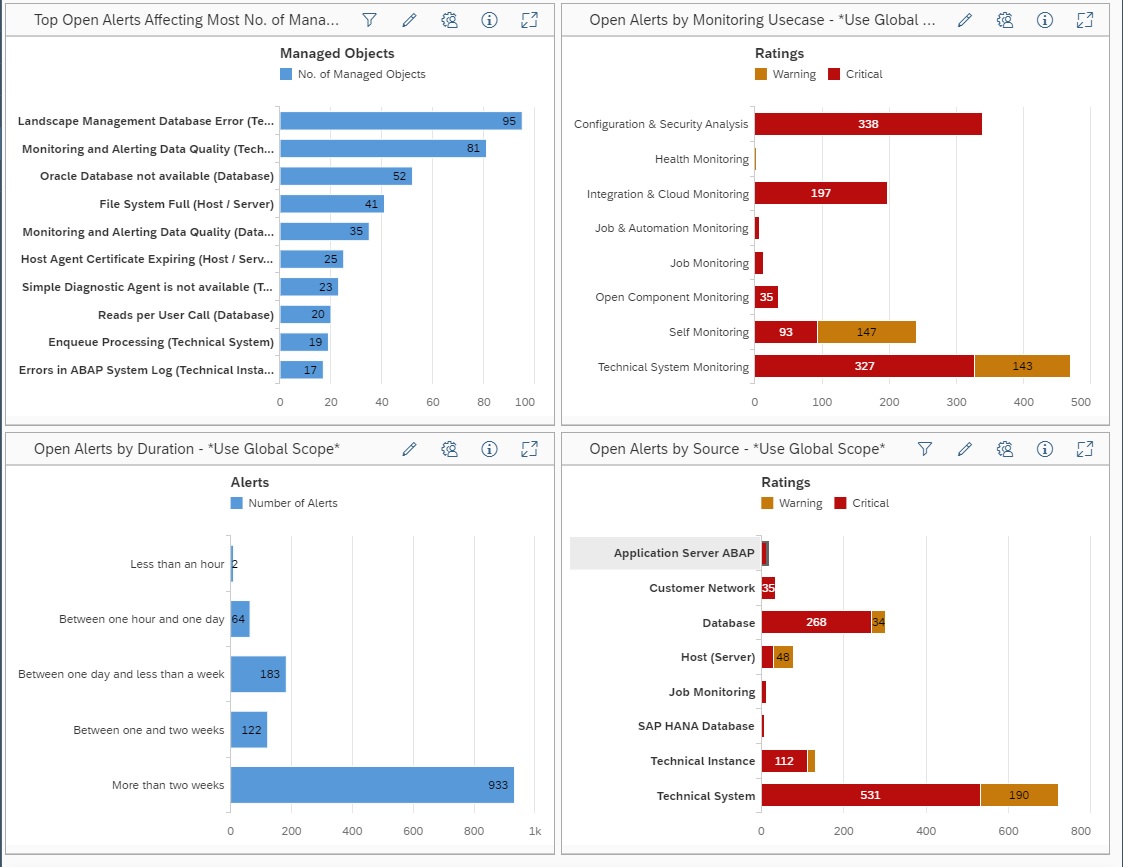
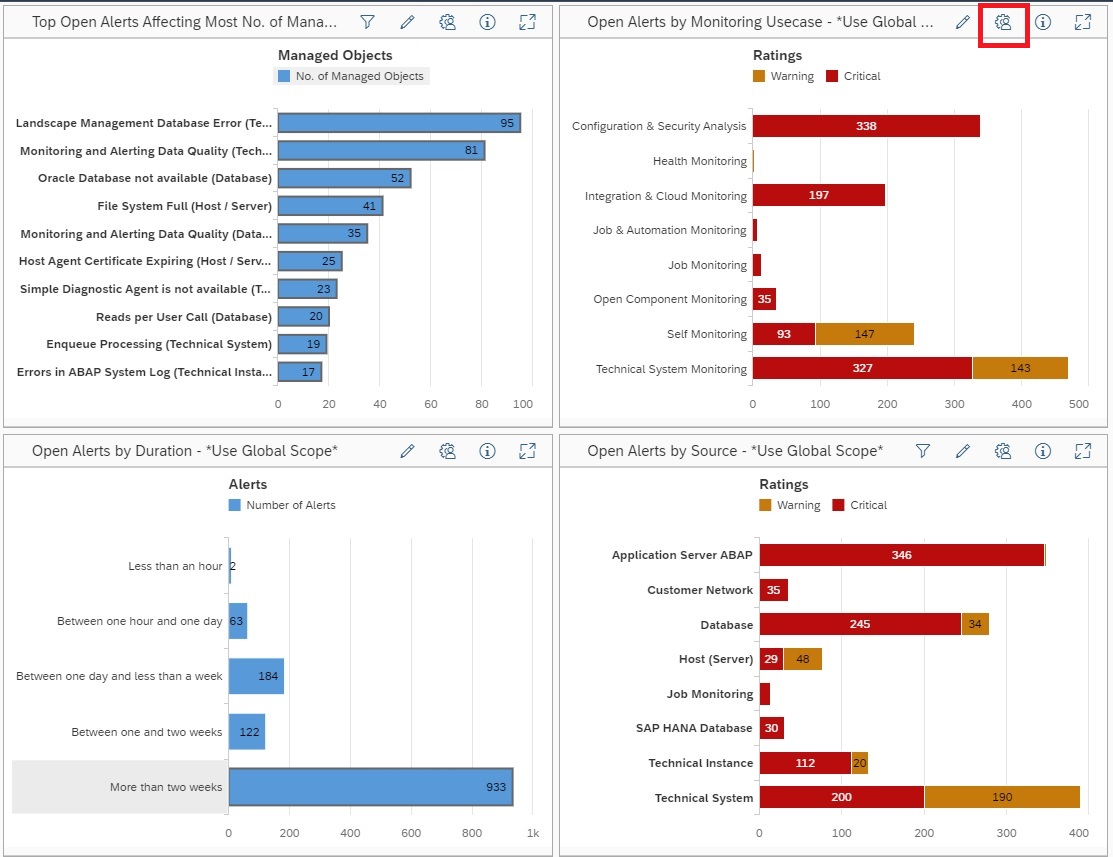
In this example we have selected 4 views in the 2×2 grid layout.

  • Top Open Alerts affecting most no. of Managed Objects
  • Open Alerts by Monitoring Usecase
  • Open Alerts by duration
  • Open Alerts by source

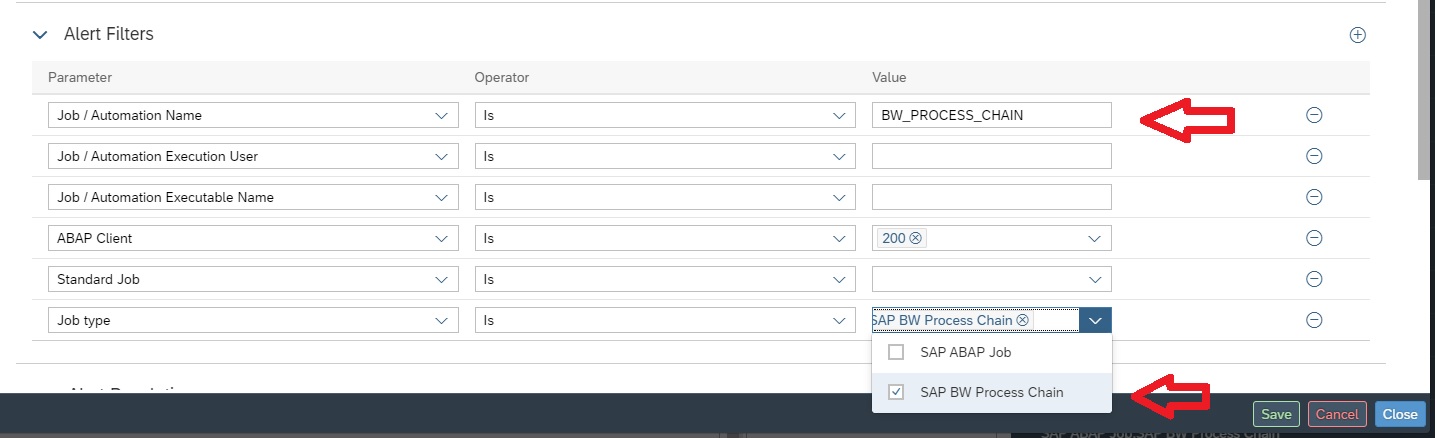
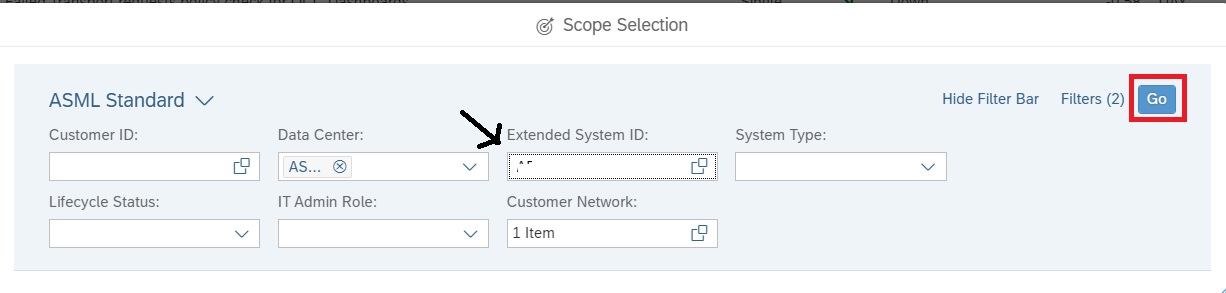
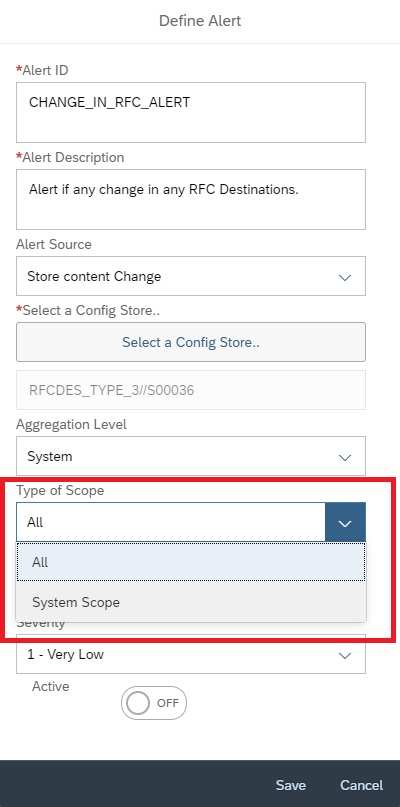
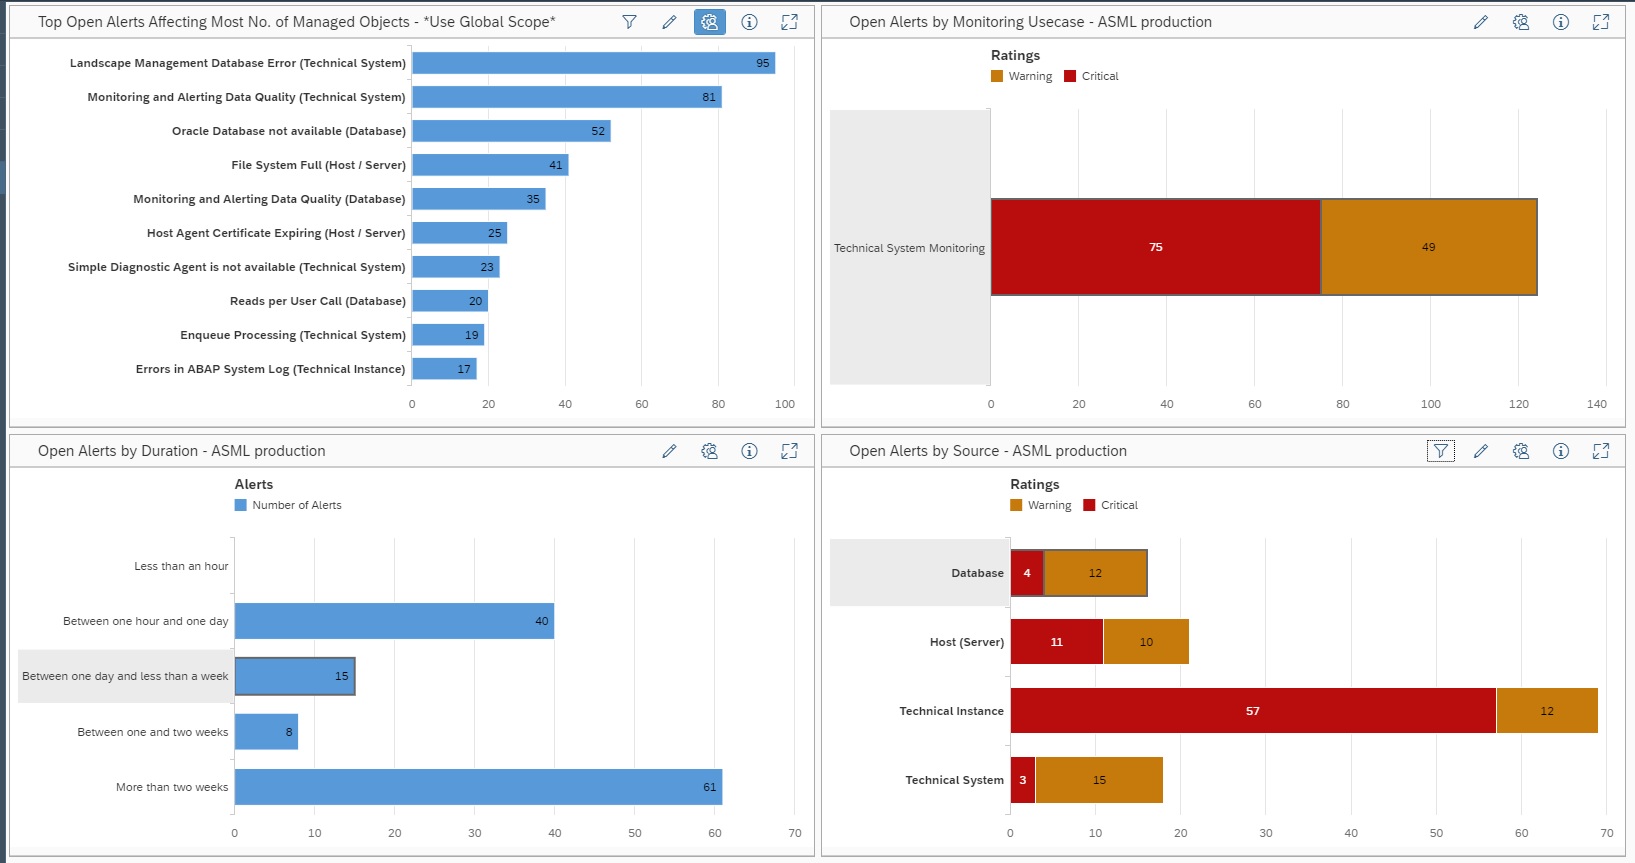
By default all the dashboards in your custom dashboard will use the Global Scope, the scope inherited from the scope you selected while opening the Alert Management App. You can also select a custom scope for your dashboard. For example in this case we want to filter for all production system alerts. For this click on the setup button of the dashboard you want to specify the scope.

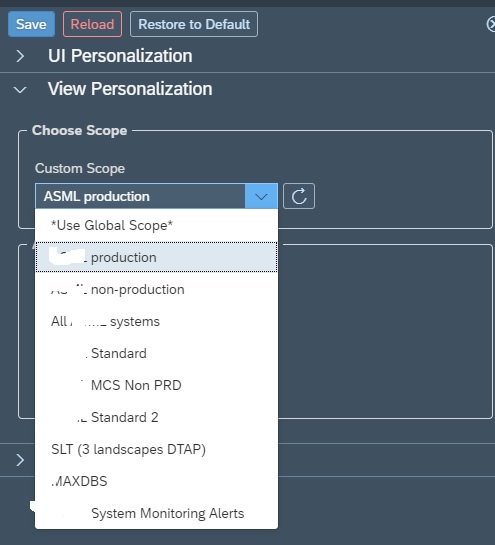
Then in the setup area, in the scope selection, select your custom scope from the drop down list. Note: You must have already created your custom scope in the Scope management section.

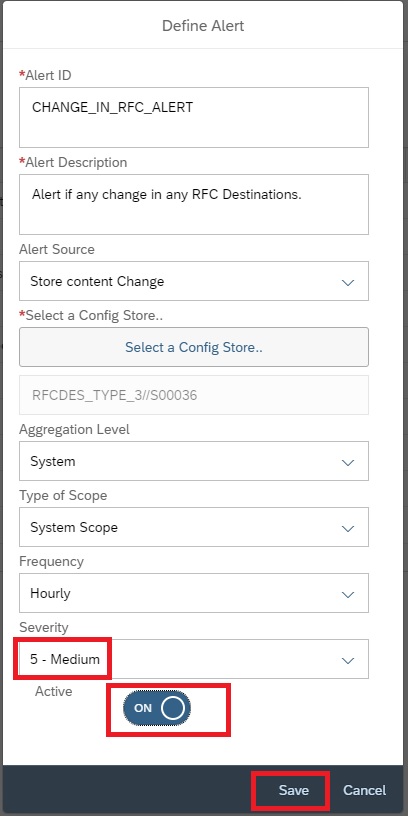
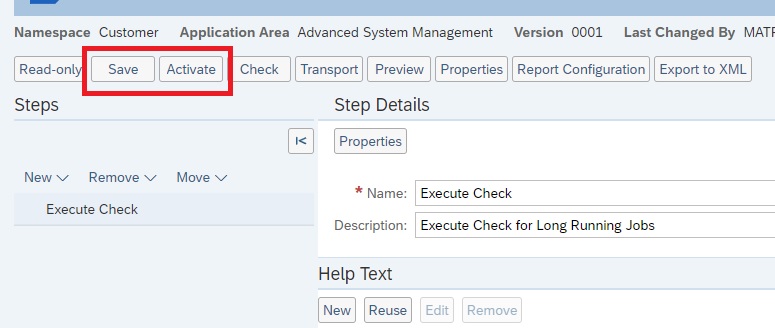
Once you have finalized your dashboard you can publish your dashboard by marking it as public so that others can also use the dashboard.

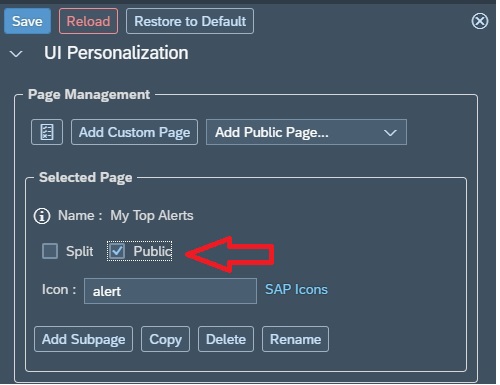
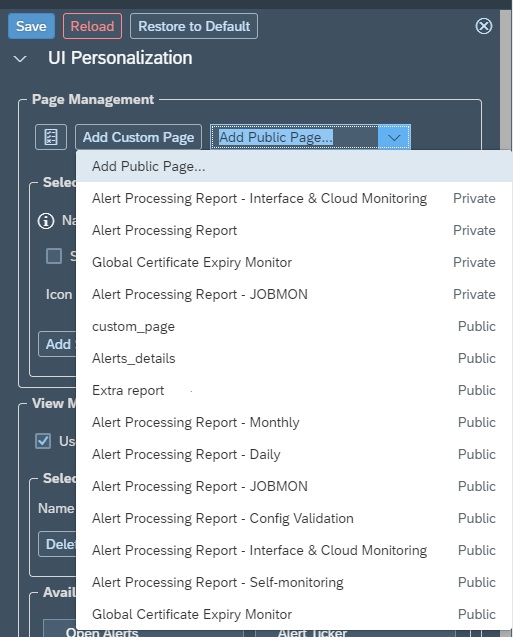
However, by default the public custom dashboard is not added in the navigation panel of all other users. To be able to view the dashboard a user has to again click on the + sign in the navigation panel, and then in setup area select the public page.

Simple Diagnostic Agent Log Configuration – Enabling Debugging for Troubleshooting…

In case of data collection issues you will need to troubleshoot Simple Diagnostic agent logs .

In some cases you might need to get further details after you see an error message in the standard SDA logs in Agent Internals. In such cases you will need to enable application specific logging. E.g. activate debug logging in order to analyze issues with a specific application or component of the SDA

For E.g.: You saw an error in agent internals like

2019-08-15 15:48:01,696 ERROR [MAI FRD 5] com.sap.solman.agent.mai.http.WebDispGetServerListCollector
com.sap.solman.agent.mai.cim.EvaluationException: division by zero
at com.sap.solman.agent.mai.cim.ExpressionEvaluator.evaluate(ExpressionEvaluator.java:72)

In this case, you will want to put to debug this class: com.sap.solman.agent.mai

Following Application components of SDA for which logging can be enabled.

Application / ComponentName (Column in Log Configuration Dialog)
JCocom.sap.solman.agent.conn.jco
MAIcom.sap.solman.agent.mai
SDA Corecom.sap.solman.agent.core
SSLcom.sap.solman.agent.core
SLDRcom.sap.solman.agent.sldr

To enable logging you can follow the following steps.

Step 1 : Open Agent Administration in Focused Run Launchpad.

Step 2: Select the agent/host for which you want to enable logs in Debug, on the option Agent Action select “Open Log Configuration” and click on Go.

In the next dialog screen enter the application classes for which you want to enable debug as shown below. After entering the classes click on Save.

In the next execution, the Agent logs will present more details.

You can collect the log files by selecting the Option Download Log File and then click on Go. It will download all SDA logs in a zip file to your desktop/laptop.

Note: Do not forget to remove the log configurations after downloading the logfiles.

Reference SAP Note 2696231 – How to set the Simple Diagnostic Agent to debug.

SNC Certificate Expiry Monitoring…

SNC Certificate expiry is very critical for ABAP systems where SNC logon is used. As soon as the certificate expires users will no more be able to login to system.

In System Monitoring for ABAP systems SAP provides a standard metric called Expiring PSE Certificates which monitors all PSE certificates that includes SNC certificates. When this metric turns red it will tell how many certificates are expiring/expired but not which one. Hence its beneficial to monitor separately the status of SNC Certificates.

This monitoring can be achieved by using Config Validation.

You can create a custom policy with the below XML code that checks the PSE_CERT store to check on status of SNC Certificate.


<?xml version="1.0" encoding="utf-8"?>
<targetsystem desc="SNC Certificate about to expire" id="ASML_SNCERT_TOBE_EXP" multisql="Yes" version="0000">
  <configstore name="PSE_CERT" system_type="ABAP">
    <checkitem desc="Valid in range" id="1" operator="">
      <compliant>APPLICATION like '%SNCS%' and CONTEXT like '%' and TYPE like '%' and SUBJECT like '%sapci%' and ISSUER like '%' and SERIALNO like '%' and VALID_FROM like '%' and ( ( ( replace_regexpr ('^$' IN valid_to WITH (replace(current_date, '-', '')||replace(current_time, ':', '')))) &gt; to_number(replace(add_days(current_date, 30), '-', '')||replace(current_time, ':', '') ))
or (( replace_regexpr ('^$' IN valid_to WITH (replace(current_date, '-', '')||replace(current_time, ':', '')))) &lt; to_number(replace(add_days(current_date, 0), '-', '')||replace(current_time, ':', '') )) )</compliant>
      <noncompliant>APPLICATION like '%SNCS%' and CONTEXT like '%' and TYPE like '%' and SUBJECT like '%sapci%' and ISSUER like '%' and SERIALNO like '%' and VALID_FROM like '%' and not ( ( ( replace_regexpr ('^$' IN valid_to WITH (replace(current_date, '-', '')||replace(current_time, ':', '')))) &gt; to_number(replace(add_days(current_date, 30), '-', '')||replace(current_time, ':', '') ))
or (( replace_regexpr ('^$' IN valid_to WITH (replace(current_date, '-', '')||replace(current_time, ':', '')))) &lt; to_number(replace(add_days(current_date, 0), '-', '')||replace(current_time, ':', '') )) )</noncompliant>
    </checkitem>
  </configstore>
</targetsystem>

Note: In the above XML code, SUBJECT like ‘%sapci%’, you have to replace sapci with a hostname pattern that you use for all your SAP ABAP system hostnames.

To know more about policy maintenance you can refer to our below blog where in we have explained in detail with another example how to maintain policies, edit the XML code and then generate the policy.

Once you have created the policy, you can directly activate alerting on the policy.

For that go to the Configuration and Security Analytics app in the Advanced Configuration Monitoring area.

In the app navigate to Configuration Validation Alert Management under the the Related links tab.

In the Alert Management app click on Create button to create the alerting for the policy you just created.

In the next popup, enter details as shown below and then click on Select policy to select the policy for which you want to activate the alert.


In the next popup select the policy by clicking on the policy name.

Now click on Save to activate the alerting.

Additionally you can also activate email notification on the alert. For this in the Alert Management main screen, select the alert and then click on Notification/Outbound

In the next popup select the notification variant and save.

Now your alerting is active along with notification for SNC certificate expiry.

For more details on Config Validation you can refer to SAP documentation here.

Process Chain Monitoring in SAP Focused Run…

Process Chain Monitoring in SAP Focused Run is possible via Job And Automation Monitoring which is available as of SAP Focused Run 3.0 FP02.

You can launch the Job & Automation Monitoring app in the Advanced Application Management section in the Focused Run launchpad.

When you launch the app you will be asked for a scope selection for which you can specify the systems for which you want to activate Process Chain Monitoring.

To start the setup of Process Chain Monitoring click on the settings button .

In the settings popup click on the pencil button under Technical Systems.

In the next popup select the system for which you want to configure process chain monitors by clicking on the area as shown below.

In the next screen , in the Monitoring tab click on the + sign to create a new filter to activate data collection.

Now provide a filter name and then in Job Type select SAP BW Process Chain and save.

After creating the filter move to Alerting tab and click on the + sign to create a new alert.

You can create the following types of alerts.

  • Critical Execution Status: The Execution Status is rated green, if a job finished successfully and red, if the job execution did not finish, i.e., aborted. It is rated yellow, if a job finished with warnings or errors without aborting.
  • Critical Application Status: The Application Status is rated green, if a job successfully processed the application data. It is rated red, if e.g., an ABAP job execution writes errors into the application log and yellow, if there are warnings, but no errors.
  • Critical Delay: The Start Delay rating is rated green, if the technical delay of a job (e.g., in case of an ABAP job the time passed until a job gets a work process assigned) did not exceed the threshold defined.
  • Critical Runtime: The Run Time is rated green, if the runtime of a job did not exceed the threshold defined.  

To create the alert first select the alert type.

Then in Alert Filters section provide the BW Process Chain name for which you want to activate alerting. Also you must provide the job type as BW Process Chain. You can optionally enter further filters like Execution User, Executable Name, ABAP Client and whether it’s a Standard Job or not.

Note: With Job & Automation monitoring you can create alerts for Standard ABAP jobs as well. The filters Executable Name and Standard Job is applicable only for ABAP Job type.

Optionally you can also set Notification Variant, Alert Severity and enable Automatic Alert Confirmation in the Alert Settings section.

Optionally you can also provide Resolution Instructions in the Alert Resolution area.

If you select alert type Critical Delay or Critical Runtime you also have to enter the thresholds.

Finally click on the Save button to save and activate the alerting.

Note: When we activate monitoring of process chain by creating the filter in the Monitoring tab, we activate data collection for Process Chain monitoring. This will enable data collection of all process chains of that managed system. You can see status of all process chain runs for that system in the main page of the Job & Automation Monitoring app. Additionally and optionally you can create/enable alerting in the Alerting tab to alert on specific process chain failures.

Note: Since the launch of Job & Automation Monitoring in Focused Run 3.0 FP2 the old Job Monitoring feature has been renamed to Job Monitoring ABAP Only. The Job Monitoring ABAP Only functionality is completely deprecated as of release of Focused Run 4.0.

For more details on Job & Automation Monitoring you can refer to SAP documentation here.

Transport Tracking using SAP Focused Run Configuration Validation…

How to Track ABAP Transport Import Hisotry using Focused Run CSA Trend Analysis

For an SAP Application Management team in any IT landscape , doing a timewise tracking of transport movement across SAP System Landscapes is a very important monitoring requirement.

In this blog I’ll explain how you can do transport tracking, using Configuration Validation Trend Analysis application. With this you can track how many transports got imported verses how many got failed.

SAP provides a standard configuration validation policy called SAP_FAILED_TRANSPOTS that collects last 7 days data from config store ABAP_TRANSPORTS of SAP ABAP managed systems. SAP uses this policy result for the system monitoring metric for failed transport.

To be able to see a day wise trend for transports you will have to first copy this standard policy to a custom policy and change the time period of compliance rule in the policy from last seven days to last 1 day.

For this first you navigate to Policy Management app in Advanced Configuration Monitoring area in SAP Focused Run Launchpad.

In the Policy Management App select the policy SAP_FAILED_TRANSPORTS and copy.

Provide a custom policy name and description and copy.

Now you will be back in the main screen, click on the custom policy name you just created.

In the policy editor screen click on Edit button to start editing your policy.

In the compliance rule change the hour value in CURRENT_UTCTIMESTAMP,-3600*168 from 168 to 24 CURRENT_UTCTIMESTAMP,-3600*24

Save the policy by clicking on Save button.

Now generate the policy by clicking on Generate button.

Now you can validate if the policy is working fine by clicking on the Validate button.

If no error is there, in a new window you will see the validation results as shown below.

Now your custom policy is ready, but before you can use this policy for Trend Analysis you need to activate periodic data collection for this policy. For this navigate back to the main screen of Policy Management app.

In the main screen select the custom policy and click on Configure.

In the next pop-up window click on Edit button to continue.

You can now set the Validation run interval to Hourly or Daily and then save and exit.

After you schedule the validation wait for at least one week to see the data in the trend analysis app. Data will be available only from the time you activated the validation run schedule.

Now you can run Trend Analysis on this custom policy to do transport tracking. For this navigate to the Configuration & Security Analytics Trend Analysis App in the Advanced Configuration Monitoring area of Focused Run launchpad.

In the home screen app you will see the trend overview of the policies which are scheduled for validation run and for which data is available.

To do transport tracking on the custom policy you created and scheduled for validation, first select the managed system for which you want to do tracking in the scope selection.

After selecting scope, select the policy and in the the Key Figure dropdown select All items to see Number of transports imported to the managed system. If you select key figure Non Compliant it will show you the numbers for failed imports.

If you scroll down, you can also find details of each transport that were imported in the managed system in the specific time frame shown in the graph.

To know more possibilities with SAP Focused Run Configuration and Security Monitoring you can refer to our blogs here.

You can also find SAP manuals on Configuration and Security monitoring here.

Alerting on Critical Metrics Turning Grey…

It is essential to activate alerting on critical metrics turning grey in order to avoid missing critical issue not getting detected by Focused Run.

Since SAP Focused Run 3.0 FP2 , a new metric has been added to the self monitoring template in System Monitoring, the Grey Metrics metric measure what percentage of critical metrics in Grey.

This metric by default uses threshold 30% for Yellow and 70% for Red rating. You can change this threshold to show red if value crosses more than 1% so that if there are any critical metric that is in grey then alert is raised.

Note: This metric considers only those metrics which are marked as critical in Self Monitoring app. The percentage is calculated based on how many metrics out of the metrics designated as critical metrics in Self Monitoring app are in Grey.

To designate a metric as critical metric navigate to Self Monitoring App in Focused Run launchpad –> Infrastructure Administration.

In the Self Monitoring app navigate to MAI Data Quality.

In the Overview screen select the Managed System type to go to its details screen.

In the Details page it shows list of systems with their critical metrics that are in grey. To modify the list of designated critical metrics click on the chnage button.

In the new popup use the text search button to enter the text of the metric you want to add to the list.

Finally click on the “+” button and then click on close to save the added metric in the critical metric list.

Now the added metric will be considered as critical metric while calculating % of Grey Metrics.

Monitoring Changes in RFCs in SAP ABAP Systems using SAP Focused Run…

With SAP Focused Run 3.0 FP 2, its now possible to monitor changes in RFCs in SAP ABAP Systems.

In SAP Focused Run 3.0 FP 2, you can activate alerting and notification for any changes to the content of a CCDB config store. Using this functionality we can activate alerting and notification on the CCDB store that contains information about RFCs.

First we need to identify which CCDB store keeps the information on RFCs. For this you need to click on Configuration & Security Analytics – Administration app in the Advanced Configuration Monitoring section of SAP Focused Run Launchpad.

In the app select any of the SAP ABAP systems. Upon selecting a system you will see the list of available CCDB stores for the system.

Now you can filter on Description for text “RFC” to see RFC related CCDB stores.

You will see the following CCDB Stores. To monitor changes to RFCs either you can use the generic CCDB store to monitor on all type of RFCs or you can use the specific RFC type CCDB store. In this example we will use the RFC destinations type ‘3’ CCDB store.

Next you need to go to the main Configuration and Security Analytics app.

In the app, in the navigation area click on Related Links.

Select Configuration Validation Alert Management.

In the alert management app, click on create button.

Enter Alert ID, Description and then select the Alert Source as Store content change.

Click on Select a Config Store

In the next pop-up to select the store, filter on description “RFC”.

Then from the list select the specific RFC CDDB store you want to report on and then click on close.

Then back in Alert creation screen, you can select the scope as ALL or for specific system. In this example we selected a specific managed system.

You can set the frequency between Hourly, Daily or Weekly.

Then, set the Severity and click on Active button and then save.

Upon activation it will start monitoring is there are any change is performed to the specific RFC store. Changes include Creation/Deletion/Update.

Upon any change detected an alert will be generated of the below format. This alert will be visible in the Alert Inbox.

Monitoring Number of Long Running Jobs…

In SAP Focused Run there is no standard way of monitoring number of long running jobs either in System Monitoring or in Job Monitoring

With Job Monitoring you can monitor if a specific job is running for more than specific amount of time, but we can’t monitor if there are more than a specific number of jobs that are running for more than a specific amount of time.

And in System monitoring we can only monitor if there are more than a specific number of cancelled jobs or job in status running but we can’t monitor long running jobs.

Note: To know more about Job Monitoring you can refer to our blog here.

However, the Focused Run Guided Procedure Framework provides a pre-build plugin by which you can create a custom guided procedure to check the number of long running batch jobs in a managed system.

Setup

To access Guided Procedures App navigate to Advanced System Management area on the Focused Run launchpad and click on the System Management Guided Procedure App.

Then on the Guided Procedure app navigate to Guided Procedure Catalog page.

On the Catalog Page click on the + button to create a new custom guided procedure.

In the next pop-up screen provide a name and description. Optionally you need to select a package if you want to transport your guided procedures e.g. from DEV Focused Run system to PROD Focused Run system.

Then back in the Guided Procedure Catalog screen click on the guided procedure you just created to open it for editing.

In the guided procedure edit screen click on Edit button.

In the Properties section provide a name for the step and a description as shown below.

Then in the Step Content section click on New button to add a step.

In the next popup select the plugin ABAP Long Running Jobs and provide the threshold for time range as long running Job. You can also specify the graphic type as a table or as a bar chart. After selecting, click on Ok button to continue.

Then Save and Activate the custom guided procedure.

Now your custom guided procedure is available for execution.

Go back to Guided Procedures Instances page to execute your guided procedure. Click on the + button to start a new execution.

In the next popup, select the guided procedure you just created and then click on + button to add managed systems for scope of execution.

After selecting the managed system click on Perform Manually to create the instance of the guided procedure for the selected scope.

Then click on the instance to start the guided procedure page.

Click on Perform to execute the guided procedure.

Now you will see the result as shown below.

For more information regarding available plugins you can refer the SAP documentation here.

Monitoring Cloud Connector BTP Certificate Expiry…

With SAP Focused Run 3.0 FP 2 SAP has delivered a configuration validation policy using which you can monitor Cloud Connector BTP Certificate expiry.

Note: For using this functionality you just have to ensure that you have registered your cloud connector managed system to your Focused Run System and have performed SSI for the cloud connector managed system.

You can do the monitoring via the Configuration & Security Analytics app in the Advanced Configuration Monitoring area of Focused Run Launchpad.

In the app click on the select button to select the policy to monitor Cloud Connector BTP Certificates.

In the pop-up you can search for SCC and then select the policy SAP_SCC_PSE_CERT. This is the standard policy delivered by SAP that performs configuration validation on Cloud Connector BTP Certificate expiry.

This policy monitors if a BTP certificate in cloud connector system is going to expire in less than 30 days or is already expired.

The first view upon selecting the policy is the Systems view. In this view all SAP Cloud Connector systems registered in Focused Run system are listed. A systems is marked as non compliant if it has any certificate which is going to expire in less than 30 days or has any expired certificates. This view also tells how many certificates are there in the system and how many are non compliant.

You can click on the row to see the details of the certificates which are expiring or expired.

To know more about Configuration and Security Analytics you can refer here.

Also you can find more detail at SAP documentation here.

Mass Agent Update in SAP Focused Run…

In SAP Focused Run, the Simple Diagnostic Agent (SDA) is installed/updated in managed system hosts via the agent admin app which we have explained in this blog. However with this approach you can update the agents for a single host or a selected list of hosts.

SAP Focused Run also provides a mass agent update app in the Focused Run launchpad using which you can update SDAs in all connected hosts of a particular data center on a single go. This is specifically useful for updating the SDA’s for all hosts after SAP releases a new version of SDA.

You can access the Agent Mass Update app in the Infrastructure Administration section of Focused Run Launchpad.

However before you use this app , you have to ensure that you have already uploaded the binaries as we have explained in this blog.

For updating the agent just open the app and select the Data Center for which you want to update the agents and click on Update agents to start the update.

After you start the update, you can monitor the progress with the progress bar where it also lists how many agent installations were successful and how many have failed.

Note: SAP normally releases a new version of SDA every 2 to 3 months. You can download the latest version of SDA from here.