Deploying Simple Diagnostic Agents on Managed Systems…

Deploying Simple Diagnostic Agents (SDA) on Managed System hosts is a prerequisite to performing Simple System Integration (SSI) of Managed systems on focused run system.

The SDA is installed/deployed as an add-on to the SAP host agent. Hence it’s mandatory to install SAP Host Agent on each host of the managed system which needs to be monitored by SAP Focused Run System.

The deployment of the SDA on the managed system system host is carried out from the SAP Focused Run system itself.

Below steps need to be performed for deploying SDAs on managed system hosts.

Download binaries from marketplace

Download the latest version of the binaries SDA and SAP JRE (Java Runtime Environment) from SAP Support Portal as follows:

  • Go to Software Downloads – SAP ONE Support Launchpad
  • Select tab Support Packages & Patches –> By Category –> SAP Technology Components –> Focused Run –> Focused Run 3.0 –> Downloads –> Comprised Software Component Versions
  • Download from SAP JRE 8.1 and SIMPLE DIAGNOSTICS AGENT 1.0

Following platforms are supported

  • IBM AIX
  • HP-UX on IA64
  • Linux on Power BE & LE
  • Linux x86_64
  • Oracle Solaris SPARC
  • Oracle Solaris x86
  • Microsoft Windows Server on x86_64

You can find all information regarding latest available version of SDA and its compatible JRE version in SAP Note 2369401 – Release Note for Simple Diagnostics Agent 1.0

Upload Binaries onto SAP Focused Run system

Upload the binaries to SAP Focused Run, by running the report SRSM_AMA_UPLOAD_BINARY, with transaction SA38.

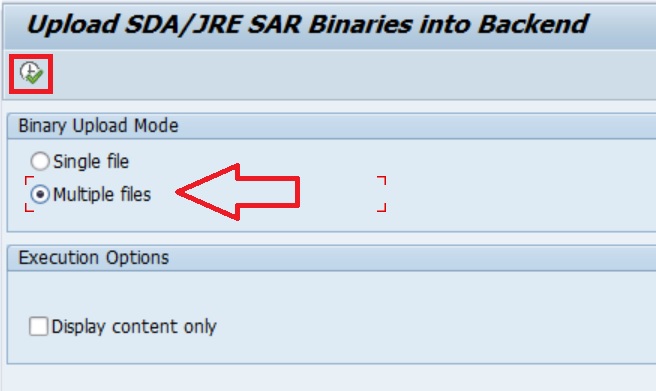
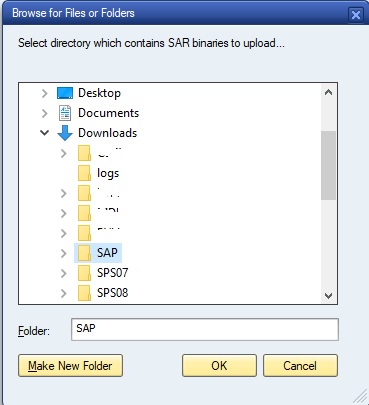
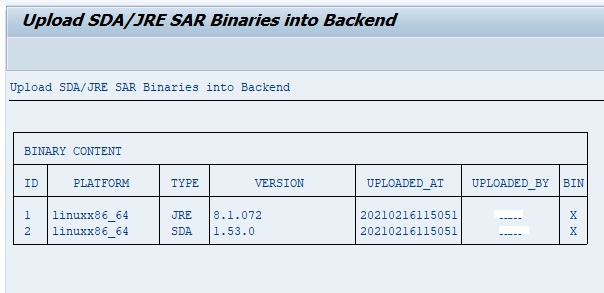
Upon completion of the upload you will see the below output.

Deploy SDA on Managed system host

Register Managed system host on Focused Run system: Before you can deploy SDA on managed system host, the host has to be registered to the Focused Run System. For this execute the following script at OS level as sapadm user from folder /user/sap/hostctrl/exe

./saphostctrl -function ConfigureOutsideDiscovery -enable -sldusername FRN_LDDS_FRS -sldpassword xxxxxxxxxx -sldhost <hostname of FRUN system> -sldport <http/https port of FRUN system>

./saphostctrl  -function  ExecuteOutsideDiscovery -sldreg

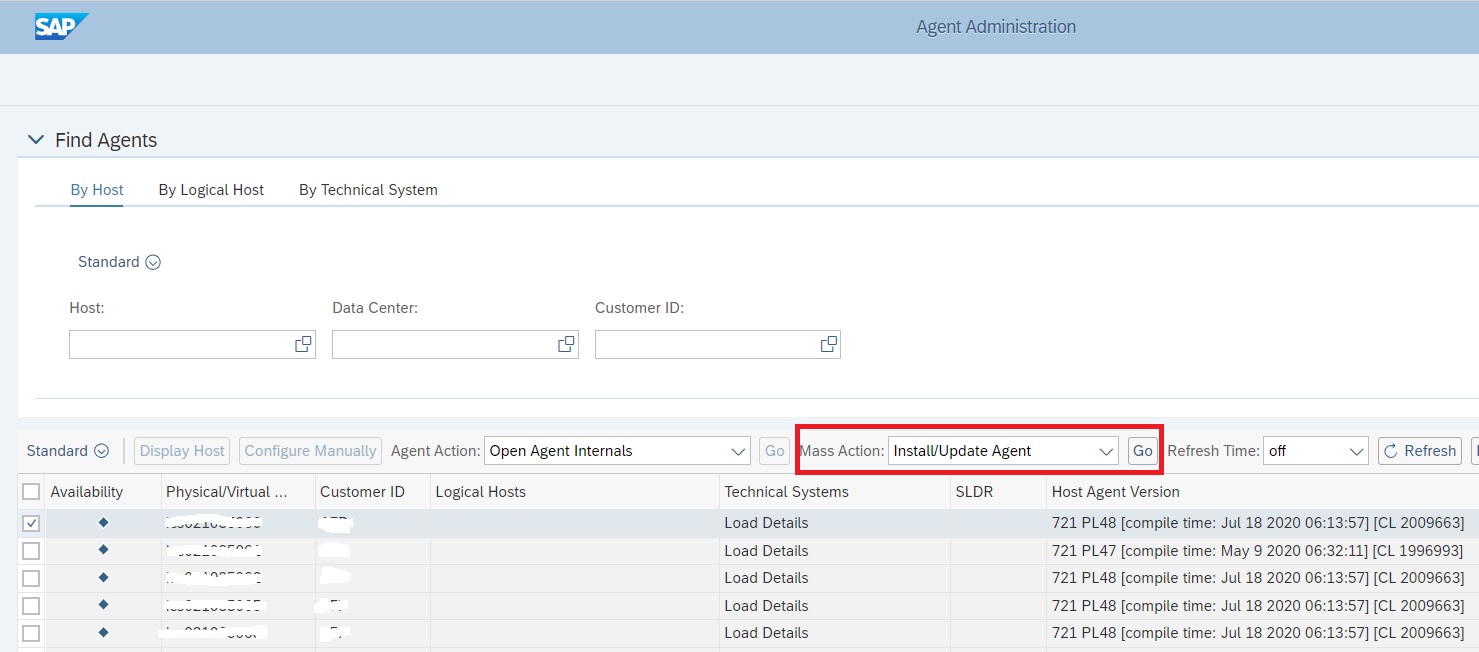
Upon executing the above commands at host level, you can see the host listed in Agent Administration of Focused Run system. Navigate to the Agent Administration app in the Infrastructure Administration block of the Focused Run launchpad.

  • In the Agent Administration App, select the host for which you want to deploy the SDA, select Install/Update Agent and click on Go.

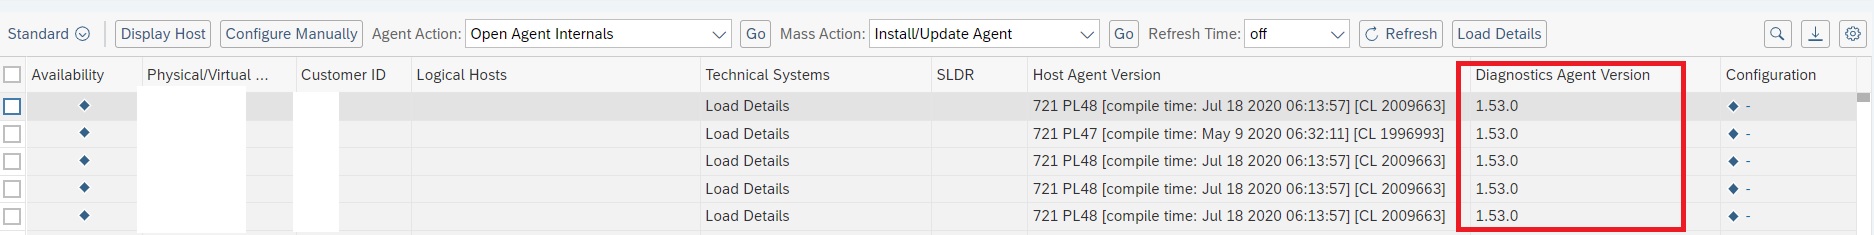
  • Upon completion of the deployment, you will see the agent version listed in the Diagnostic Agent Version column.

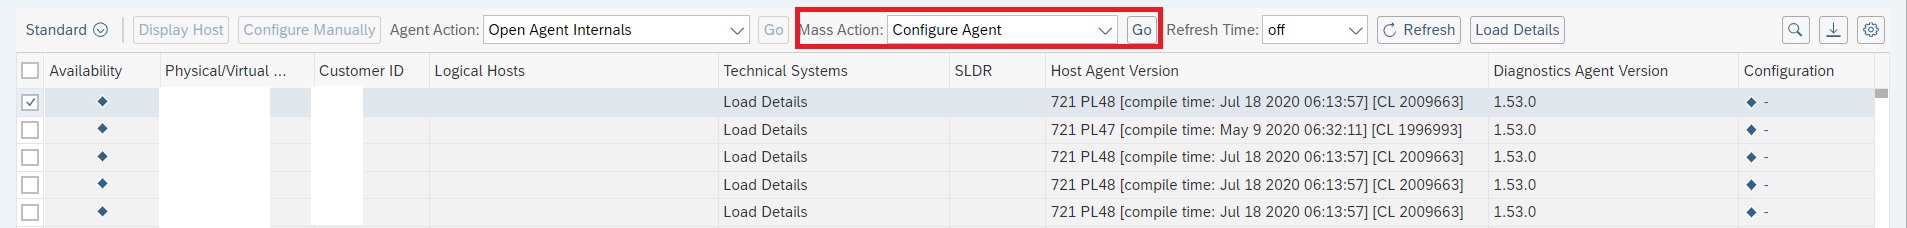
  • After SDA installation/update is successful you also need to configure the agent. This will enable the agent to receive monitoring definitions from the focused run systems as well as enable Self Monitoring of the agent.

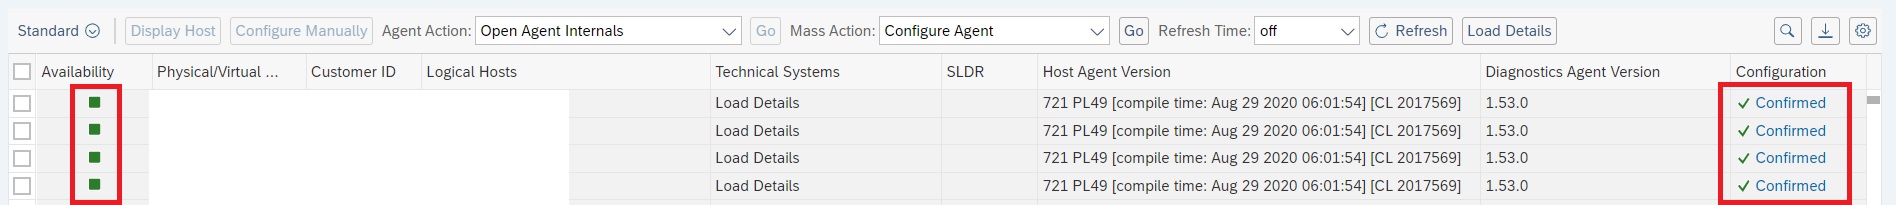
  • Upon completion of configuration, you will see green icon under availability column. Also Configuration status updated to Confirmed.

You need to follow the same steps for installing and configuring agents on all application server hosts as well as database hosts of the managed system.

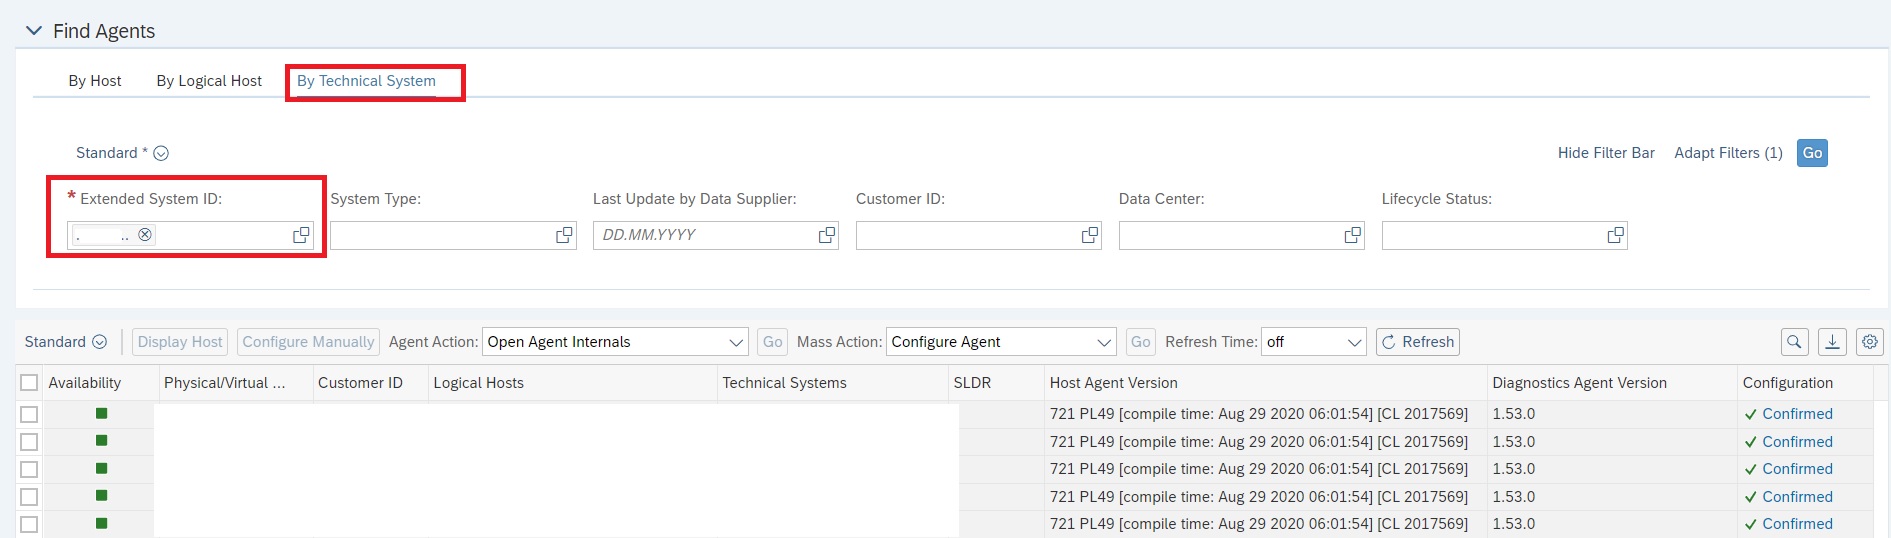
Note: You should perform the Simple System Integration of a managed system only after you install and configure agents on all its hosts. You can also list hosts and their agent status of a particular managed system in the By Technical System tab of the Agent Administration app.


Installing CA Wily Introscope BCI Adapter for SAP Java Systems…

SAP Focused Run system collects performance metrics and trace data of the SAP Netweaver Java systems through the CA Wily Introscope Byte Code Injection (BCI) Adapter.

Before you perform SSI for a SAP JAVA system you need to install and configure the BCI Adapter on each instance of the Java stack

Upon installing the BCI Adapter, SAP JAVA system reports performance and trace data to the CA Wily Enterprise Manager (Wily EM) and later on SAP Focused Run monitoring will collect the data from Wily EM for the relevant monitoring metrics.

Unlike SAP Solution Manager, for SAP Focused Run BCI Adapter setup for managed system is a completely manual step. This blog is therefore intended for the technical or SAP BASIS consultants who are responsible for installation and setup of SAP Focused Run system.

The following steps are required to install and configure the Introscope Agent

  1. Extract the Introscope Agent files
  2. Configure the Introscope Agent
  3. Introscope-enable the application code by setting Java VM parameters

Pre-Requisite

The BCI Adapter needs to connect to a Wily Enterprise Manager. You must ensure the Wily Enterprise Manager is already connected and configured for your SAP Focused Run system. In our blog we have explained how to configure Wily EM to connect to a Focused Run system.

You can also refer to this SAP Blog.

Extracting Introscope Agent Files

Extract the agent installer file ISAGNTJ5STD*.zip into the Netweaver CCMS directory, usually: :\usr\sap\ccms.

Upon extracting you will find wily directory in the :\usr\sap\ccms directory

Configuring Introscope Agent Settings

For a SAP JAVA System the agent configuration settings are found by default in the file :\usr\sap\ccms\wily\core\config\IntroscopeAgent.profile.

To configure the Introscope Agent you need to locate the following parameter and set the values.

1. introscope.agent.enterprisemanager.transport.tcp.host.DEFAULT = <IP address or hostname of the Enterprise Manager

2. introscope.agent.enterprisemanager.transport.tcp.port.DEFAULT = <port on which the Enterprise Manager listens for Agent connection. Default is 6001>

3. introscope.autoprobe.directivesFile = < DEFAULT is sap_typical.jar,sap_ep.jar,sap_ep_iviews.jar,sap_xi_typical.jar > . You may need to add further duirective jar files by adding entries to
the property, separated by comma.

Below table shows the various directive file names for various java application types.

sap_typical.jarMain instrumentation set for SAP
Netweaver. Includes support for generic
Netweaver functionality, like database,
JCO, Web Services. This jar is always
mandatory.
sap_sapvm.jarFor SAP Netweaver 7.10 and higher with
JDK5 or higher. Specific
instrumentation, e.g. memory
allocation. Do not activate for Java
1.4!
sap_bo_enterprise.jarSAP Business Objects Enterprise 3.x
instrumentation
sap_boe_webapp.jarSAP Business Objects Enterprise 4.x
instrumentation
sap_ep.jarSAP Portal specific instrumentation
sap_ep_iviews.jarAP Portal instrumentation: One node
per iView – should be preferred for
installations with many roles or when
collaboration rooms are used. Requires
sap_ep.jar
sap_ep_iviews_rolename.jarRe-activate metrics for each
iView/rolename combination. Activate
only one of these 2:
sap_ep_iviews.jar or
sap_ep_iviews_rolename.jar!
sap_duet.jarSAP Duet specific instrumentation
sap_hybris.jarInstrumentation for Hybris.
sap_smp.jarInstrumentation for SAP Mobile
Platform.
sap_omnichannelbanking.jarSMP instrumentation extension for Omni
Channel Banking
sap_xi_typical.jarDefault and mandatory instrumentation
file for PI
sap_xi_adapters.jarExtended instrumentation for PI
adapters.
sap_xi_passport.jarExtended PI instrumentation to detect
passport propagation.
sap_xi_full.jarExtended instrumentation for PI. Some
of these metrics might have a performance impact
sap_smd.jarSolution Manager self-monitoring
sap_mdm.jarSAP Master Data Management
sap_compliance.jarSAP Compliance (SAP GRC, SAP EC, SAP
REACH, …)
sap_epm.jarSAP EPM (SAP SSM, …) instrumentation
sap_retail.jarSAP Retail (SAP POS, SAP Triversity…)
sap_hilo.jarSAP Visual Intelligence instrumentation
sap_srm_crm.jarSAP SRM & SAP CRM (SAP Convergent
Charging, SAG Frictionless
e-Commerce, …)
sap_manufacturing.jarSAP Manufacturing (SAP SAP
Manufacturing Execution, SAP xMII, …)
Sap_hadoop.jarSAP Hadoop instrumentation
sap_partner.jarInstrumentation for SAP partner
products. See SAP Note 1852015.
sap_tomcat_typical.jarDefault and mandatory instrumentation
file for Apache Tomcat
sap_tomcat_full.jarExtended instrumentation for Apache
Tomcat
sap_websphere_typical.jarDefault and mandatory instrumentation
file for IBM WebSphere Application
Servers
sap_websphere_full.jarExtended instrumentation for IBM
WebSphere Application Servers
sap_weblogic_typical.jarDefault and mandatory instrumentation
file for Oracle WebLogic Server
sap_cem_integration.jarInstrumentation for integration with CA
product CEM (only for SED)

Activating the Agent: Set Java VM Parameters

You have to add Java VM options to enable the agent. Typically, you will only want to activate the agent on the SAP J2EE server nodes, not on dispatchers.

You need to set the following parameters for the Java VM.

  1. Run the SAP J2EE Configtool.
  2. Navigate to Instance/VM Parameters/System and enter the following new parameters
NameValue
com.wily.introscope.agent.agentName${SYSTEM_NAME}${INSTANCE_NAME}$[elem/Name]
com.wily.introscope.agentProfile<drive>:/usr/sap/ccms/wily/core/config/ IntroscopeAgent.profile

3. Navigate to Instance/VM Parameters/Additional and enter the following new java parameter

-javaagent:/usr/sap/ccms/wily/Agent.jar

4. Save and Repeat steps 1 to 3 for all instances of the SAP JAVA system.

5. Restart the SAP instances.

To verify that Config tool changes were made, open the file: :\usr\sap\\\j2ee\cluster\instance.properties and check for a line beginning with ID.JavaParameters, and see if it contains the lines you entered in the step above.

Simple System Integration of SAP JAVA Systems…

For activating SAP Focused RUN monitoring functionalities on an SAP JAVA system you need to perform Simple System Integration of SAP JAVA Systems.

In our previous post we explained how to perform Simple System Integration (SSI) of ABAP systems. Performing SSI for SAP JAVA systems is similar to that of ABAP systems.

You need to ensure the below pre-requisites are met which are same as the pre-requisite for for performing SSI of ABAP systems.

Focused Run Prerequisites

Before you can perform SSI for any managed system, you need to ensure the basic framework setup prerequisites are met. For this ensure all activities mentioned in section 5.2.4 Preparing Simple System Integration of the SAP Focused Run master guide.

Managed System Prerequisites

1.) Simple Diagnostics Agent deployed on all hosts of Java Managed system.

In this blog we have explained the steps for deploying SDAs on managed systems.

You can also refer to the SAP documentation here.

2.) JAVA Managed system is registered in LMDB and Data Supplier Completeness check is green.

In our future blogs we will explain how to register various types of managed systems into LMDB. And for troubleshooting in case Data Supplier Completeness check is not green, you can follow SAP’s documentation here.

3.) Database preparation is complete.

You need to perform certain database specific pre-requisite configurations in order to perform the integration of the underlying database of the managed system. In this SAP documentation SAP has outlined the steps for various types of databases.

4.) A system user is created in the managed system. This user will be required to authenticate local HTTP and P4 calls by the simple Diagnostics Agent for data collection. We refer to this user as FRUN user.

You can refer to this SAP documentation to get the list of roles that needs to be assigned to this FRUN user.

Additional Pre-requisite for JAVA Managed Systems.

Other than the above mentioned pre-requisites, for JAVA systems, you also need to Install BCI Adapter ( CA Introscope Wily Adapter) to collect performance metrics and trace data of the NW Java.

In this blog we explain how to install and configure the BCI Adapter for Java systems.

You can also refer to section SAP NetWeaver Application Server Java in this SAP Focused Run expert portal blog for managed system preparation.

Performing SSI of JAVA managed system

For executing SSI navigate to the SSI app in the Infrastructure Administration section of the Focused Run launchpad.

In the SSI app scope selection area you can enter the managed system extended SID individually or you can select a more generic filter to list multiple systems.

SSI is performed in 2 steps for JAVA managed systems.

Step 1: Edit Configuration

In this step you provide the credentials for the SDA agent to connect to JAVA Managed System.

  1. The FRUN User and password you created as a pre-requisite
  2. The HTTP and P4 ports for connecting to the Java managed system.

Step 2: Configure Automatically

In this step, select the JAVA managed system for which you want to perform the SSI and click on the button Configure Automatically.

Note: When you perform SSI for the main technical system , it will automatically perform the SSI for all the underlying components in the system hierarchy. That is, if you perform SSI for Application Server JAVA, it will also perform the SSI for the system’s database. However the if you perform first the SSI of the system’s database it will not automatically perform the SSI of the main technical system and you will again have to perform the SSI for the technical system again separately.

Simple System Integration of SAP ABAP Systems…

Simple System Integration (SSI) of SAP ABAP Systems made easy.

For activating SAP Focused RUN monitoring functionalities on an SAP ABAP system you need to perform Simple System Integration of SAP ABAP Systems

Simple System Integration, or shortly known as SSI, is a guided procedure similar to the managed system setup in SAP Solution Manager. SSI is used for integrating a managed system to SAP Focused Run system. Unlike SAP Solution Manager managed system setup, SSI is fully automatic and has no manual steps.

In order to ensure SSI is completed successfully we need to ensure all -prerequisites are met.

Focused Run Prerequisites

Before you can perform SSI for any managed system, you need to ensure the basic framework setup prerequisites are met. For this ensure all activities mentioned in section 5.2.4 Preparing Simple System Integration of the SAP Focused Run master guide.

Managed System Prerequisites

1.) Simple Diagnostics Agent deployed on all hosts of ABAP Managed system.

In this blog we have explained the steps for deploying SDAs on managed systems.

You can also refer the SAP documentation here.

2.) ABAP Managed system is registered in LMDB and Data Supplier Completeness check is green.

In our future blogs we will explain how to register various types of managed systems into LMDB. And for troubleshooting in case Data Supplier Completeness check is not green, you can follow SAP’s documentation here.

3.) Database preparation is complete.

You need to perform certain database specific pre-requisite configurations in order to perform the integration of the underlying database of the managed system. In this SAP documentation SAP has outlined the steps for various types of databases.

4.) A system user is created in the managed system production/main client. This user will be required for RFC connection to the managed system. We refer to this user as FRUN user.

You can refer to this SAP documentation to get the list of roles that needs to be assigned to this FRUN user.

Performing SSI of ABAP managed system

For executing SSI navigate to the SSI app in the Infrastructure Administration section of the Focused Run launchpad.

In the SSI app scope selection area you can enter the managed system extended SID individually or you can select a more generic filter to list multiple systems.

SSI is performed in 2 steps for ABAP systems.

Step 1: Edit Configuration

For ABAP systems in this step you need to enter the details of the FRUN user that you created as a prerequisite.

For this select the row for the ABAP system and click on the Edit Configuration button as shown in below screenshot. Next in the pop-up enter the credentials of the FRUN user.

Step 2: Configure Automatically

In this step, select the ABAP managed system for which you want to perform the SSI and click on the button Configure Automatically.

Note: When you perform SSI for the main technical system , it will automatically perform the SSI for all the underlying components in the system hierarchy. That is, if you perform SSI for Application Server ABAP, it will also perform the SSI for the system’s database. However the if you perform first the SSI of the system’s database it will not automatically perform the SSI of the main technical system and you will again have to perform the SSI for the technical system again separately.

Mass SSI

Focused Run also provides even higher level of automation by allowing to perform SSI at a time for multiple systems. Mass update is explained in this blog.

Once the SSI automatic activities finish, you can check the logs of the SSI automation steps in the Log Messages area.

In our future blog we will explain details of each step in the Configure Automatically guided procedure of SSI and how to troubleshoot in case of error.

In our future blogs we will also explain how to perform SSI for various system types.

OSS notes

Relevant OSS notes to check.

Notes for the managed system:

Automatic eMail for Security Validation of SAP Systems…

In a similar fashion to setting up email notification for system health check reports, you can also setup Automatic eMail for Security Validation of SAP Systems. For this you need a guided procedure that can run a security validation policy instead of running the system health check.

In our previous blog we have explained how you can setup the Security Validation policy.

Follow the following steps to create the guided procedure that can automatically execute the policy check on your SAP systems.

Creating Guided Procedure for Configuration and Security Analytics

For creating the guided procedure navigate to the Guided Procedures app in the Focused Run launch pad.

In the Guided Procedures app navigate to the Catalog page and click on the sign to create a new Guided Procedure.

In the pop-up provide a name and description for the guided procedure and click on Create.

Back in the catalog page, click on the newly created guided procedure name to open it in edit mode.

The guided procedure will now open in a new tab in the browser. Click on the edit button to start editing the guided procedure.

Now you need to add a automatic step to the guided procedure that will execute the security validation policy. For this, in the Step Details section, enter a step name and description.

Navigate to Step Content block. In the Automatic Activities tab and click on New.

In the pop-up, select the option “Select a Plugin” and select the plugin Configuration & Security Analytics

After selecting the plugin, expand the attribute section and provide the CSA policy name and click on OK.

Back in the main screen save and activate the Guided procedure.

Now you can use this guided procedure to schedule an automatic execution to send an email report. You can do it in a similar fashion to sending email for System Health check report as explained here.

For more details on what all you can do with guided procedures, refer to the SAP Focused Run Expert Portal.

Setting up automatic eMail notification for System Health Check Reports…

In our previous blog we have shown how you can use Focused Run Guided Procedure to perform System Health Check for ABAP systems.

This blog explains how you can setup periodic email notification to report the result of System Health Check of ABAP systems.

SAP Focused Run provides a mechanism to periodically schedule automatic execution of guided procedures. With this you can optionally enable email notification. This way we can schedule periodic run of System Health Check guided procedure. From each automatic execution of the guided procedure, an email will be sent with the status of the system health check.

Scheduling Guided Procedures

You can schedule guided procedures using the Guided Procedures app in Focused Run launch pad .

In the Guided Procedures app navigation block click on Guided Procedure Planning.

In the Guided Procedure Planning area, click on the “+” sign to create a new Plan and follow the steps to create a plan.

Step 1: Select guided procedure System Health Check for ABAP Systems.

Step 2: Scope Selection: Select the systems (Ext. System ID) for which you want to run the system health check.

Step 3: Processing Parameters: Select for one time execution or periodic execution.

Step 4: Notification Settings: In this step provide the following details for setting up the email layout for sending the email notification for the guided procedure execution result.

  1. Email Customization (Optional) : Select either of the two options available for this field. With this selection we use the pre-built/inbuilt SAP eMail template provided by SAP.
  2. To: Provide the Recipient List to which you want to send the mail to (You can’t provide direct mail IDs here).
  3. Type: Select Single or Aggregated. The single option sends individual mails for every single system selected in the scope whereas the Aggregated option send an aggregated mail including all systems selected in the scope.

Finally you can click on the Create button as shown below to schedule your guided procedure.

Once scheduled, you can navigate back to the Guided Procedure Planning home screen to see the list of scheduled guided procedures and their current execution status.

Below is sample email for your reference.

Operation Dashboard in Focused Run 3.0…

With Focused Run 3.0 a new dashboarding framework available called Operation Dashboard. This enhancement comes under the Advanced Analytics & Intelligence (AAI) functionality of Focused Run.

With Operation Dashboard you can configure a 3 level drilldown dashboard to track the current situation of monitoring and alerting in the areas of System Monitoring and Real User Monitoring.

Currently you can track metrics and alerts only from areas of System Monitoring and Real User Monitoring.

Views in Operations Dashboard

Operation Dashboard provides 3 types of view to provide a consolidated view of the current status of monitoring and alerting.

  1. Analytics Map: Consolidate monitors to a specific region on the world map. The region is colour coded to the aggregated monitoring status of the monitors included. Aggregation uses worst case rule i.e The colour of the region is green only if all the involved monitors are in green.

2. Tile View: Shows the consolidated monitoring status of a specific Scenario/System/Managed Object. Aggregation uses worst case rule.

3. List Deatils View: Shows the list of involved monitors.

The above three views are linked automatically to eachother to enable the drill down functionality. That is, if you click on a perticular region which is rated in the world map view, you will get the correspoding systems/componenets for that region in the tiles view and the corresponding monitoring metrics in the list view.

Operation Dashboard Setup

To access Operations Dashboards click on Operations Dasboard tile under Advanced Analytics & Intelligence section in the Focused Run Launchpad.

Step 1: Create a new Operation Dashboard

Create a new Operations Dashboard by clicking on Add Custom Page in the navigation pannel of Operations Dashboard app.

Step 2: Name your dashboard

When you create a new dashboard, the dashboard setup are will appear on the right hand side of your screen. Click on the rename button as shown below.

Step3: Configure layout

You can configure the layout of your dashboard in a Grid format. Each grid in the layout will hold a view of your dashboard. As we have 3 types of views you can form a layout of 3 grids. To configure the grid layout click on the Grid button in the setup area – View Management section

In the pop-up you can drag and drop to form a Grid layout

Step4: Select monitoring content

To customize your Operations Dashboard, you first need to select the monitoring content as the source of data from either of System Monitoring or Real User Monitoring or both. For this navigate to Page Personalization area.

In the Default Settings area you can

  1. Select or deselect monitoring area (System Monitoring/ Real User Monitoring)
  2. Select or deselect metric or alerts
  3. Select or deselect category (Availability/Exception/Performance)
  4. Alert Severity ( Alerts of same or more severity are included in the scope of the dashboard)

Step 5: Create scenarios

In Order to link systems/ components to a particular region in the world map you need to create scenarios and link them to specific regions in the world map.

In this step you create named Scenarios or Regions to which you can later on tag your monitors. For this navigate to the Content Settings Area , Custom Scenarios Settings. To create a new scenario click on the + sign.

In the pop-up you can directly enter the country name or code or you can click on search to search for your respective country/region and it’s code.

You can see the list of all scenarios you created in the Custom Scenarios section.

Step 6: Add monitors and tag monitors

In this step you add systems/components and tag them to specific scenarios you created in the previous step.

For this navigate to Content Settings area, Data Source Settings and click on the + sign.

In the pop-up screen select the system/component you want to add and accept to continue.

Now back in the Data Sources list select the scenario for the system/component you just added.

Now your Operations Dashboard is ready.

  1. In View 1: World Map, the regions are coded as per the aggregated rating of all systems/componenets tagged to a specific scenario in the Data Sources settings in Step 6.
  2. In View 2: Tiles View, by default shows the Region/scenarios aggregated rating in tiles. In this view you can drill down to aggregated rating for each system/Compoenent/monitor by simply clicking on the tile. (For instance below shows the Tile view of the systems in Germany shown in the image 2 of this blog.

3. In View 3: the List View, shows the monitors for all the system/componenet shown in Tiles view, that is, if you drill down in Tiles View, accordingly filtered monitors are shown in Tiles view.

Activating early watch report (EWA) for JAVA managed systems in SAP Focused Run…

EWAs in Focused Run

In a SAP Focused Run environment, EWAs are not generated on the Focused Run system, but rather at SAP side. Only data from managed systems is collected at the Focused Run side and then forwarded to SAP. And then the EWA is then available in Service Messages at SAP. For accessing the EWAs you can navigate from the launchpad using the EWA Workspace tile. For more details click here.

In the previous blog, it is explained how to setup EWA reporting for SAP ABAP managed systems that connect to SAP Focused Run system. In this blog it will be explained how EWA can be setup for SAP Java based managed systems.

Activating EWA for JAVA Systems

Goto Launchpad and click on the SAP Early Watch Alert Status tile.

In the EWA Status Application first you need to select scope to include all java systems as shown below.

To activate EWA, change under Active column from NO to YES for the respective system.

After Activation status changes as shown below. Refresh after 5 minutes to ensure that the first circle is Green.

To Ensure the EWA activation is properly completed, goto transaction SDCCN on the FRUN system and ensure that the EWA session for respective Java system is registered.

When EWA Data is sent to FRUN and processed, you will see all circles in Green for the respective JAVA system as shown below.

Data retention

The EWA data is kept for 1 year. To change this, read the blog on housekeeping settings.

OSS notes

Relevant OSS notes:

Guided answers

Guided answers from SAP:

Focused Run: EarlyWatch Alert Troubleshooting Guide – Missing application related data in Non-ABAP EWA forwarded from FRUN

Also check the general guided answers for ABAP.

Activating early watch report (EWA) for ABAP managed systems in SAP Focused Run…

EWAs in Focused Run

When you have performed Simple System Integration (SSI) for the connected managed system on the Focused Run system, by default SSI itself activates the SAP early watch (EWA) reporting for a managed system, provided the managed system has IT Admin Role defined as Production system. For more information on how to set IT Admin Role read this blog.

For non productive systems you can also manually activate EWA.

Additionally for all ABAP systems (Production and Non-production), you will need to configure SDCCN in managed system so that EWA data is sent to the Focused Run system.

Note: In an Focused Run environment, EWAs are not generated on the Focused Run system, but rather at SAP side. Only data is collected at the Focused Run side and the EWA is then available in Service Messages at SAP. For accessing the EWAs you can navigate from the launchpad using the EWA Workspace tile. For more details click here or here.

Steps for activating EWA for ABAP Systems

STEP 1: Activate EWA on Focused run System

Goto Launchpad and click on the SAP Early Watch Alert Status tile.

In the EWA Status Application first you need to select scope to include all ABAP systems as shown below.

To activate EWA, change under Active column from NO to YES for the respective system.

After Activation status changes as shown below. Refresh after 5 minutes to ensure that the first circle is Green.

STEP 2: Configure SDCCN on Managed System

Once EWA session for an ABAP system is activated, the SDCCN of the respective ABAP system must read the EWA session data from Focused Run system. For more details read OSS note 2359359 – SDCC Enhancement for ABAP Systems Connecting to Focused Run.

  1. For this first create a HTTP destination from the managed ABAP system to Focused Run system using report /BDL/CREATE_HTTP . Provide the following input and execute the report.
    1. HTTP Destination: By default, it shows as SDCC_SID, you’d better change the SID to the real target system id. This is the suggestion, but you can specify any name if you want.
    2. SSL Status(HTTPS): This checkbox means whether you want to use HTTPS for the communication. By default, it will only use HTTP.
    3. Path Prefix: By default, the service used by SDCCN is /sap/bc/sdf/sdcc/. You cannot change this unless you mark the checkbox “Force Mode”.
    4. User Name: FRN_EWA_<FRUN SID> which you have created during the initial setup of FRUN system.
  2. Run report /BDL/CONFIGURE_SDCCN_HTTP to activate SDCCN. Provide the HTTP destination that created in step 2 and change the job user. Only the first check box must be  selected (only on FRUN 1.0 both check boxes must be selected).
    1. The job user must have authorization SAP_SDCCN_ALL

After running this report with above parameters, the SDCC_OSS RFC will be removed from RFC destinations, and the new HTTP destination will be added to RFC destinations.

STEP 3: Create Maintenance Package on SDCCN in Managed System

Now you need to create a maintenance package in transaction SDCCN of managed system.

To Ensure the EWA activation is properly completed, goto transaction SDCCN on the managed system and ensure that the EWA sessions for the managed system is registered.

When EWA Data is sent to Focused Run and processed at the SAP side, you will see all circles in Green for the respective ABAP system as shown below.

EWA troubleshooting

In case of issues you can follow the link to the troubleshooting guide of SAP:

Data retention

The EWA data is kept for 1 year. To change this, read the blog on housekeeping settings.

Relevant OSS notes

OSS notes:

Guided answers

SAP guided answers:

SAP Focused Run Rule Based Template Assignment…

Introduction

When we perform Simple System Integration (SSI) on a managed system , it automatically activates the SAP default monitoring template on the managed system. However, in most of the SAP Focused Run (FRUN) implementation scenarios, we create customer defined monitoring templates (Custom Templates), which we then manually assign/activate on the managed system.

Rule Based Template Assignment is a feature in FRUN by which we can define based on managed system category which custom monitoring template to be assigned and activated directly when we perform SSI on the managed system.

Defining Rule Based Template Assignment

For Rule Based Template Assignment navigate to the FIORI tile Individual Maintenance in the Advanced System Management section of FIORI launch-pad.

In the Individual Maintenance App navigate to the Rule Maintenance by clicking on the button as shown below.

In the Rule Rule Based Assignment Screen, on the left hand side panel, select the specific Managed Object type for which you want to define the Rule Based Template Assignment.

In this blog we take the example of defining a Rule Based Template Assignment for managed system of type SAP ABAP BASIS 7.10 and higher and specify the custom template for System Level monitoring template. So we select Technical Systems upon which the right side panel now gives a list of all product types. In the right side panel we scroll down and select SAP ABAP BASIS 7.10 and higher.

Now we need to define the Rule based on which the Custom Defined Template to be defined. In this blog we take the example that we have defined 2 custom templates one for Production Systems and one for Non Production Systems. So we will need to define rule to assign template based on filters System Type ABAP and IT Admin role defined in LMDB. For more information on this function read this blog.

In the subsequent screen select Maintain Rules.

In the Maintain Rule screen we select the following filters.

Name your Rule and Save.

Similarly you can create Rule ABAP Non production, just ensure to select the following IT Admin Roles.

Now back in the main screen select the Rule you created from the drop down.

And for Template select the custom template you want to select for the assignment.

Add the assignment.

Now click in Continue with Next Step button till you come to the Reconfiguration tab and then close. This will allow you to save your Rule Assignment.

Once you have assigned the ABAP Production and ABAP Non production rules in the main screen you will see the following assignments listed.

After the assignments done, the next time SSI performed on any ABAP system will take up the custom monitoring template as defined in these rules.

In Individual Maintenance system list you can also see whether current assignment is SAP default or Rule Based Template Assignment.