Alerting on Critical Metrics Turning Grey…

It is essential to activate alerting on critical metrics turning grey in order to avoid missing critical issue not getting detected by Focused Run.

Since SAP Focused Run 3.0 FP2 , a new metric has been added to the self monitoring template in System Monitoring, the Grey Metrics metric measure what percentage of critical metrics in Grey.

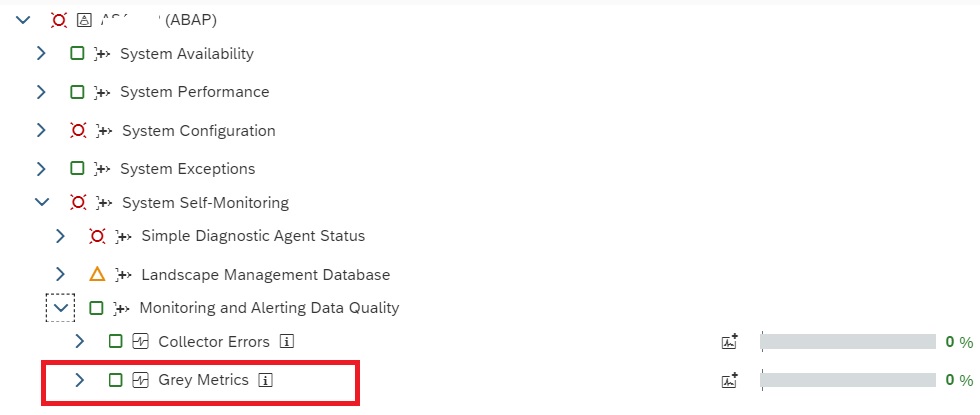
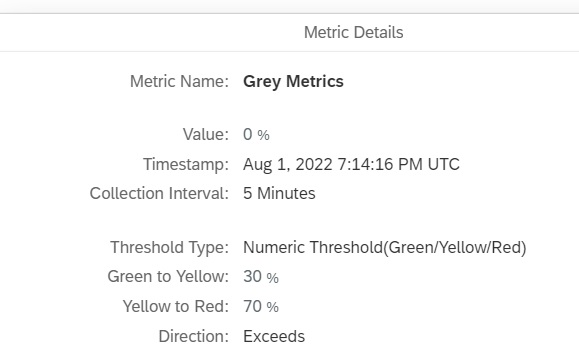
This metric by default uses threshold 30% for Yellow and 70% for Red rating. You can change this threshold to show red if value crosses more than 1% so that if there are any critical metric that is in grey then alert is raised.

Note: This metric considers only those metrics which are marked as critical in Self Monitoring app. The percentage is calculated based on how many metrics out of the metrics designated as critical metrics in Self Monitoring app are in Grey.

To designate a metric as critical metric navigate to Self Monitoring App in Focused Run launchpad –> Infrastructure Administration.

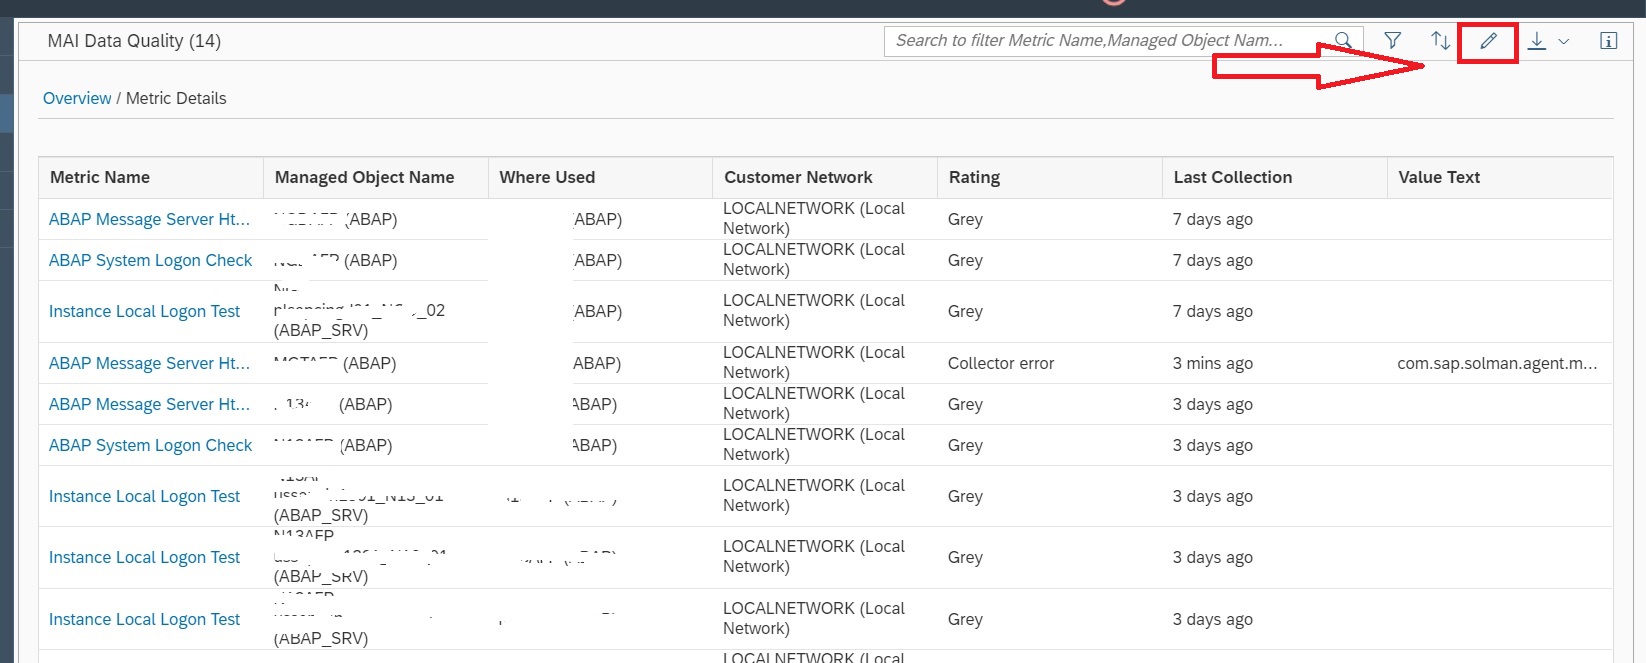
In the Self Monitoring app navigate to MAI Data Quality.

In the Overview screen select the Managed System type to go to its details screen.

In the Details page it shows list of systems with their critical metrics that are in grey. To modify the list of designated critical metrics click on the chnage button.

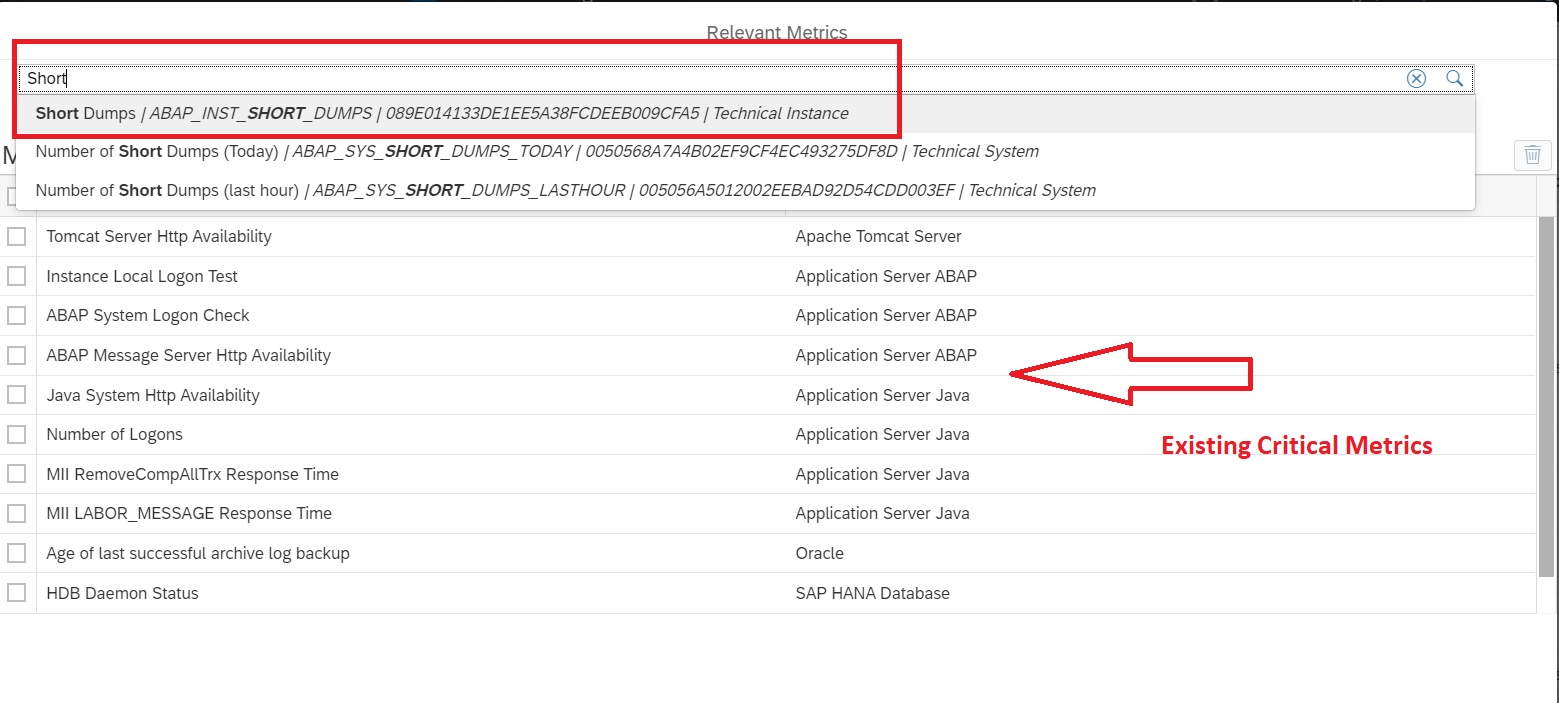
In the new popup use the text search button to enter the text of the metric you want to add to the list.

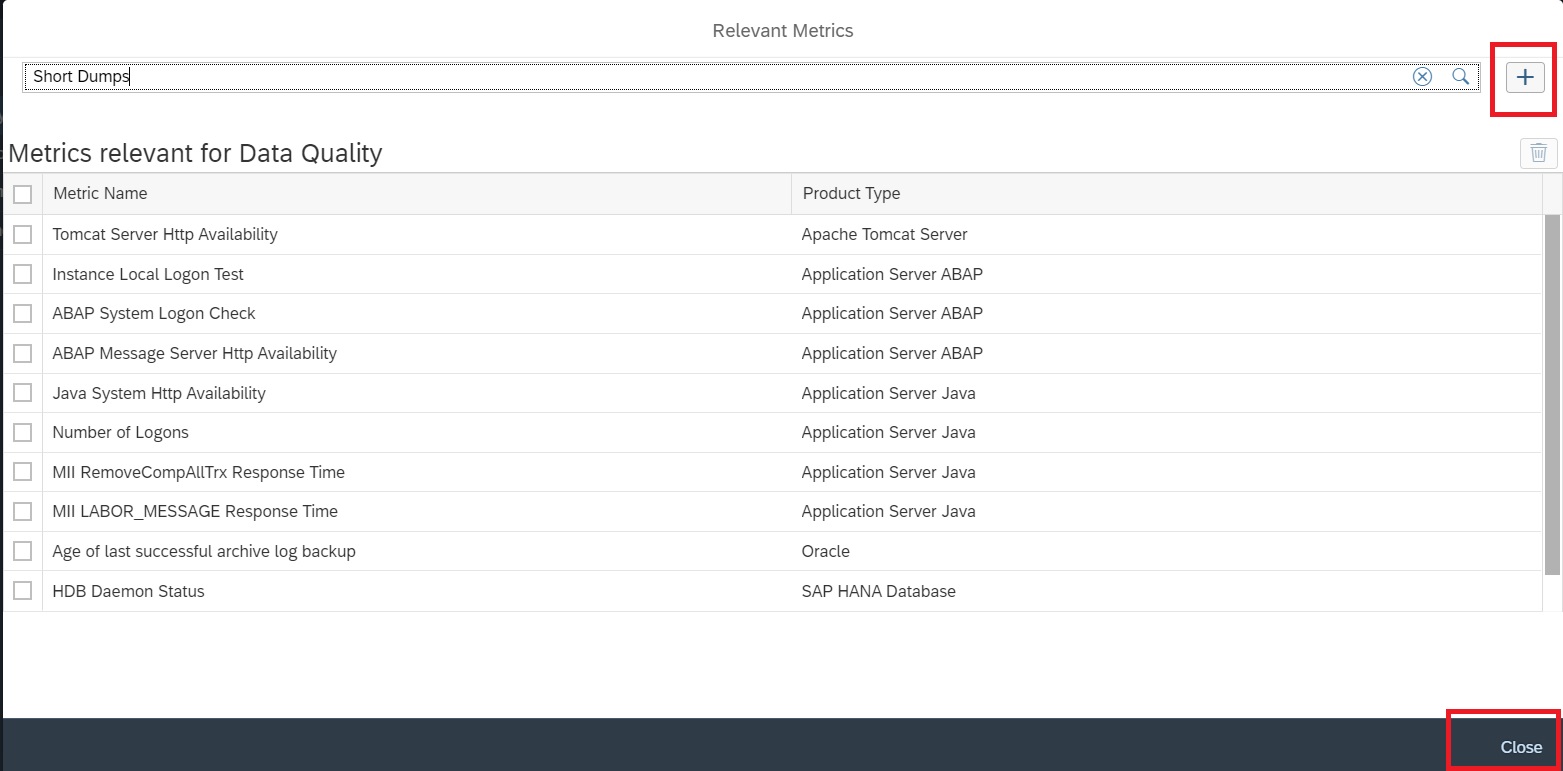
Finally click on the “+” button and then click on close to save the added metric in the critical metric list.

Now the added metric will be considered as critical metric while calculating % of Grey Metrics.

Identifying all grey metric in System Monitoring…

In SAP Focused Run there is no standard mechanism to identify and display all grey metrics in System Monitoring, a grey metric can cause critical situations not being captured and alerted in monitoring hence we need to monitor such grey metrics.

In this blog we explain how you can list all the grey metrics by directly reading from database tables that store the monitoring data.

Focused Run system monitoring metric aggregate data is stored in table AEM_METRIC_AGGR. We can filter on metric status = Grey to see the list of grey metrics.

Open the table in transaction SE16:

Increase the width and no of hits and click on execute

Now you have all the data that you can export to an excel sheet. For this select the following menu option.

Select file type as Text with Tabs.

Provide the path and filename to save the file and then click on Generate button.

Now open the .txt file in MS Excel.

In the Home tab select option for filtering as shown below

Now set the following filter for the column LAST_RAT

Now you will get the list of all grey metrics as shown below.

Note: The Context_ID value will give you the ID of the managed object, Metrtric_type_ID will give you the ID of the metric name and the Last_text will give you the return text of the last data collection which will give you the reason for grey metric.

In order to get the managed object name and metric type you can use the following in transaction MAI_TOOLS –> Metric Event Alert Details.

In the selection screen for Managed Object ID enter the Context ID from the excel and for Metric Type ID enter the same from the excel. Also select the checkboxes as shown below and execute.

Now you will get the info on the Template as well as the Metric name which is currently in grey.

SAP instructions

You can also check the instructions from SAP in OSS note 2859574 – How to list all current Grey Metrics in FRUN.

Alerting on important grey metrics

If a critical metric turns grey (meaning it can be good, or bad), you can set a specific alert when this happens. For example Oracle system in stalled mode might turn grey in stead of red. In this case grey is the same as red: system will not work.

For setup instructions: read this dedicated blog.