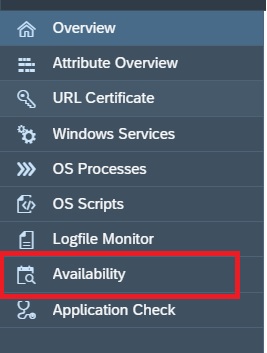
Health monitoring can be used to monitor special use cases:
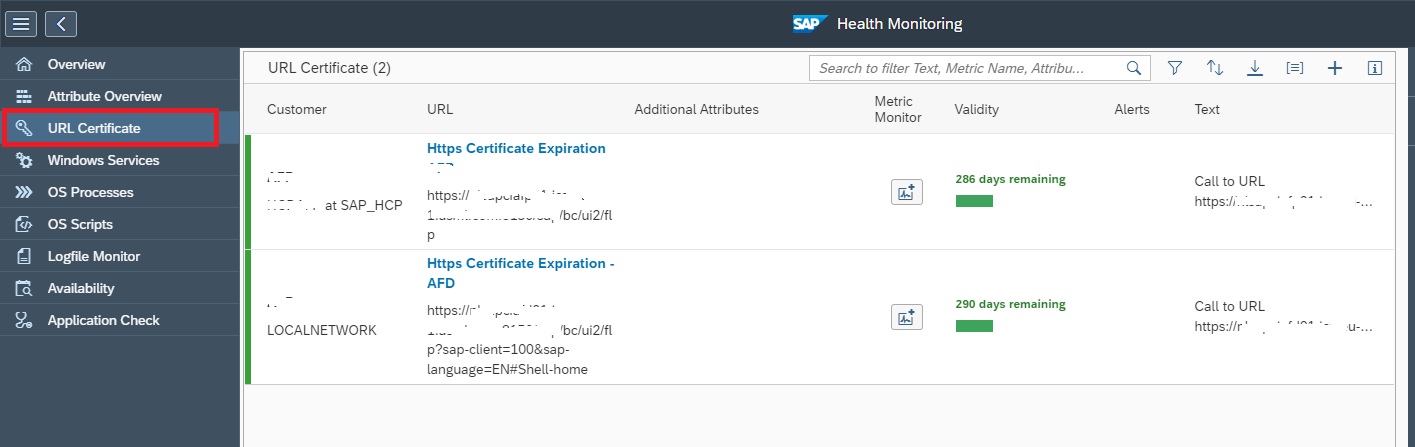
- SLL certificate monitoring
- Windows service monitoring
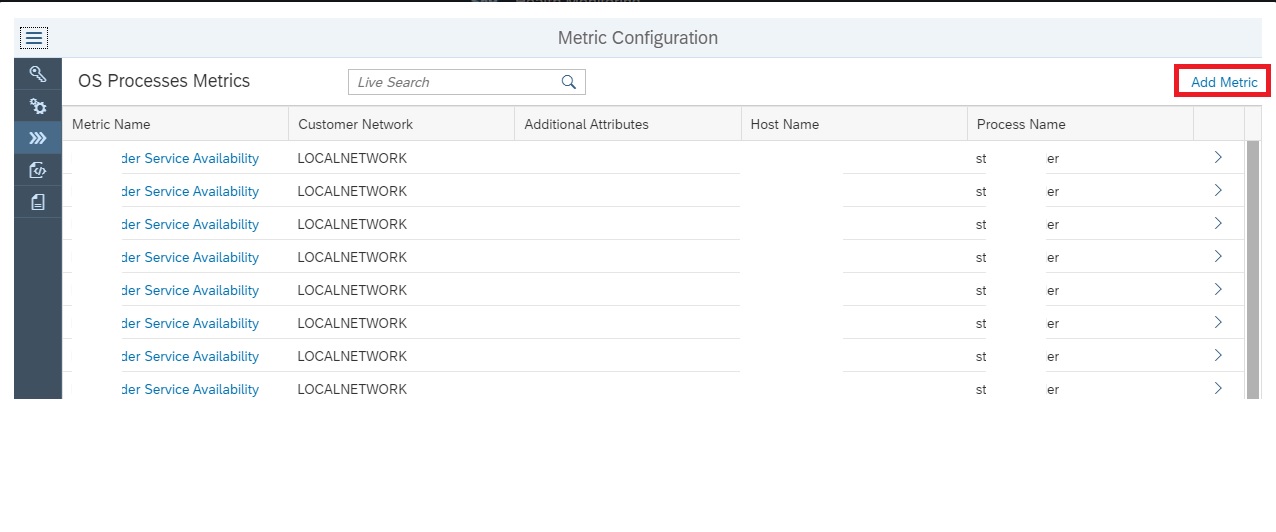
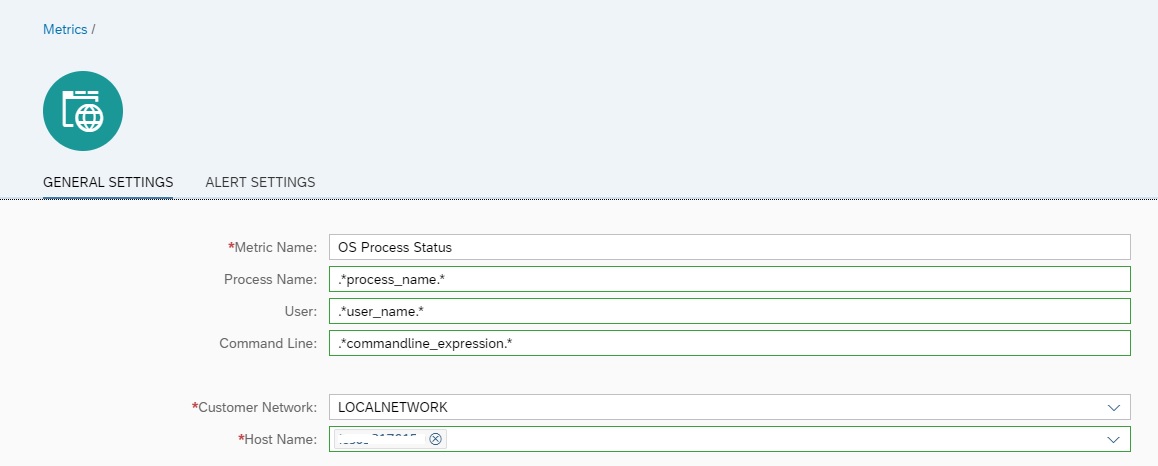
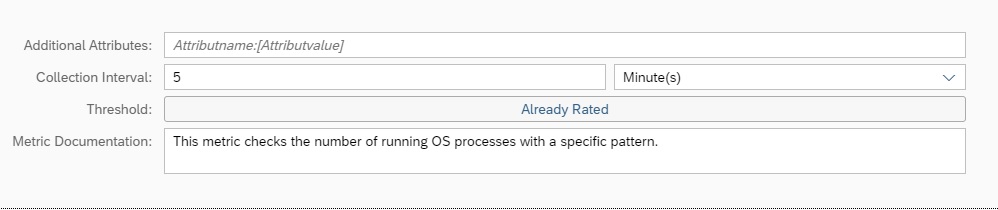
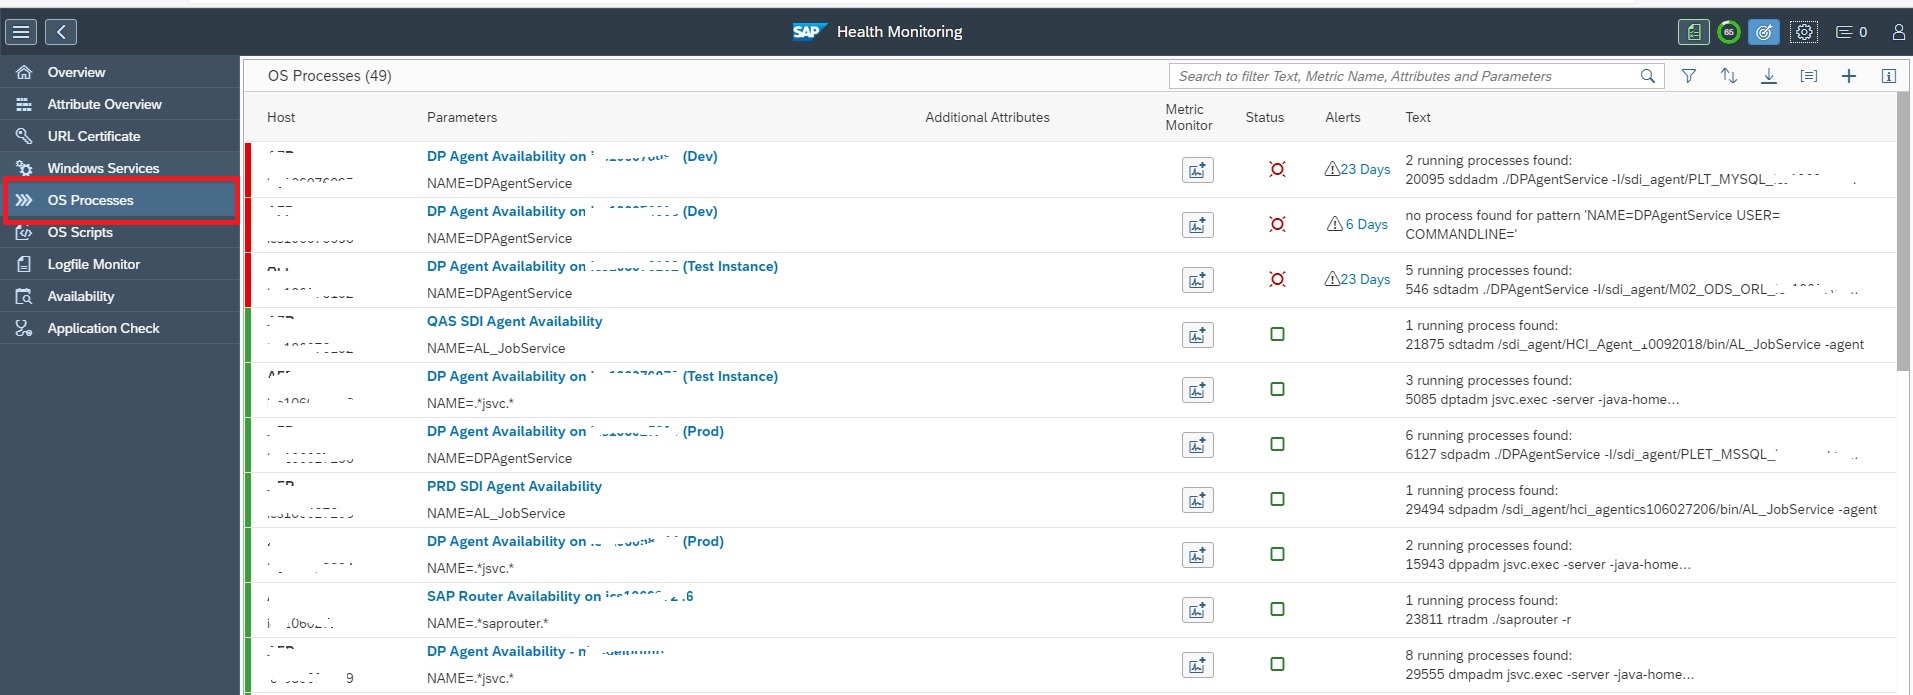
- OS process monitoring
- OS scripts
- Logfile monitoring
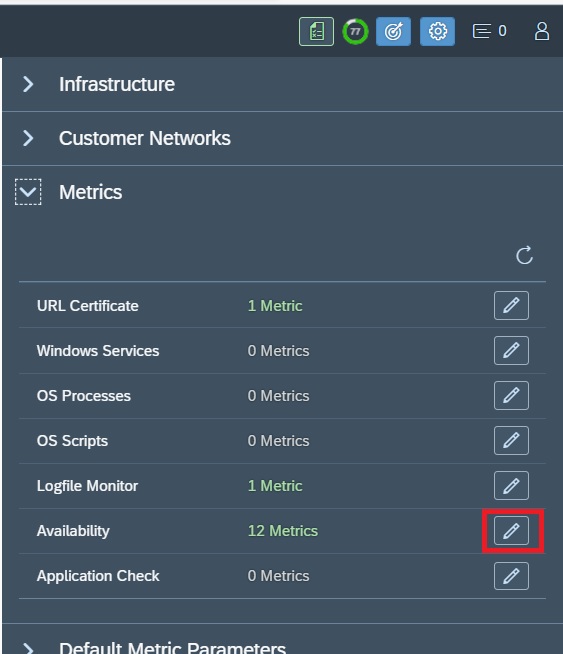
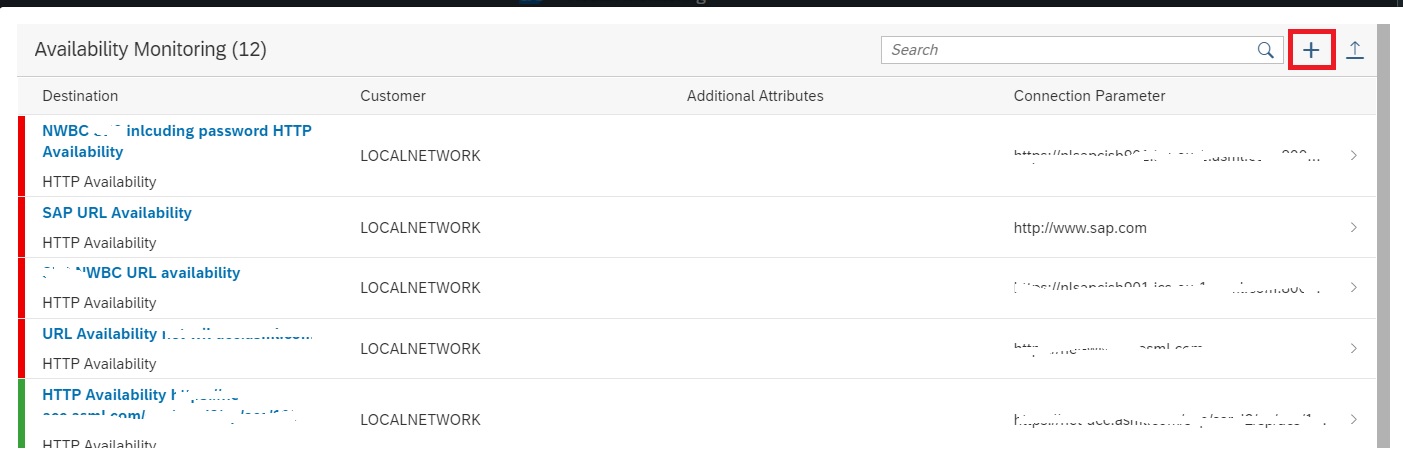
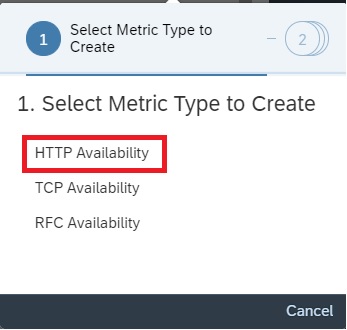
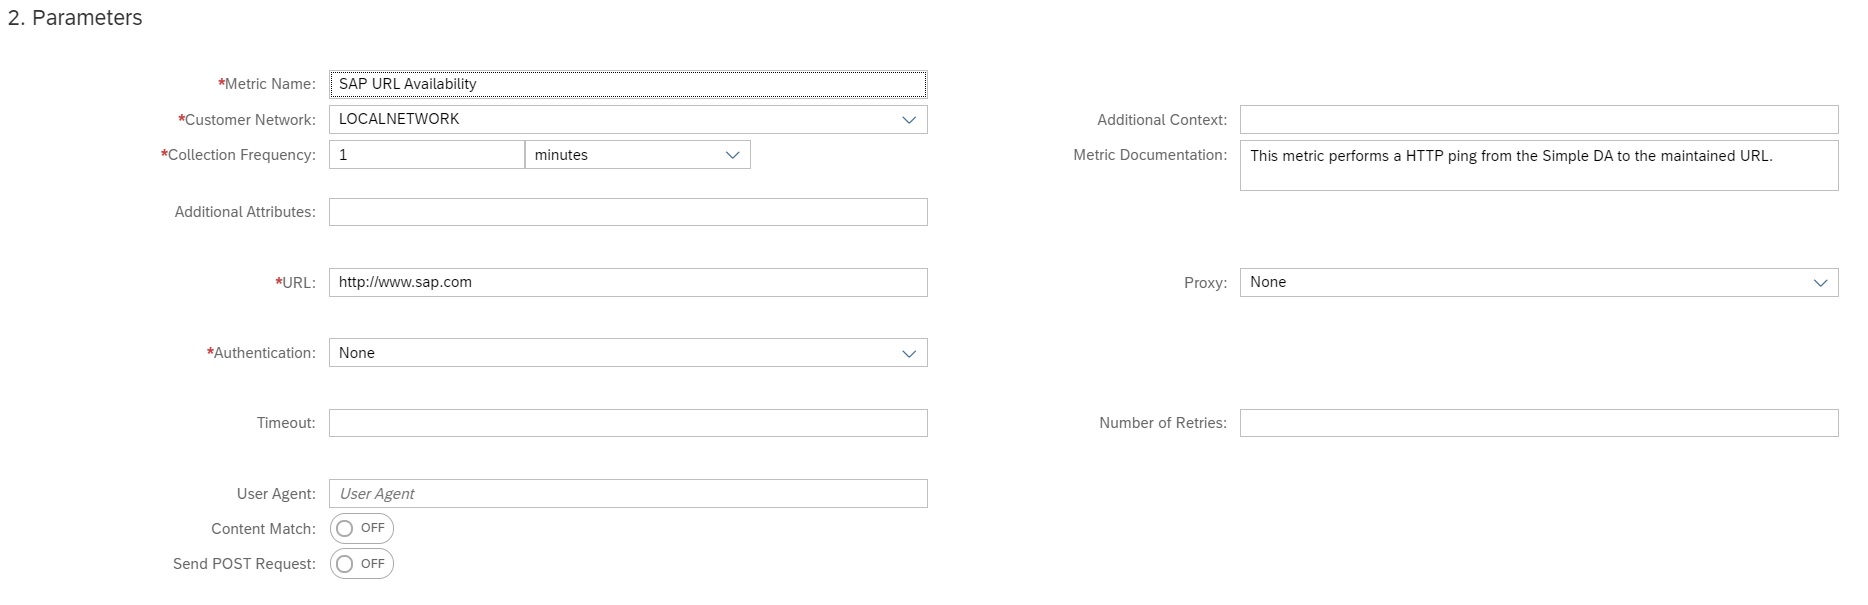
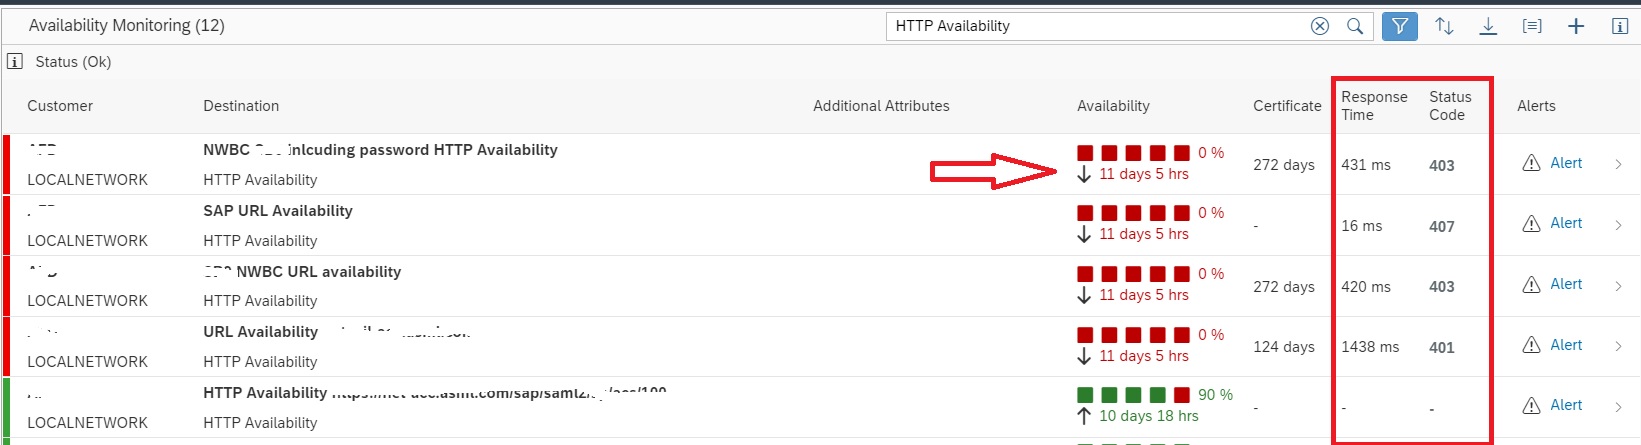
- URL availability monitoring
Health monitoring
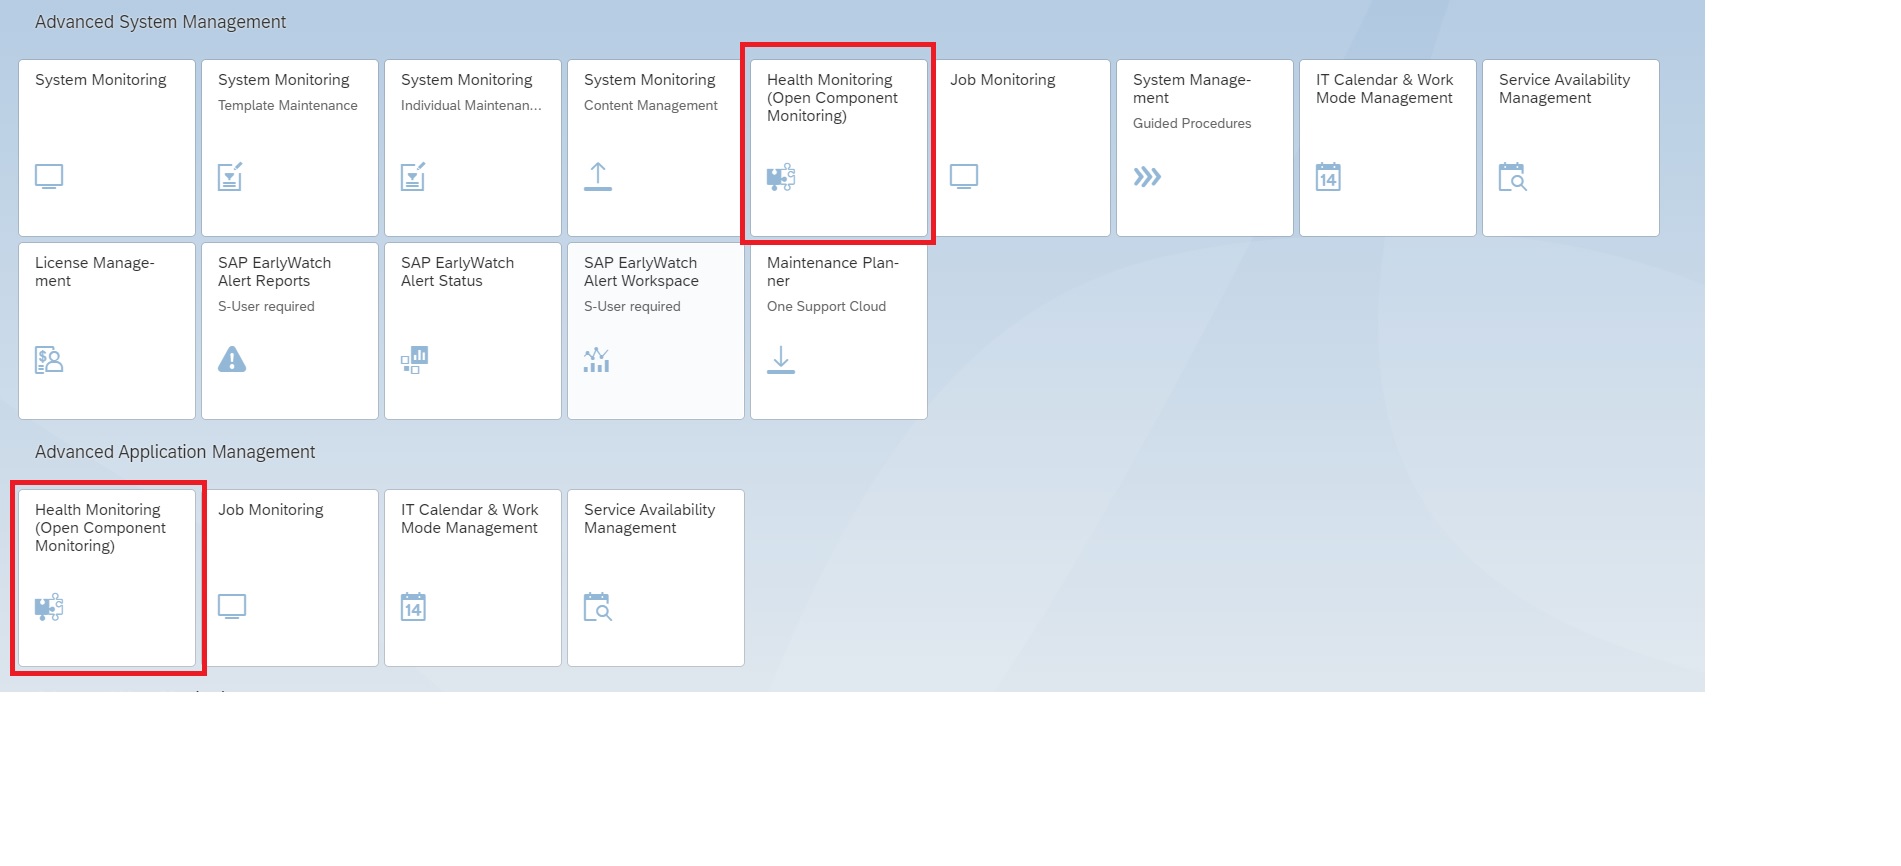
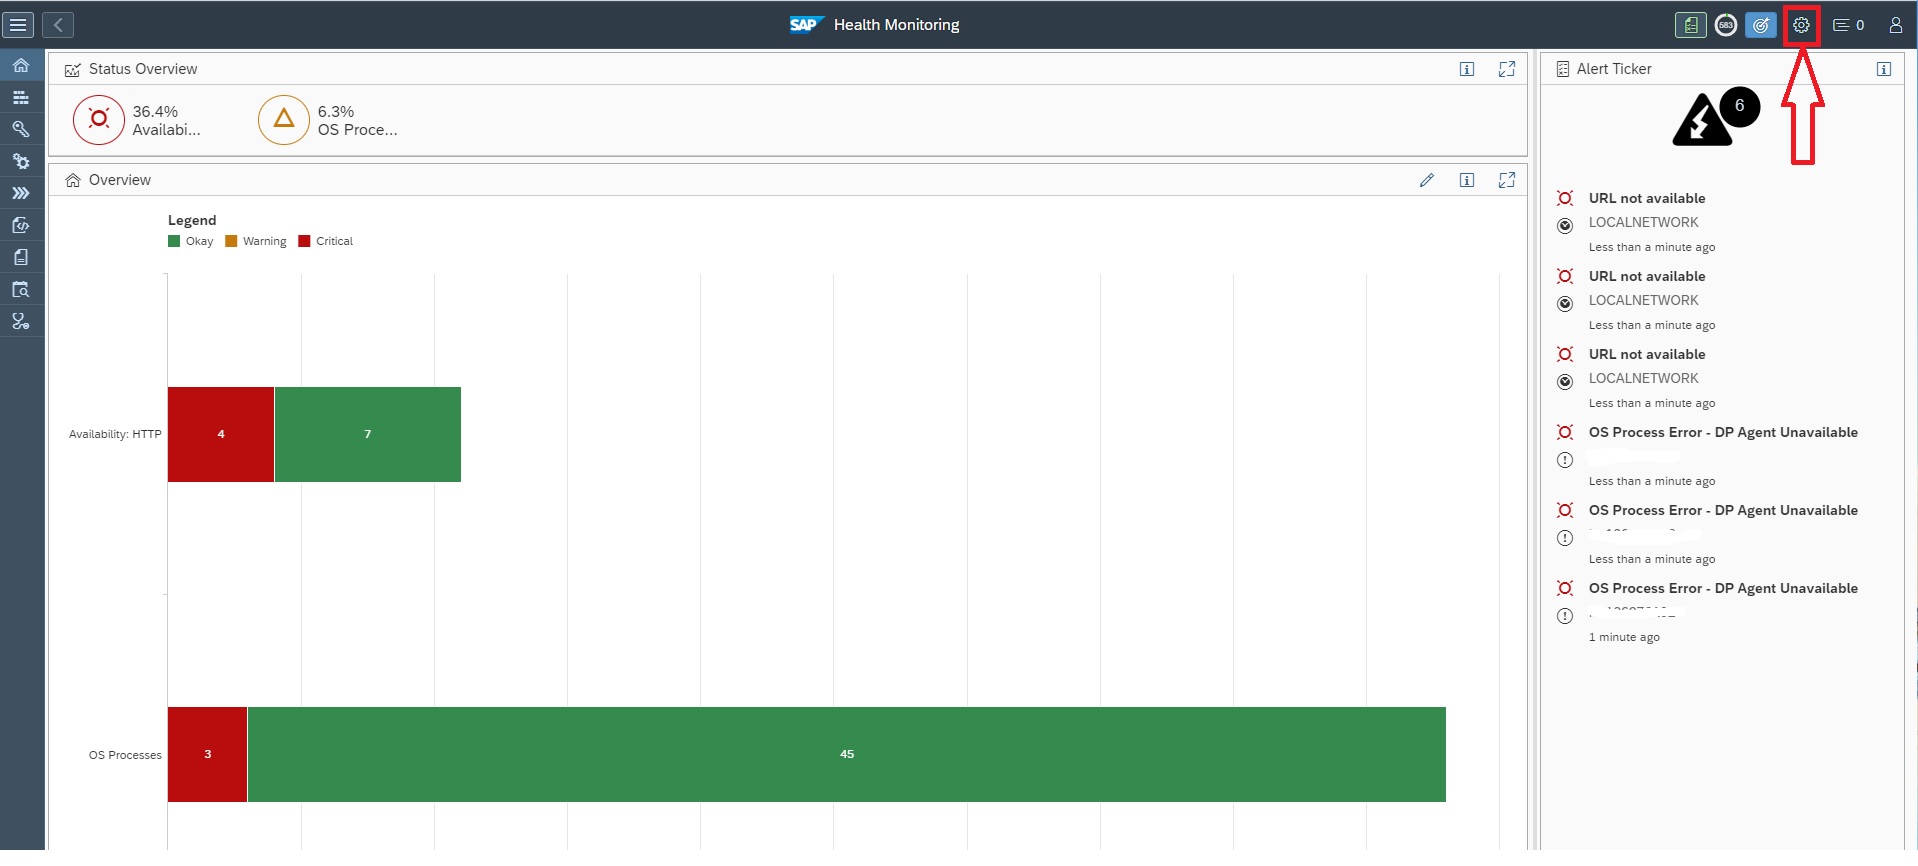
Health monitoring can be started with the FIORI tile:
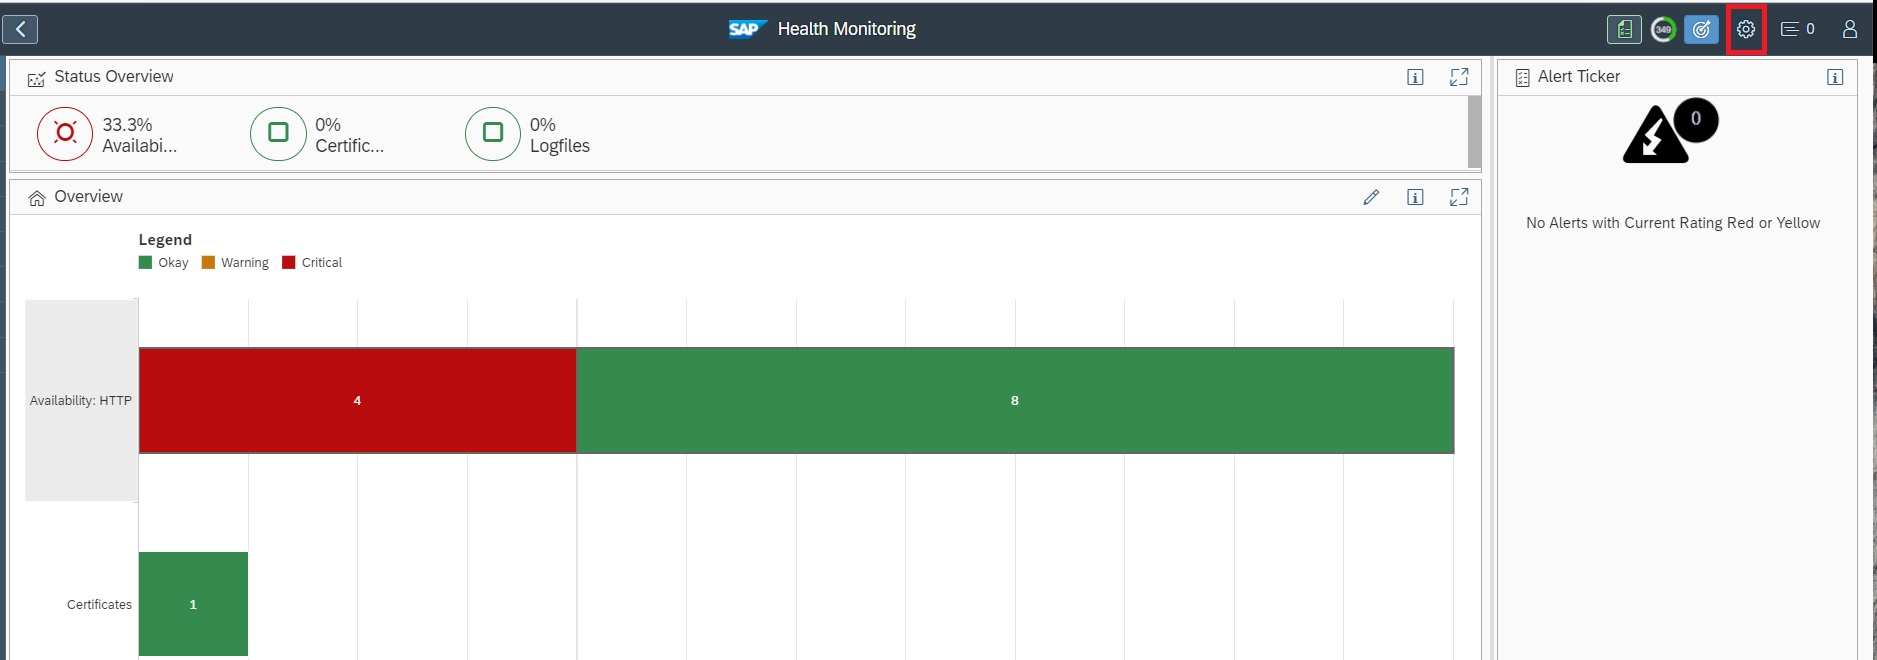
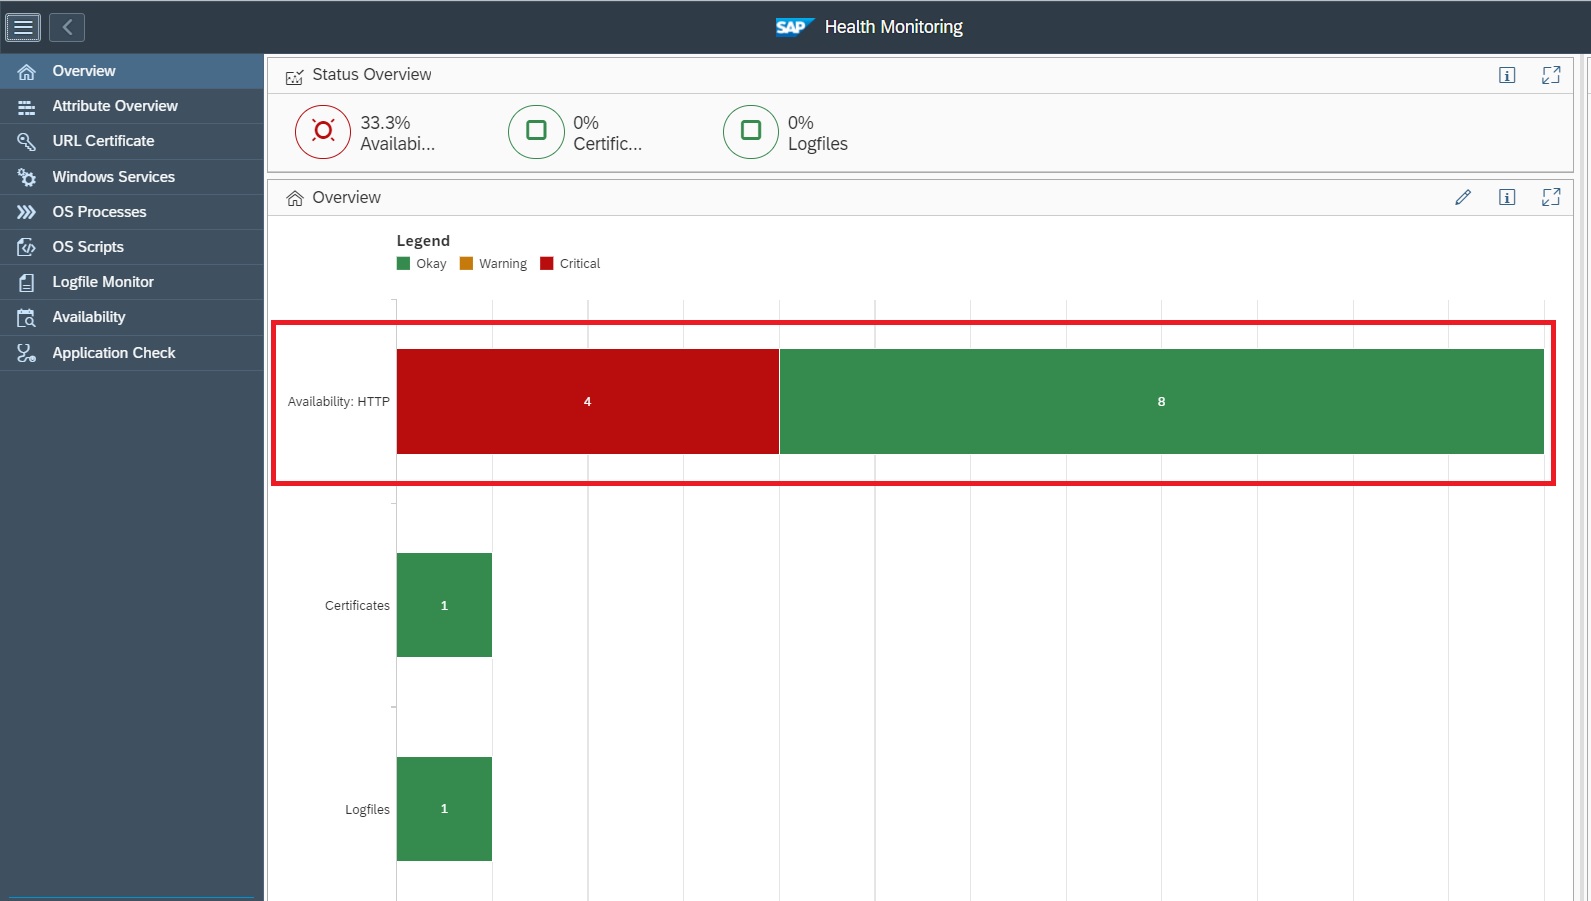
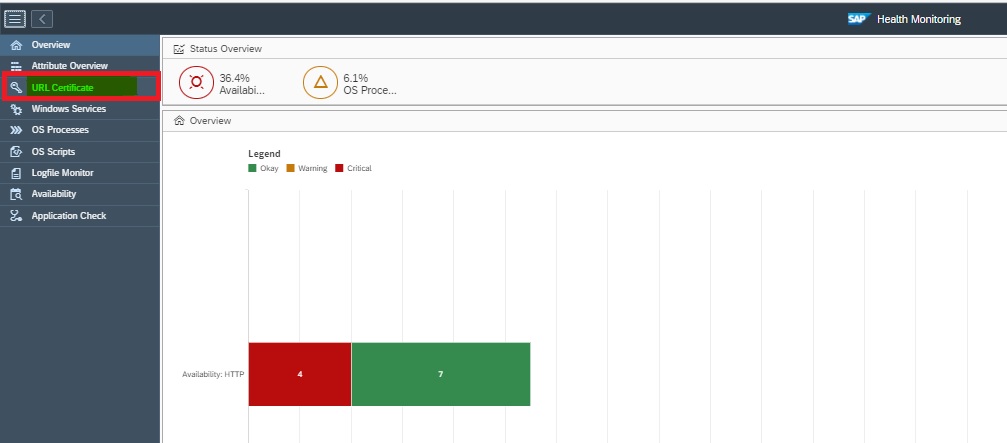
The overview screen opens:
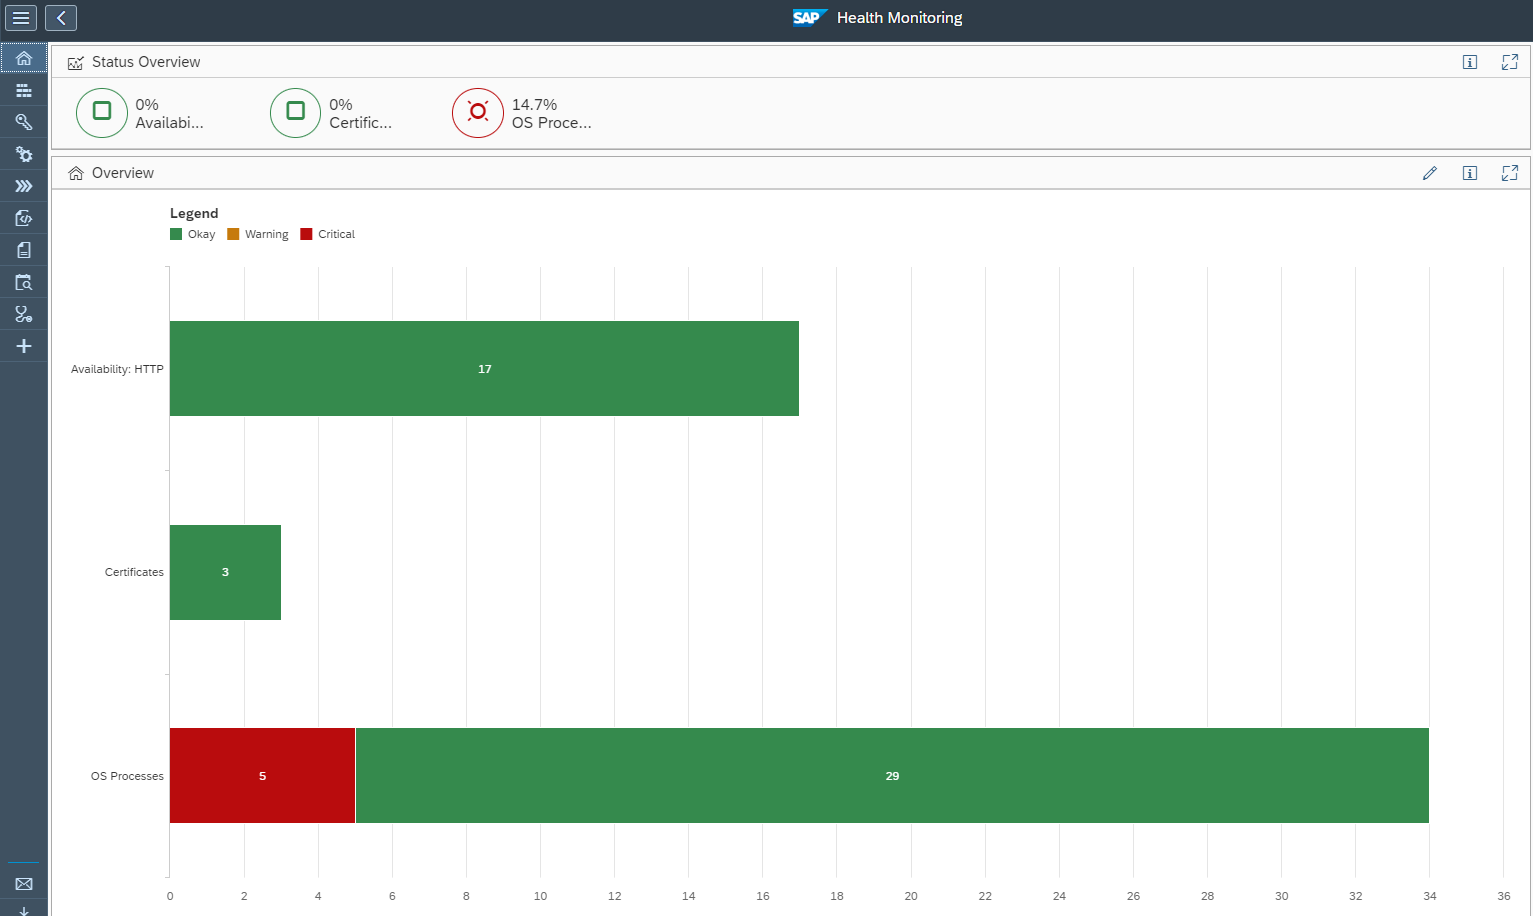
From the overview you can immediately zoom to the error by clicking on the red bar:

Health monitoring content update
For updating content of health monitoring, follow the instructions in OSS note 3360399 – Unable to import the FRUN-CONT package FRUNCONT40003_0-80008241.ZIP.
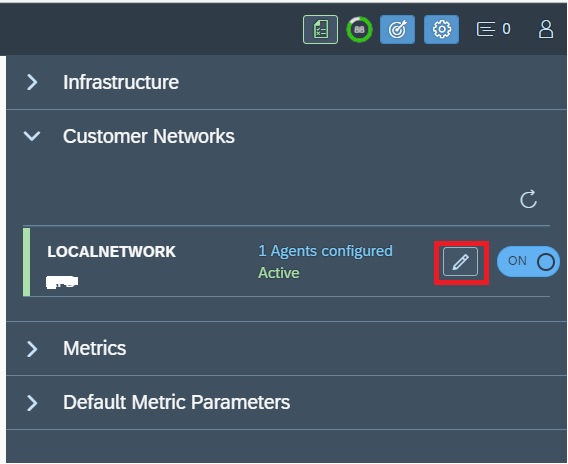
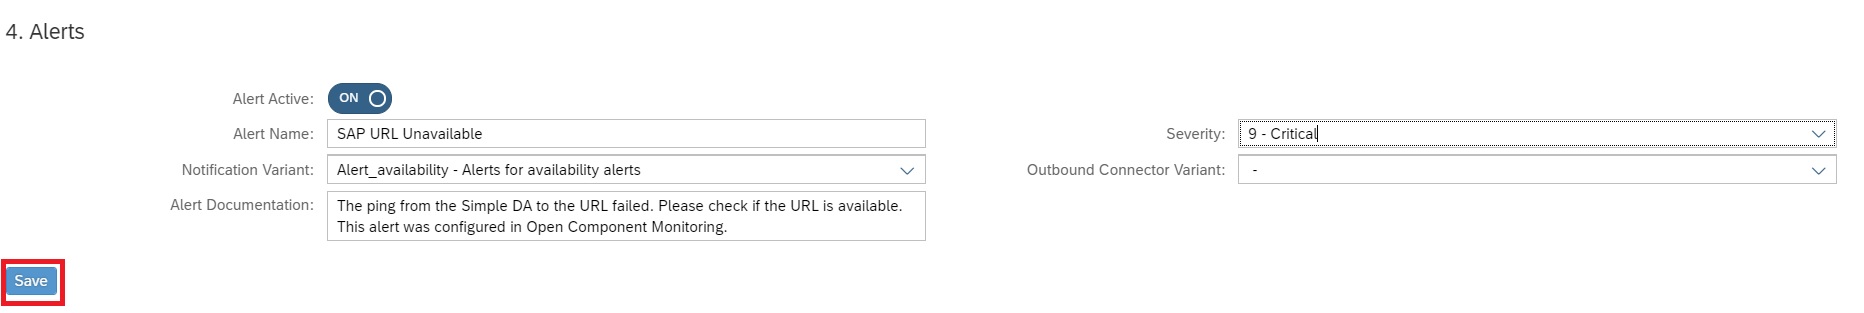
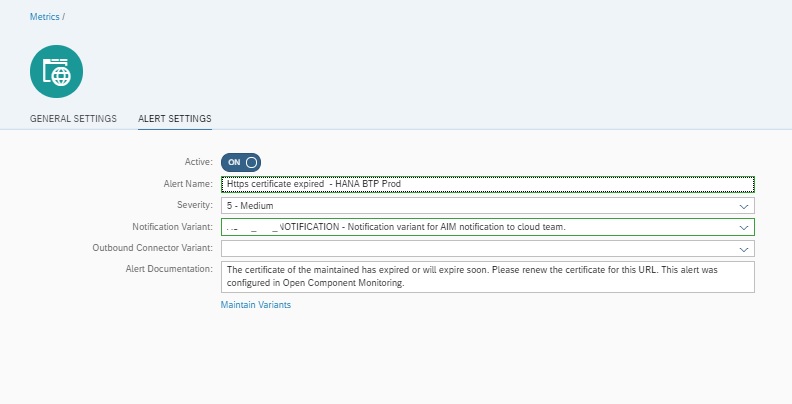
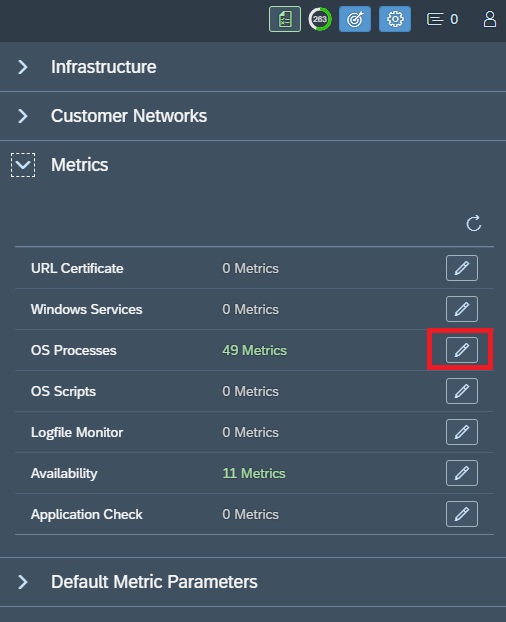
Configuration and Alerts
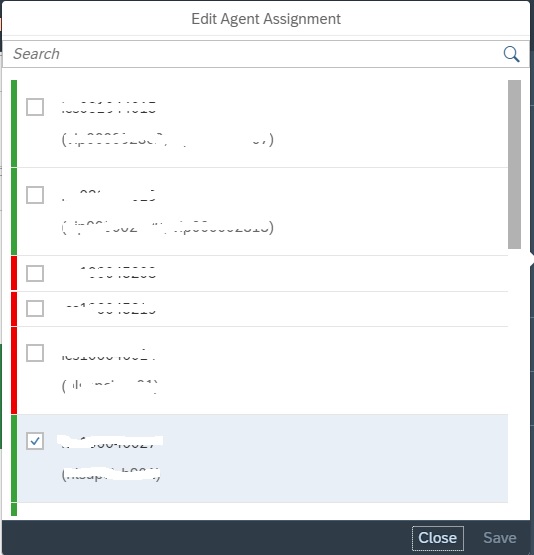
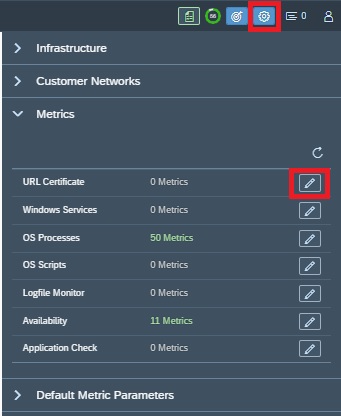
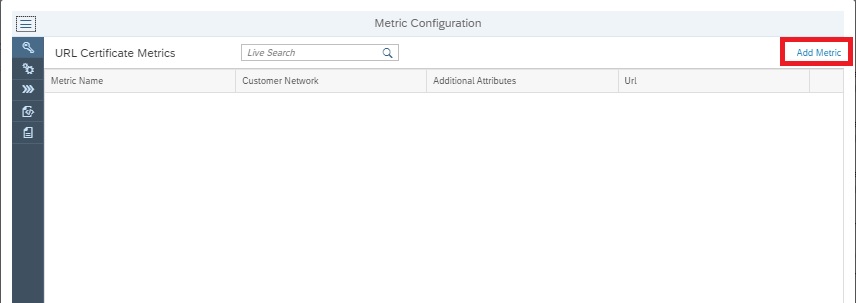
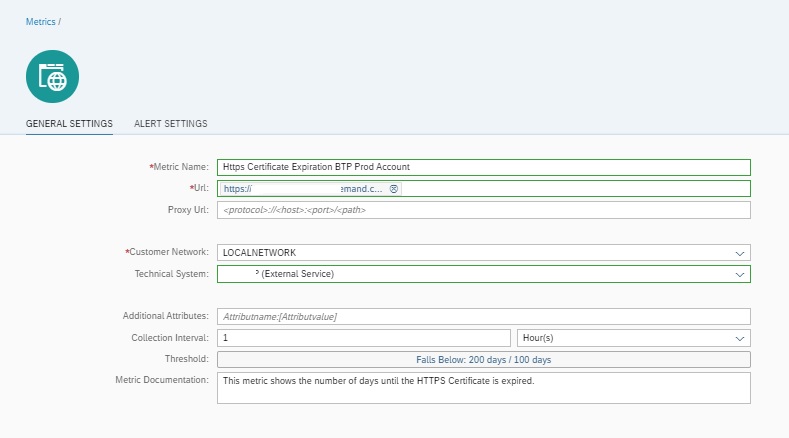
Each scenario needs to be configured. For the configuration per scenario read the separate detailed blogs:
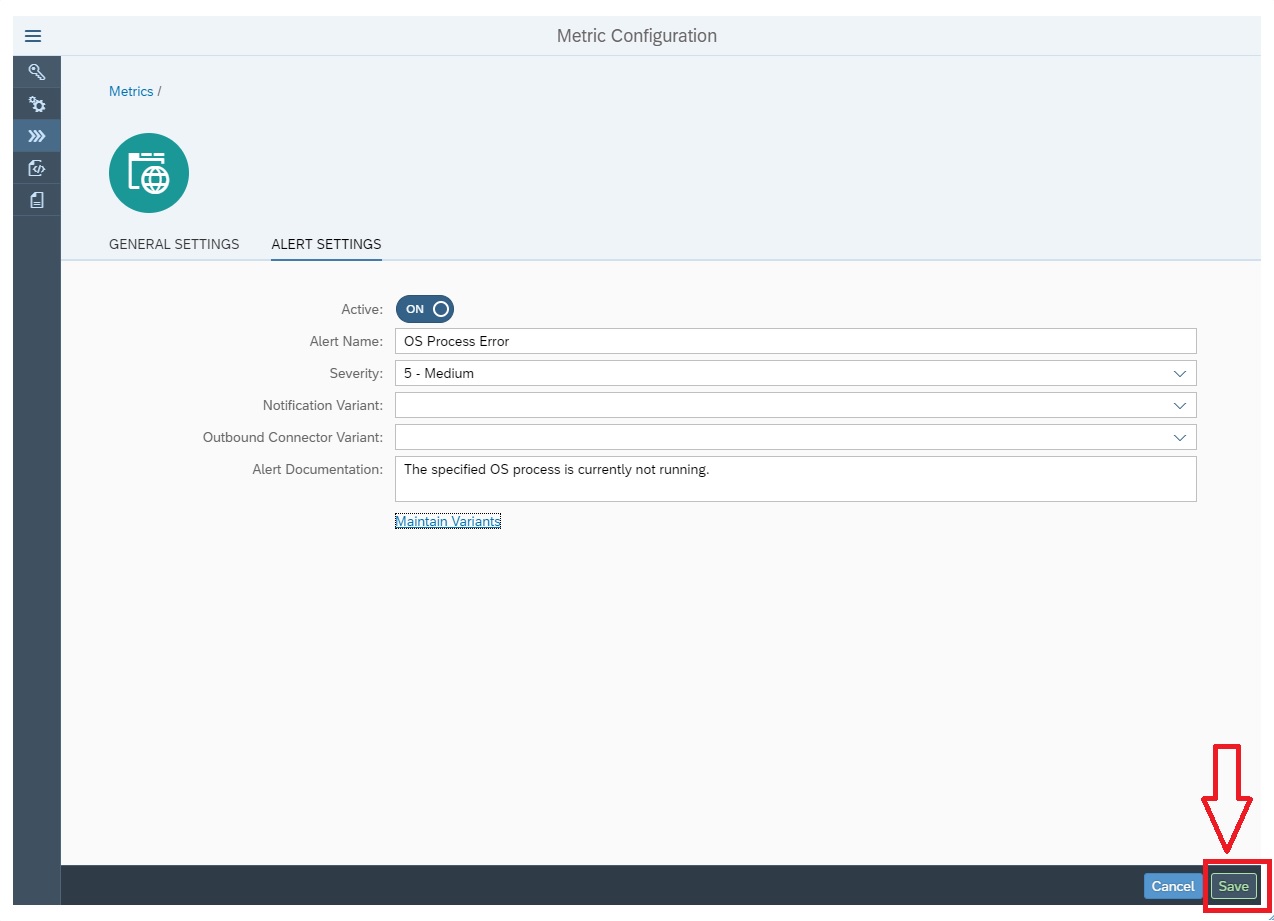
Per scenario you can choose to create an alert in case of issues. The alert is then send to the central Alert overview.