From availability perspective, you want to detect as quickly as possible if you are suffering from missing hardware ID.
You can create a custom monitoring metric to measure and act on this.
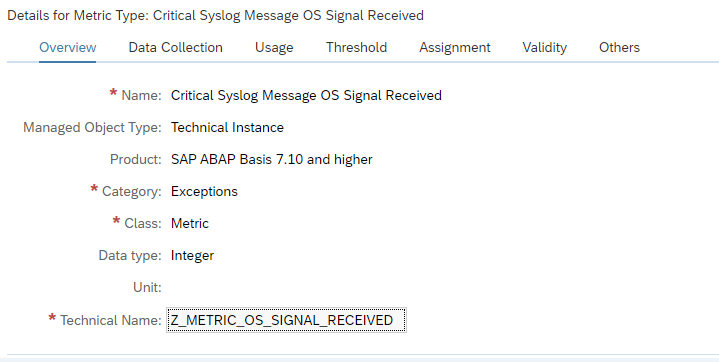
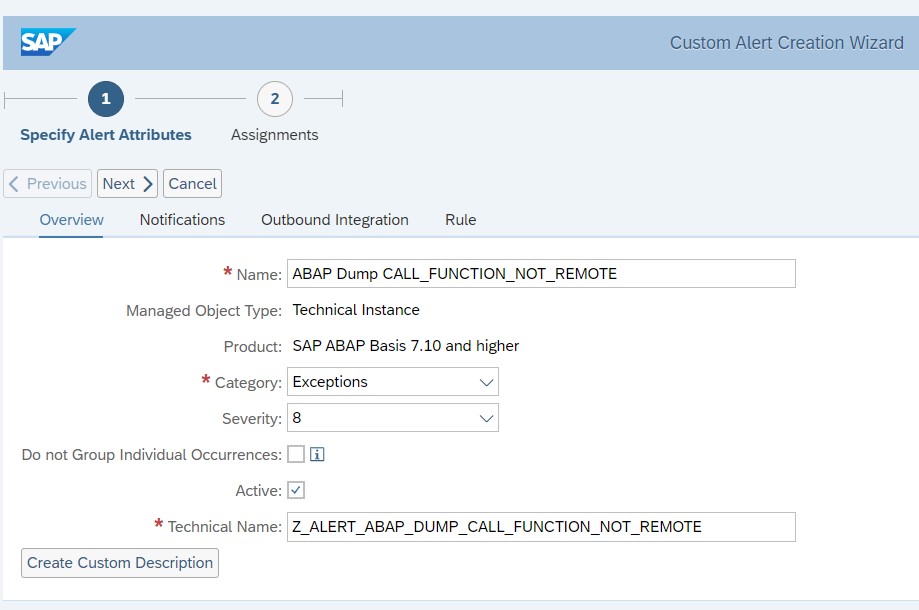
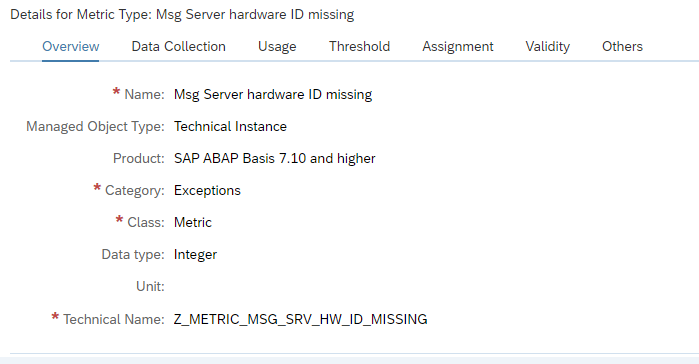
Creation of the custom metric for missing hardware ID
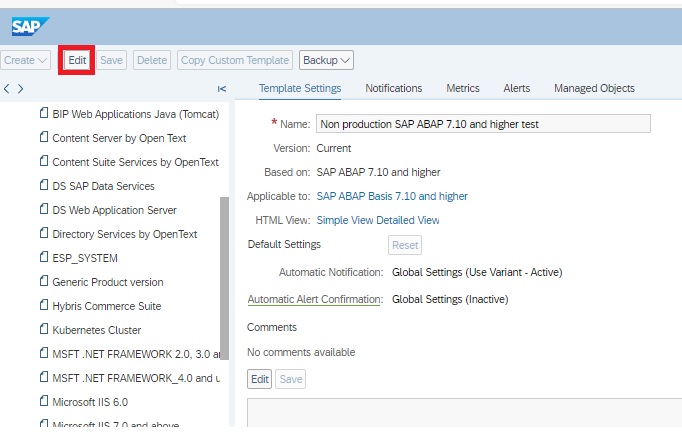
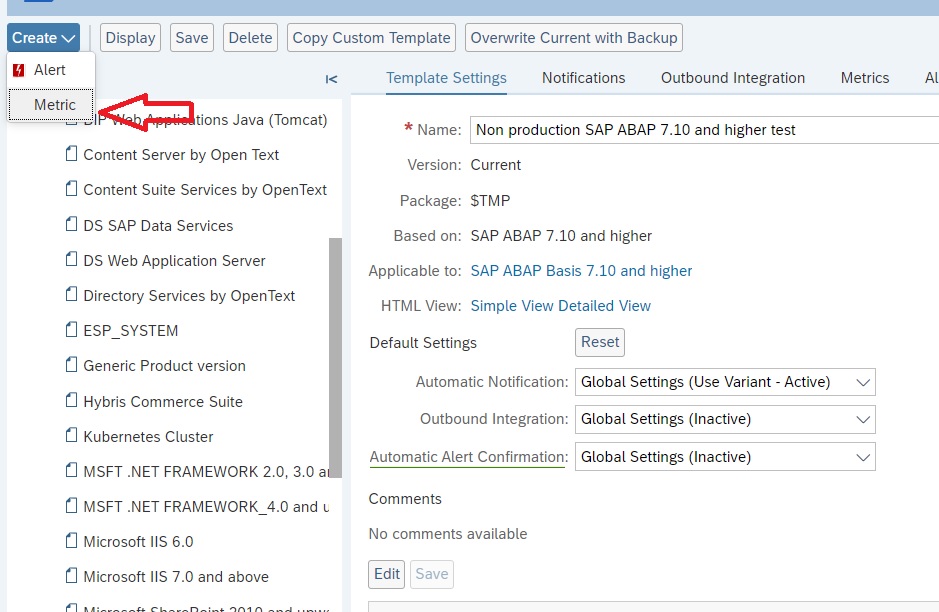
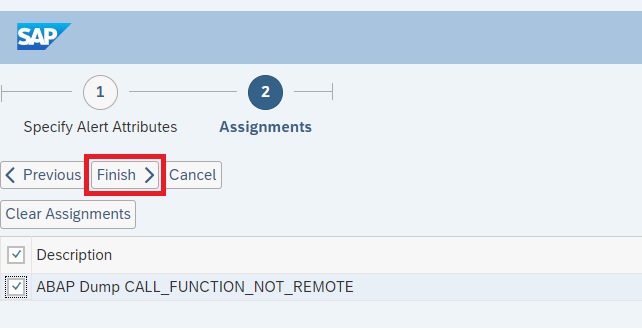
Create a custom metric following the steps in this blog. The template to be adjusted is the technical instance SAP ABAP 7.10 and higher template.
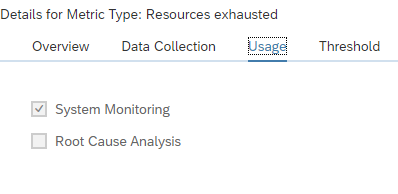
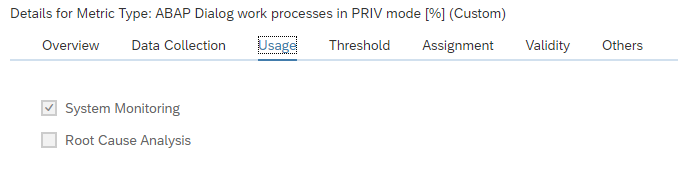
Don’t forget to tick it on for monitoring otherwise it is not active.
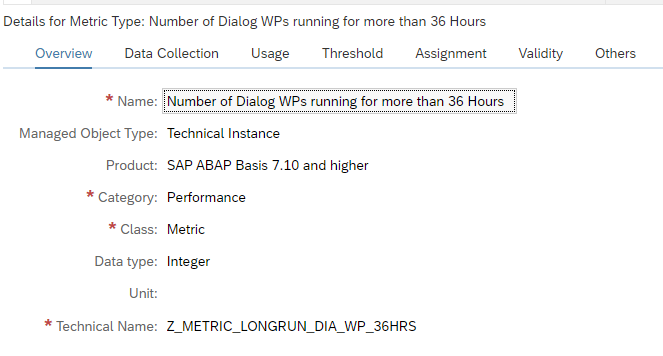
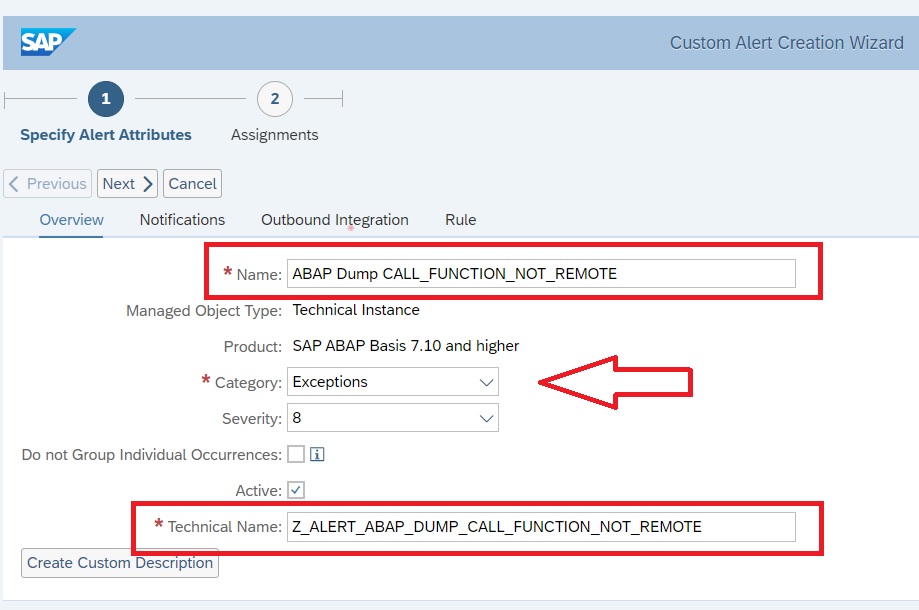
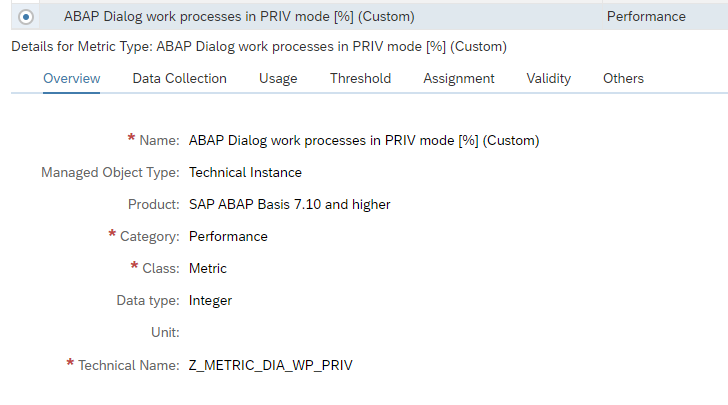
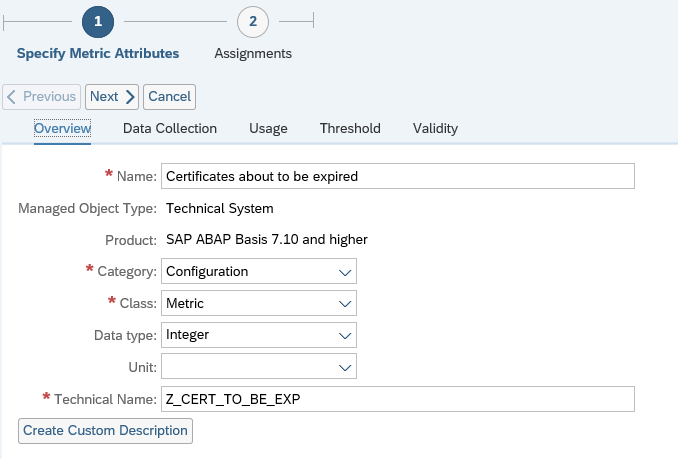
In expert mode create a custom metric.
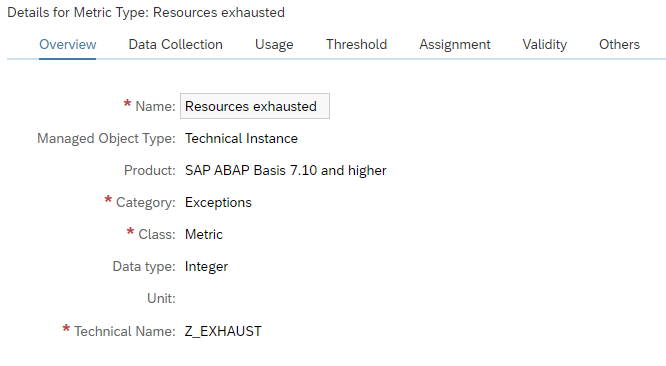
Create technical name Z_METRIC_MSG_SRV_HW_ID_MISSING:
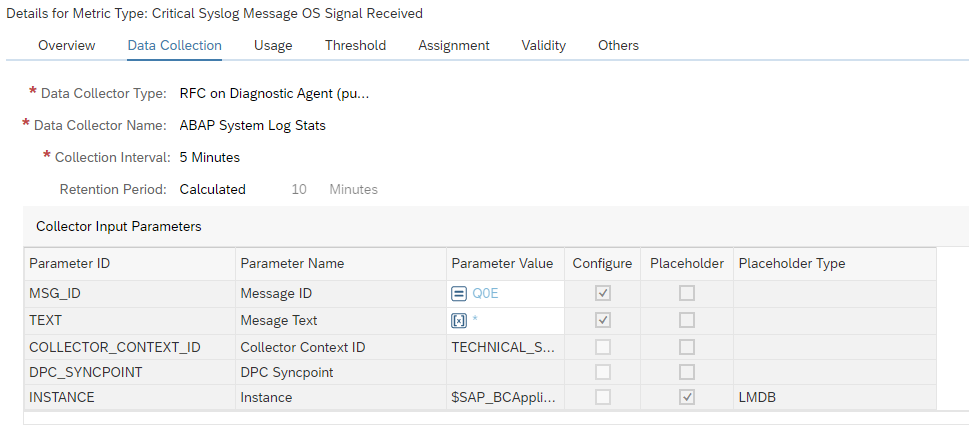
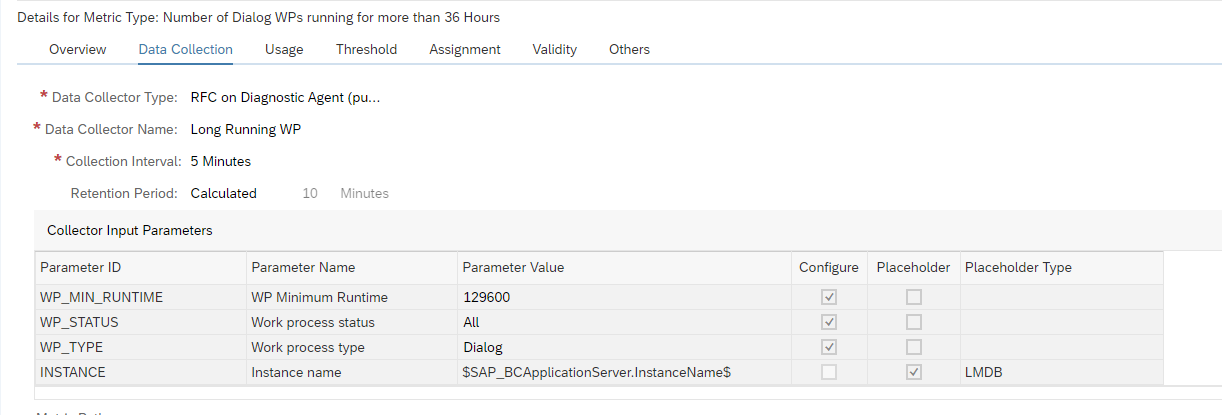
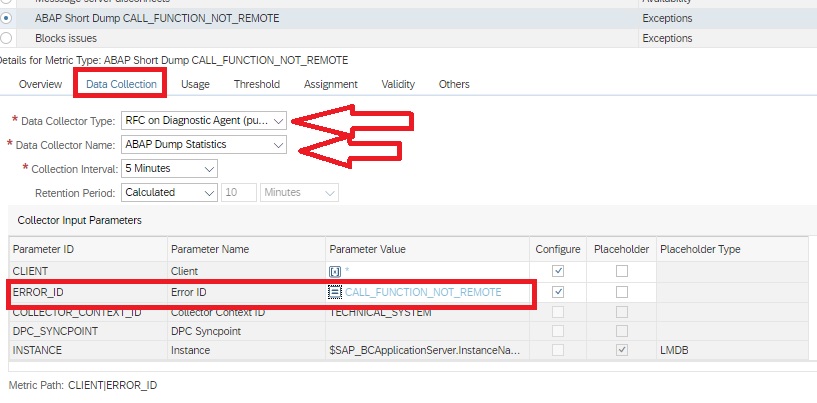
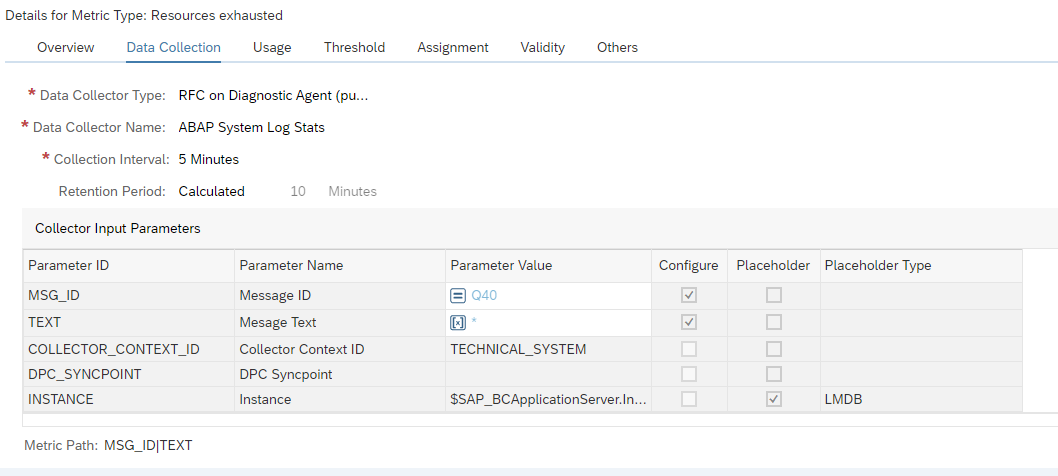
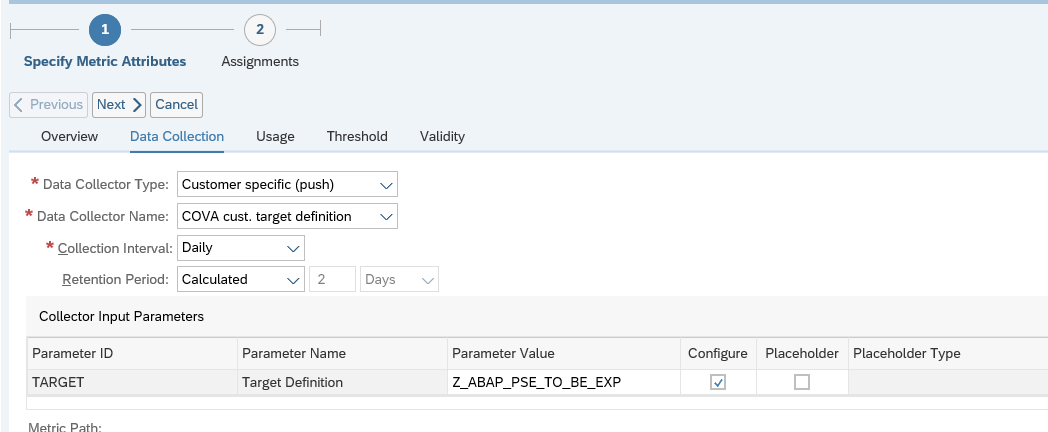
In the data collection:
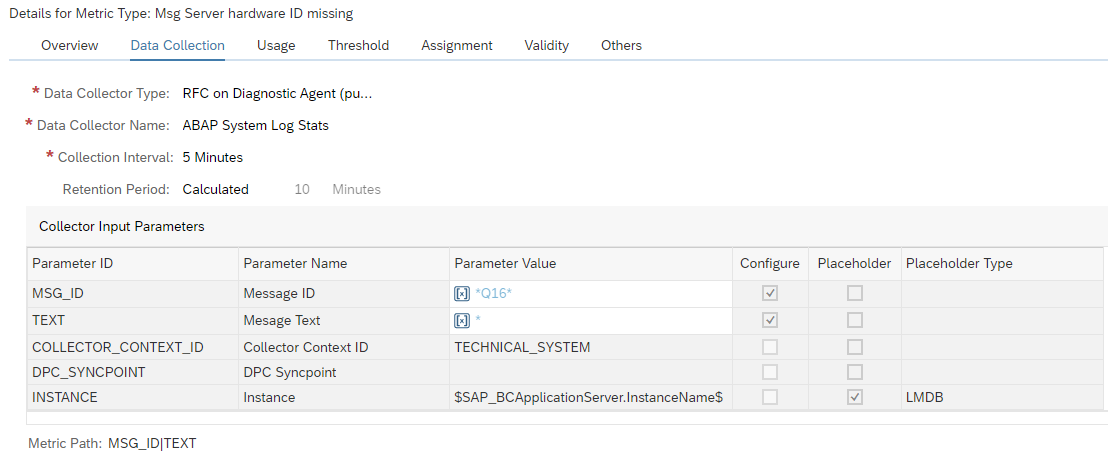
Data to enter: RFC on diagnostics agent (push). Select ABAP System Log Stats. Filter on message number Q16. This indicates missing hardware ID. For more information on system log messages, read this blog.
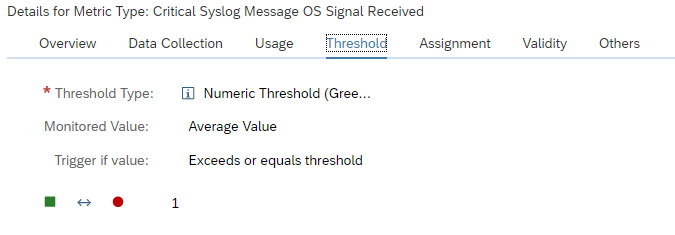
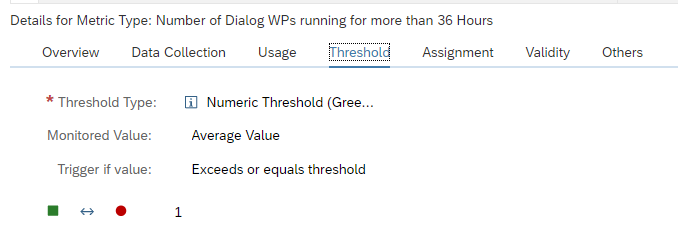
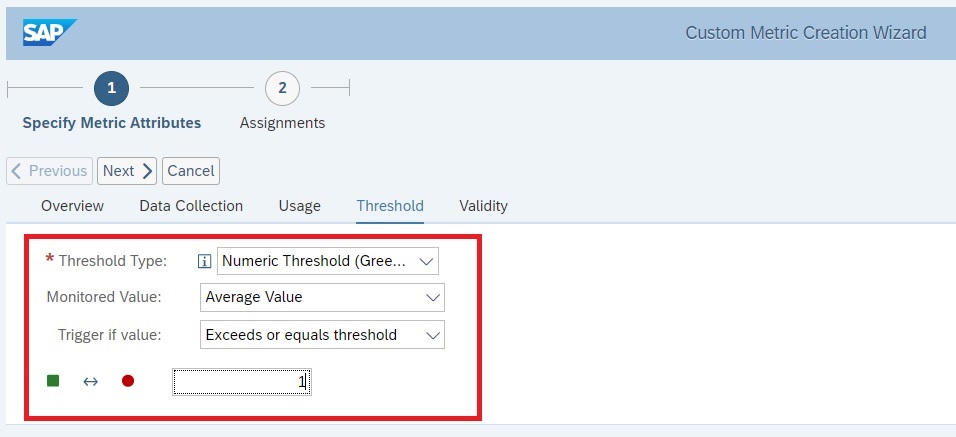
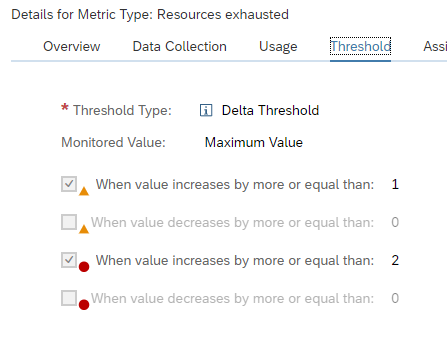
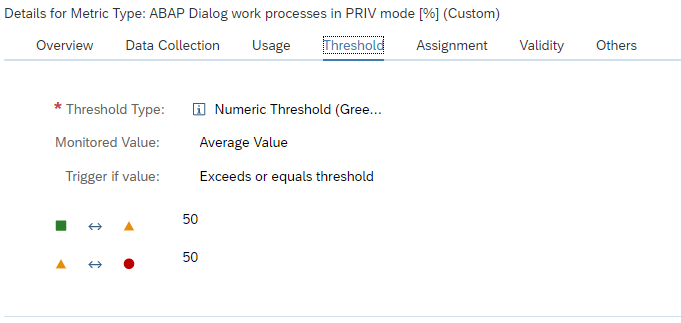
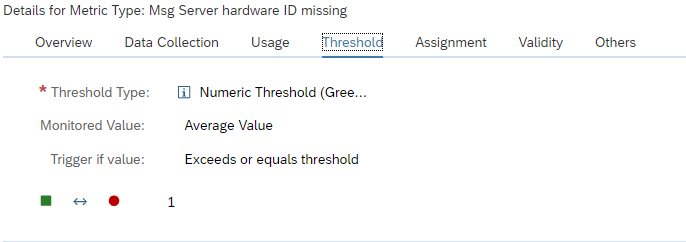
Define the threshold for alerting:
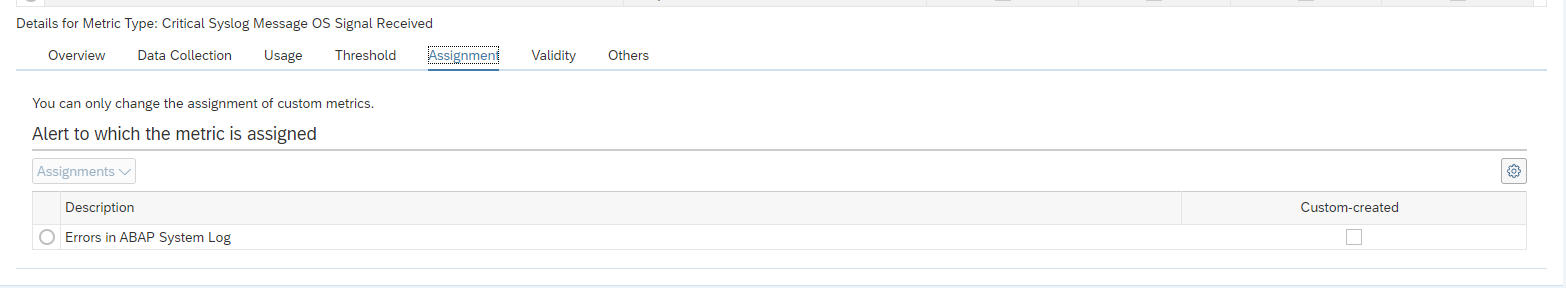
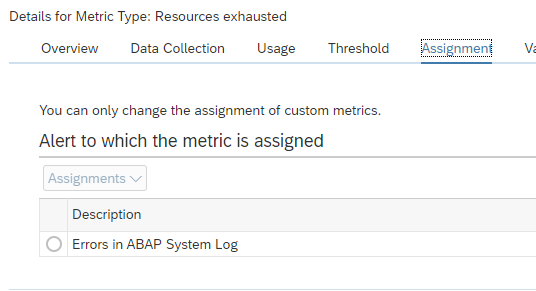
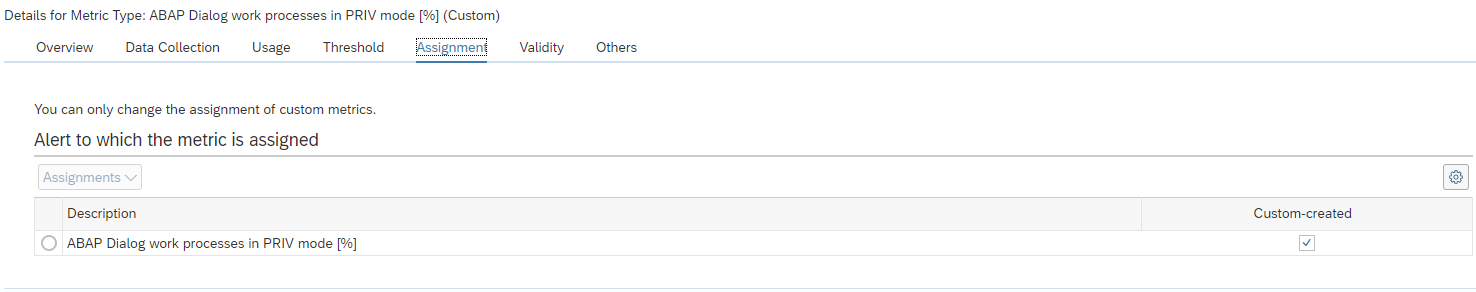
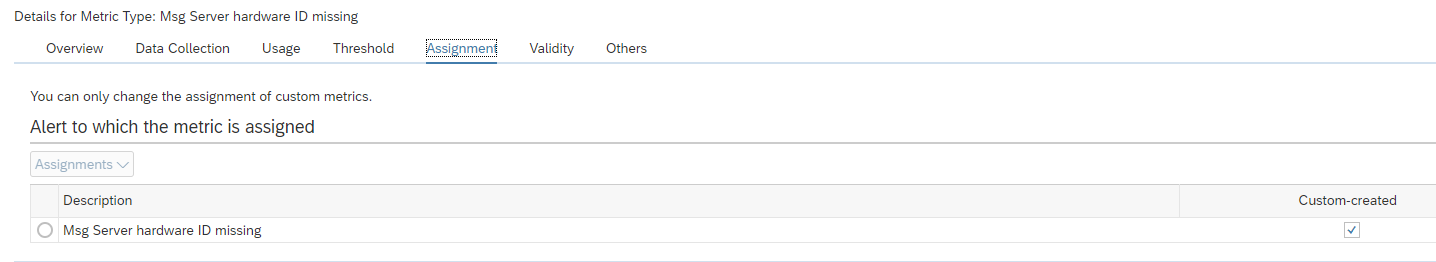
And assign the metric to the ABAP Instance not available alert group, create a custom alert group:
| Msg Server hardware ID missing | Checks for Syslog message Q16. Threshold Red for 1. |