ultiple systems. Items that are part of the tactical dashboard is database backup status, performance, logged on users, software maintenance status.
Questions that will be answered in this blog are:
- How to use the Focused Run tactical dashboards?
- How to fine tune the tactical dashboards?
- How to setup your own tactical dashboard?
Tactical dashboards usage
To start the tactical dashboard, click the corresponding Fiori tile:
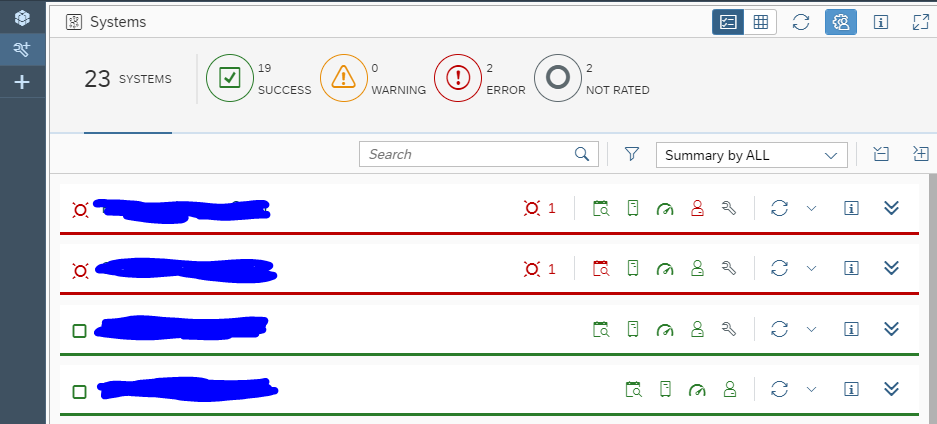
You now reach the tactical dashboard overview screen:
By clicking the Expand Group icon at the right you get first level of details:
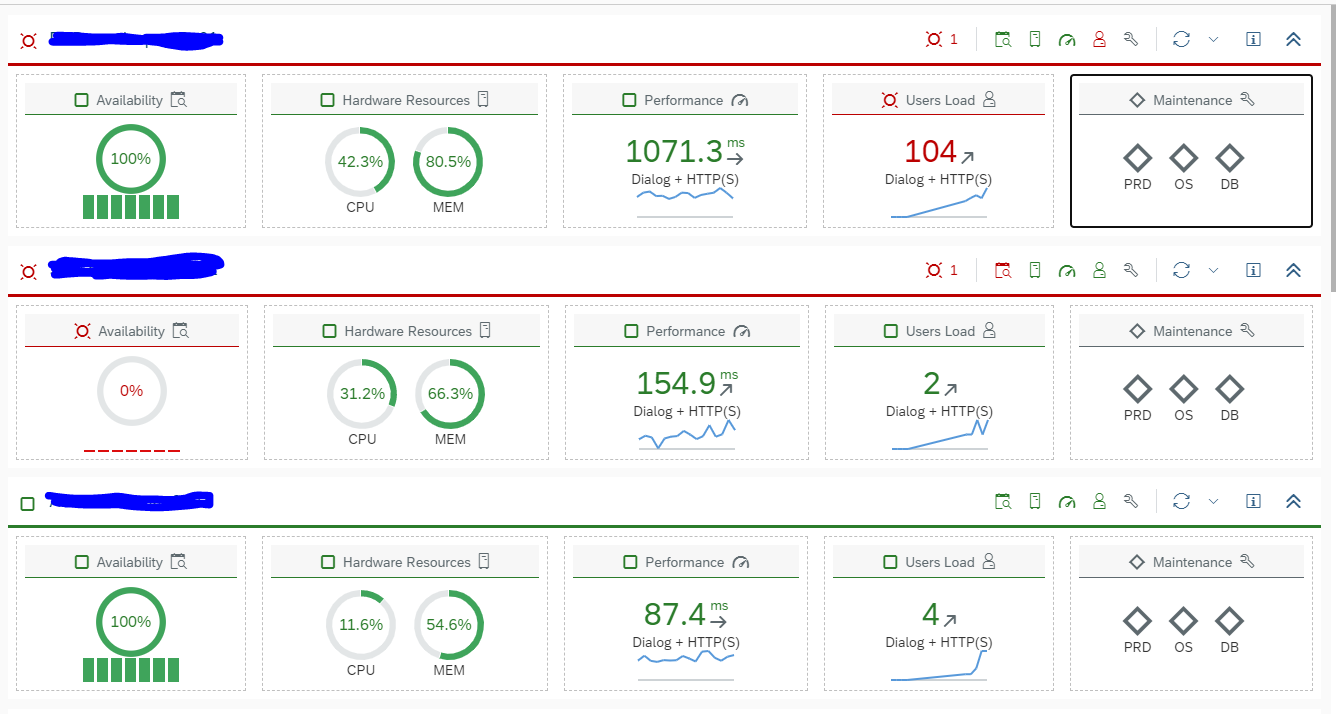
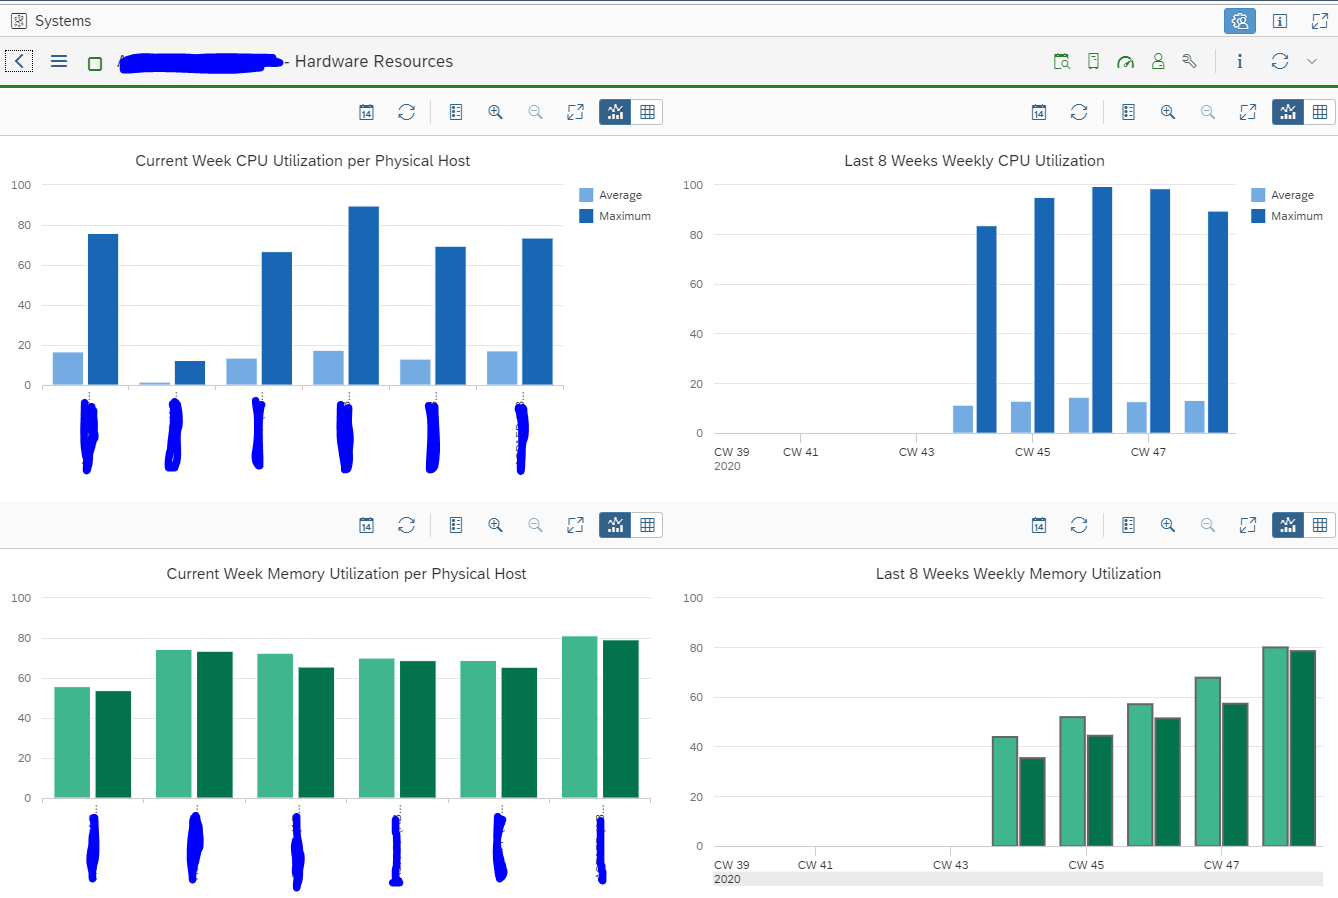
By clicking the tile you are interested in you get the details.
Examples are hardware resources for current week and last month:
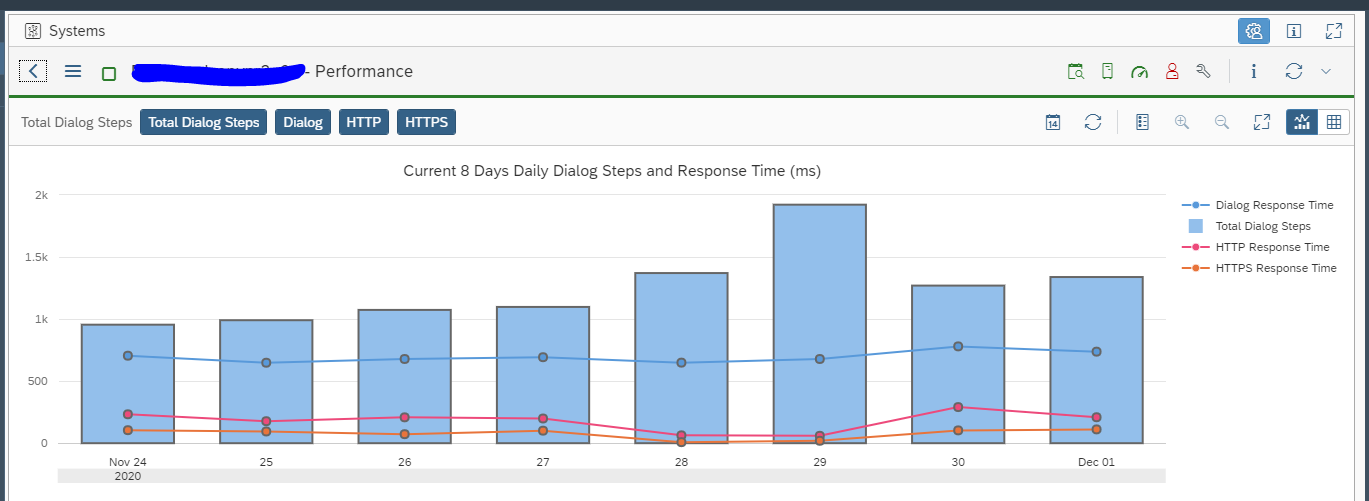
Dialog response times:
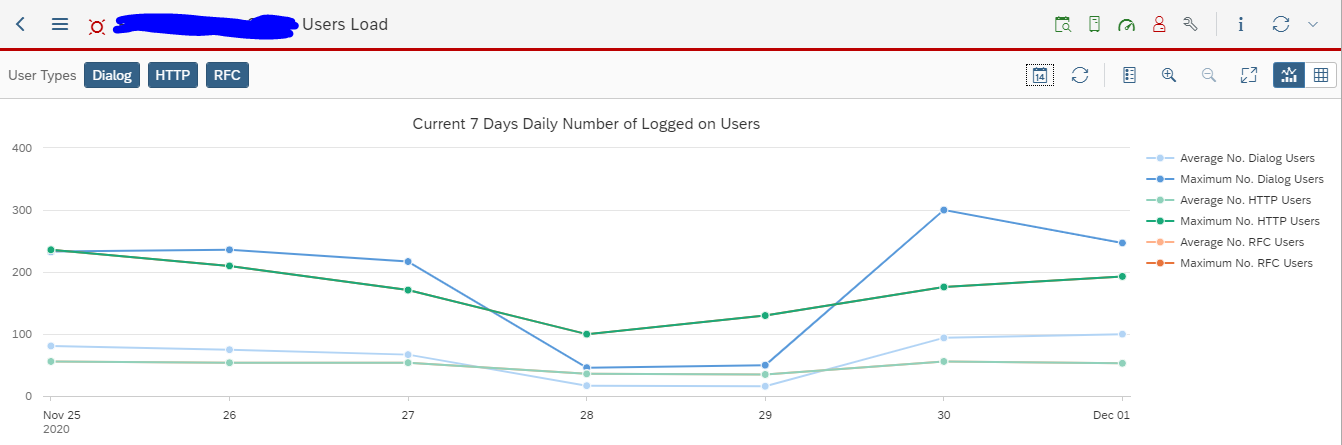
Amount of logged on users:
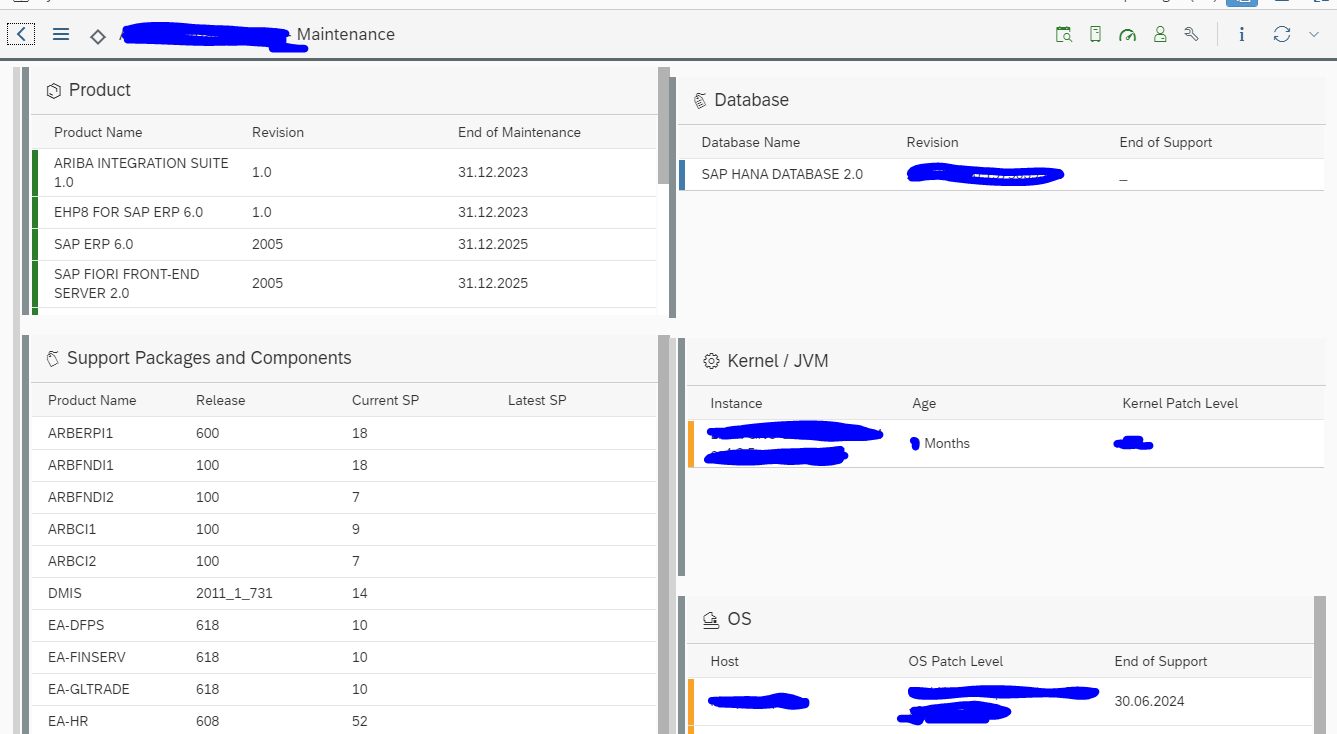
And software maintenance status for detailed components:
An alternative for manageming software components is via Security and Configuration management. More details be found in this detailed blog. The tactical dashboard is nice for 1 system. The configuration validation tool is useful for overview of components across multiple systems.
Configuration of the tactical dashboard
By clicking the personalization button top right:

you will reach the configuration screen. Here you can add and delete systems from the overview:
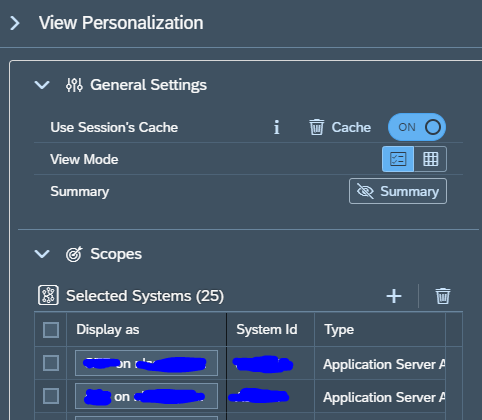
And you can set the view properties and thresholds for each of the categories:
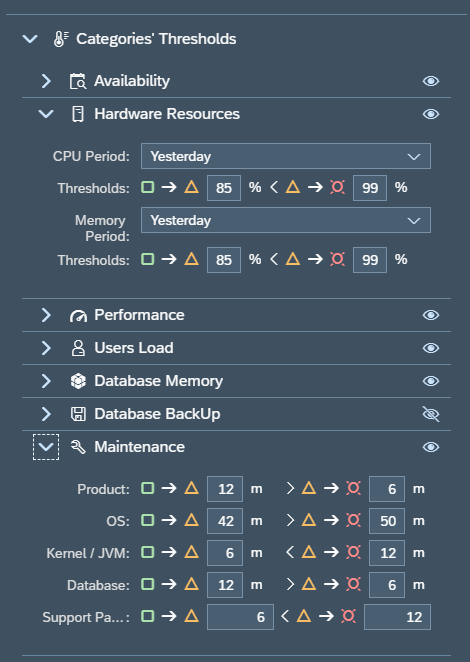
This fine-tuning you do as per your companies needs. By clicking on the Visibility symbol, you can hide an aspect from your overview. Like above the Database backup was put to invisible.
Creating your own tactical dashboard
You can create your own tactical dashboard for your own specific needs. We will take the example here to make a dedicated dashboard for the backups. Since we want to check daily in the overview if the backups were successful.
Start by clicking top left on the big + symbol to add a new dashboard:

The personalization view screen will open:
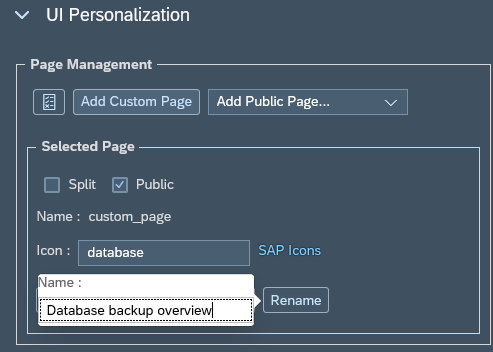
Important here are a few things. Set the tick box Public if you want to share this dashboard. Find the keyword for the right SAP icon (use the SAP icons link and read this blog). Rename the dashboard by clicking the Rename button.
Now Save the page. Close the personalization. You are now in the empty screen. Open peronalization again to add the system(s):
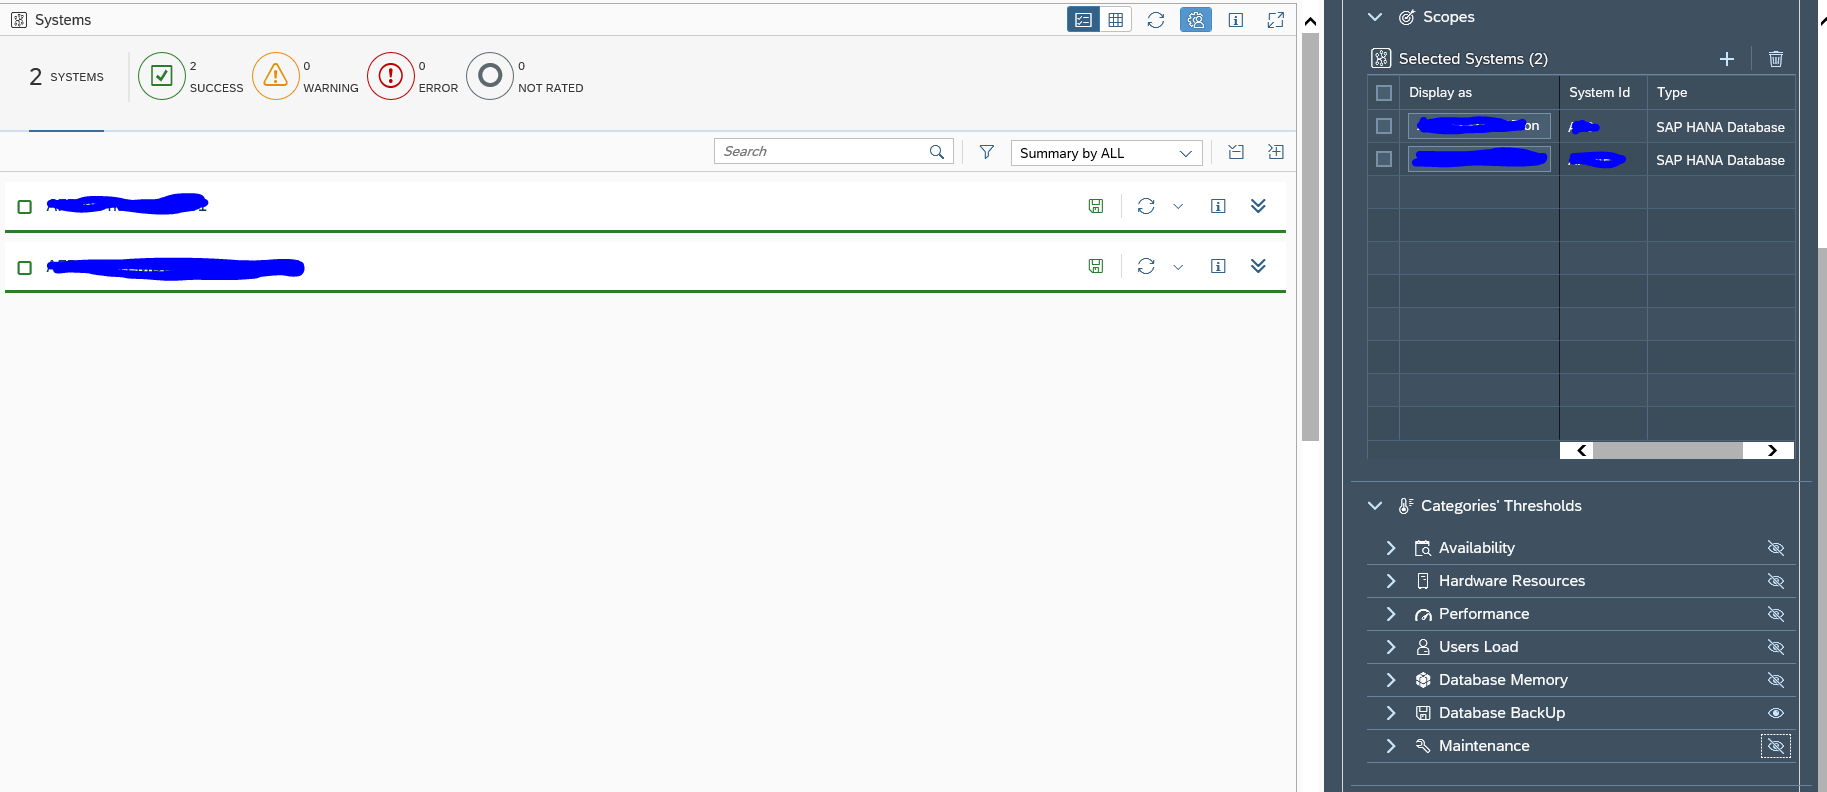
Also hide the not needed views. On the left hand side you can immediately see the result updating.
Hint: start with one or two systems only when making a new dashboard. First fine tune what you want to see. When all is ok, add the systems later. If you have a lot of systems, the updating of the left hand screen will be slowing you down.
Don’t forget to save off course.
Using a dashboard created by a different user
If you want to use a dashboard created by a different user, go to the personalization option and select the add page option:
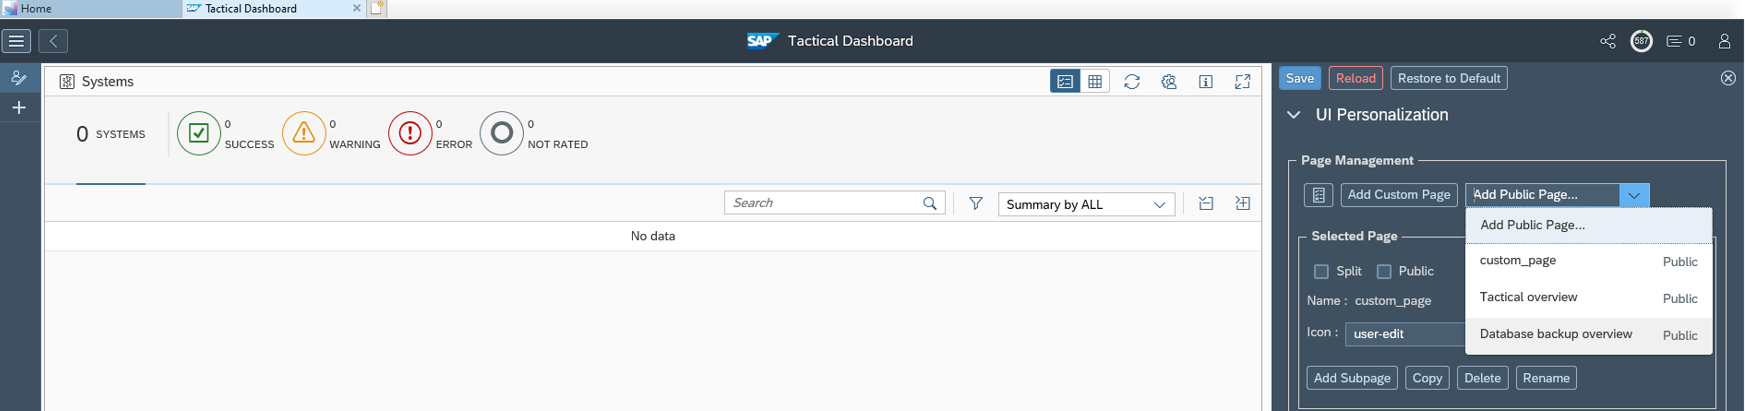
Now you can select any created dashboard, which has been set to public.
If you don’t see the correct dashboard, check with the owner that he made it public.