When using Focused Run you monitor systems. But how about the health and stability of the monitoring tool itself? Here is where self monitoring plays an important role.
Questions that will be answered are:
- What to check in self monitoring?
- How much metrics are collected and stored in my Focused Run installation?
- How can I check all grey metrics in system monitoring?
Self monitoring
Self monitoring can be started with the Self Monitoring Fiori tile:
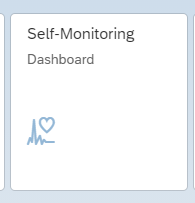
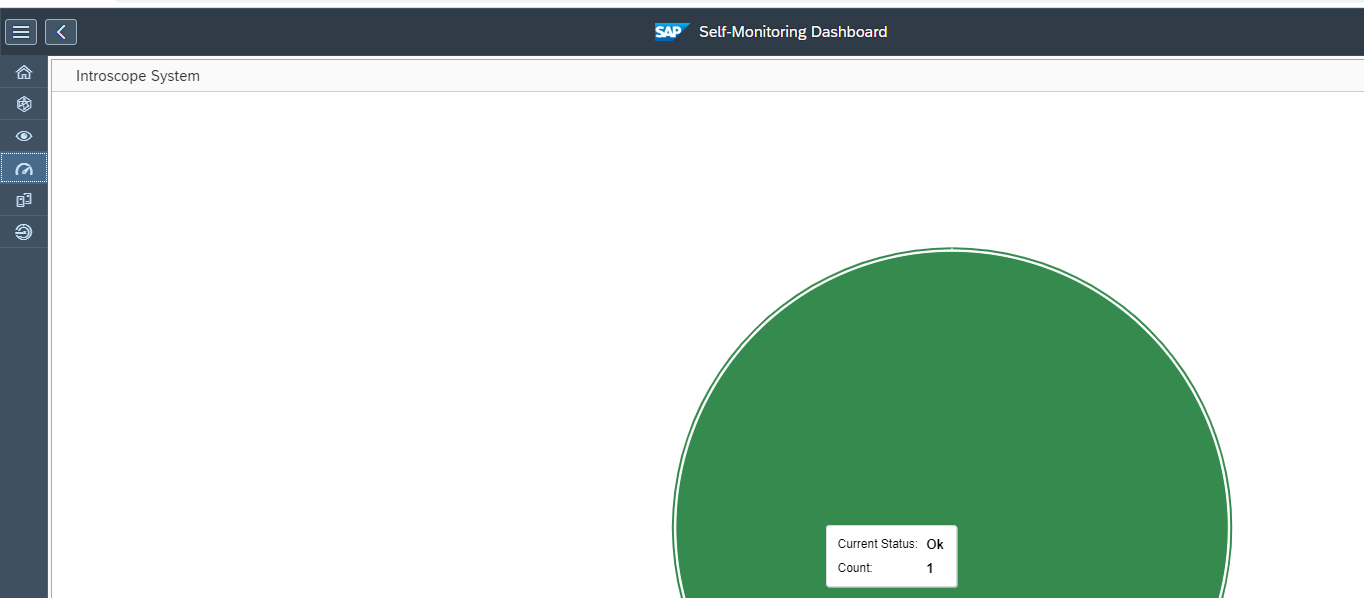
If you click the tile the overview page comes (this page will take time to load):
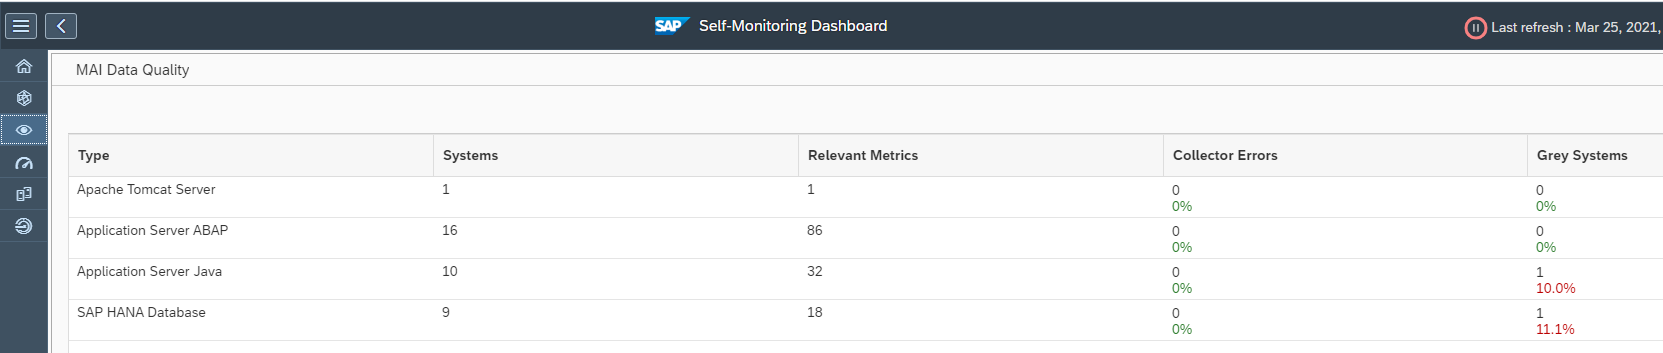
The interesting part is unfortunately hidden in the below screen (you need to scroll), which is the CPU utilisation.
The other interesting part is the amount of data collected and stored. This is not so interesting for yourself, but more interesting for your manager to show how much data HANA can handle, or to show how much work is really automated.
Simple diagnostics agent
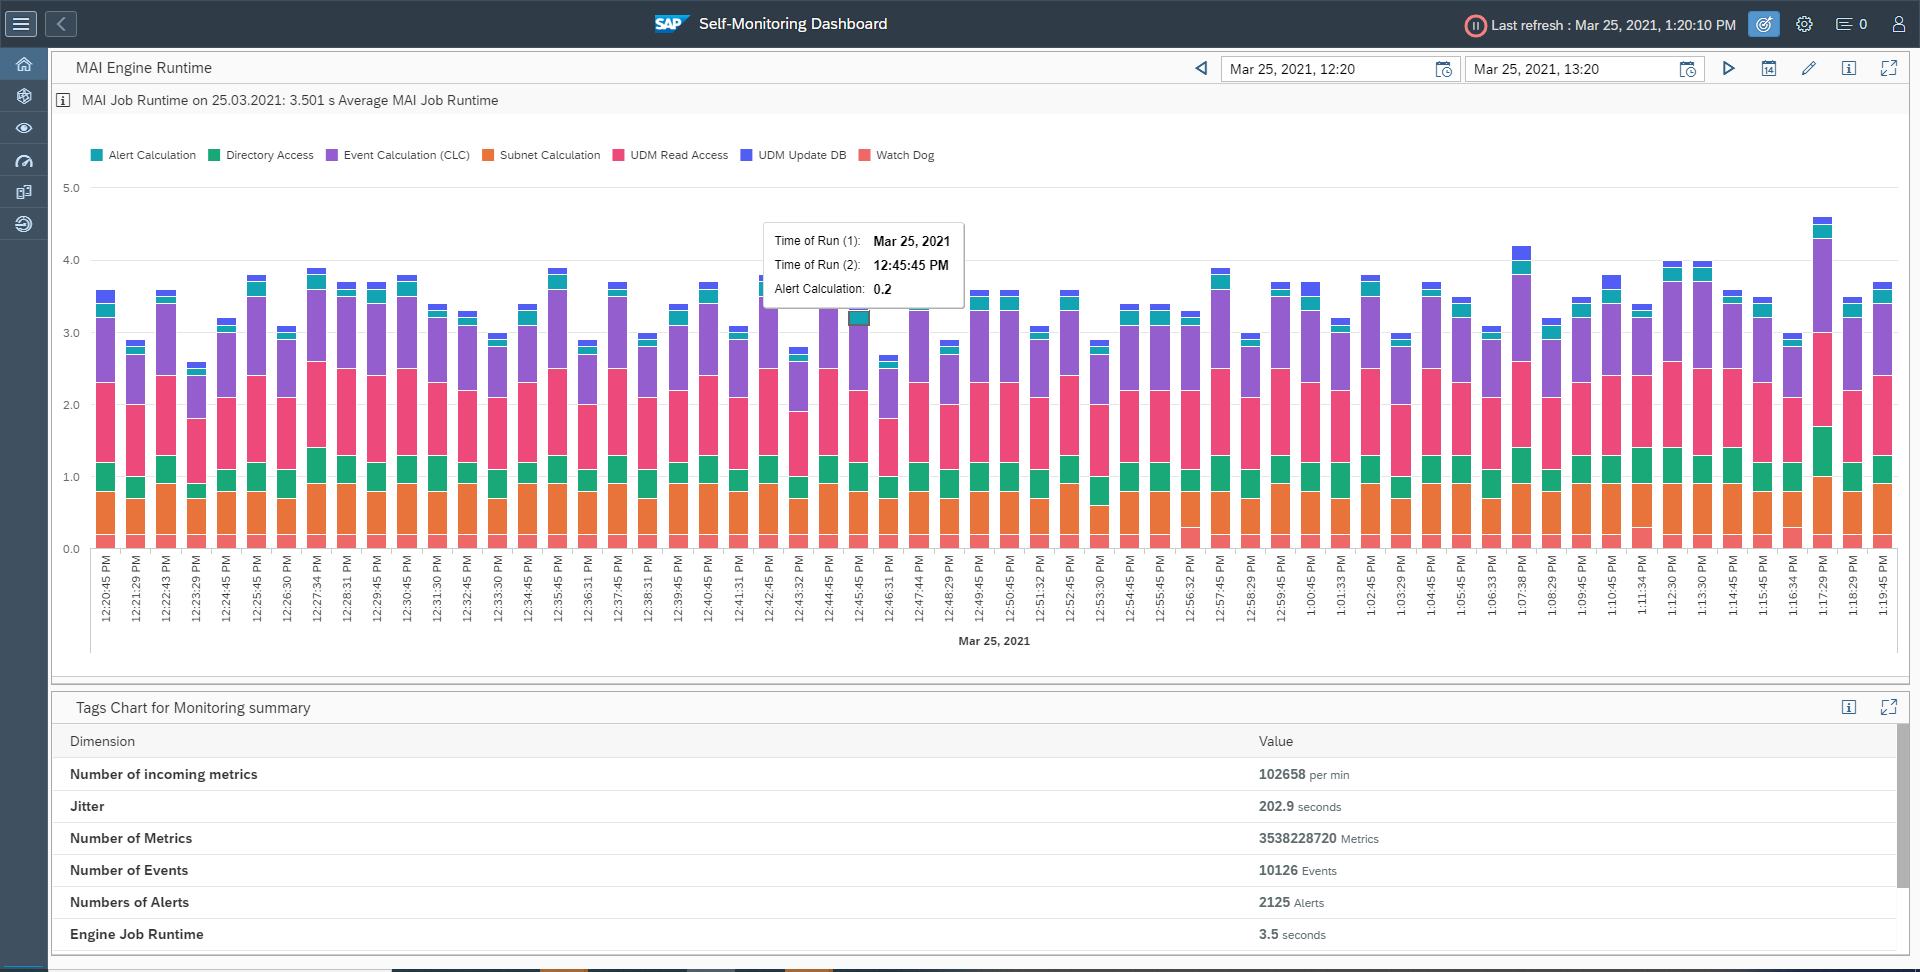
On the top left icons, click on the Simple DA agent button to get the agent overview screen:
Important here:
- Check that all agents are up
- Check that all agent versions are not too old
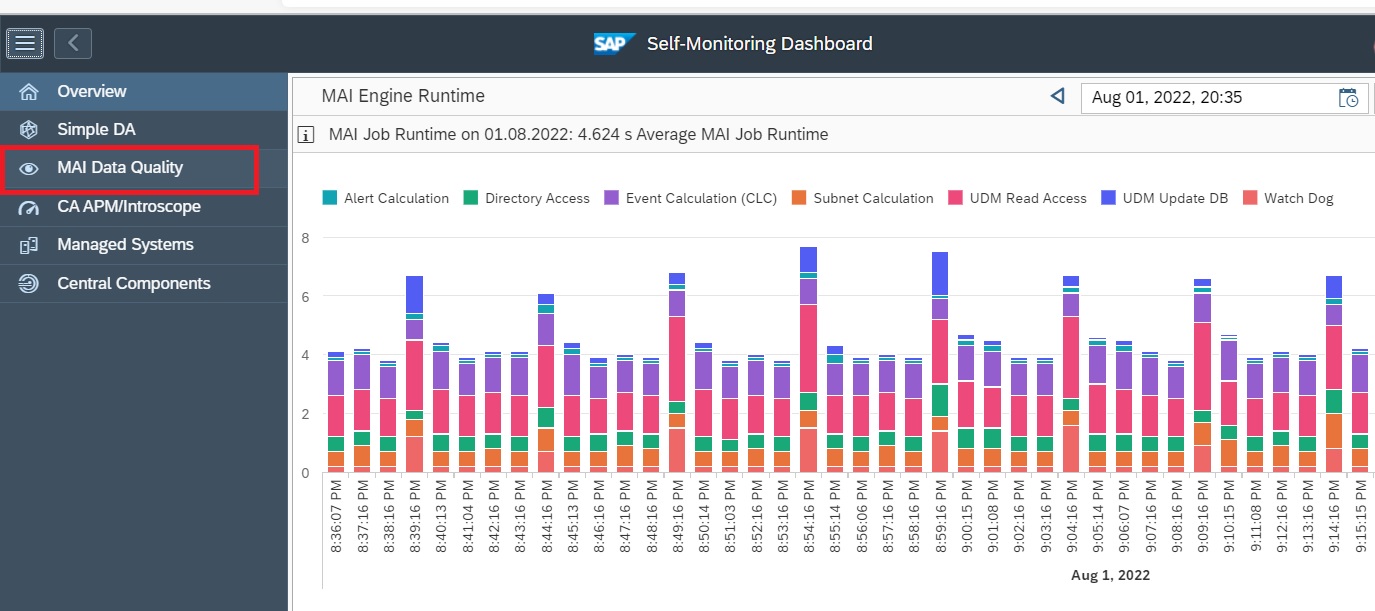
Monitoring and Alerting Infrastructure
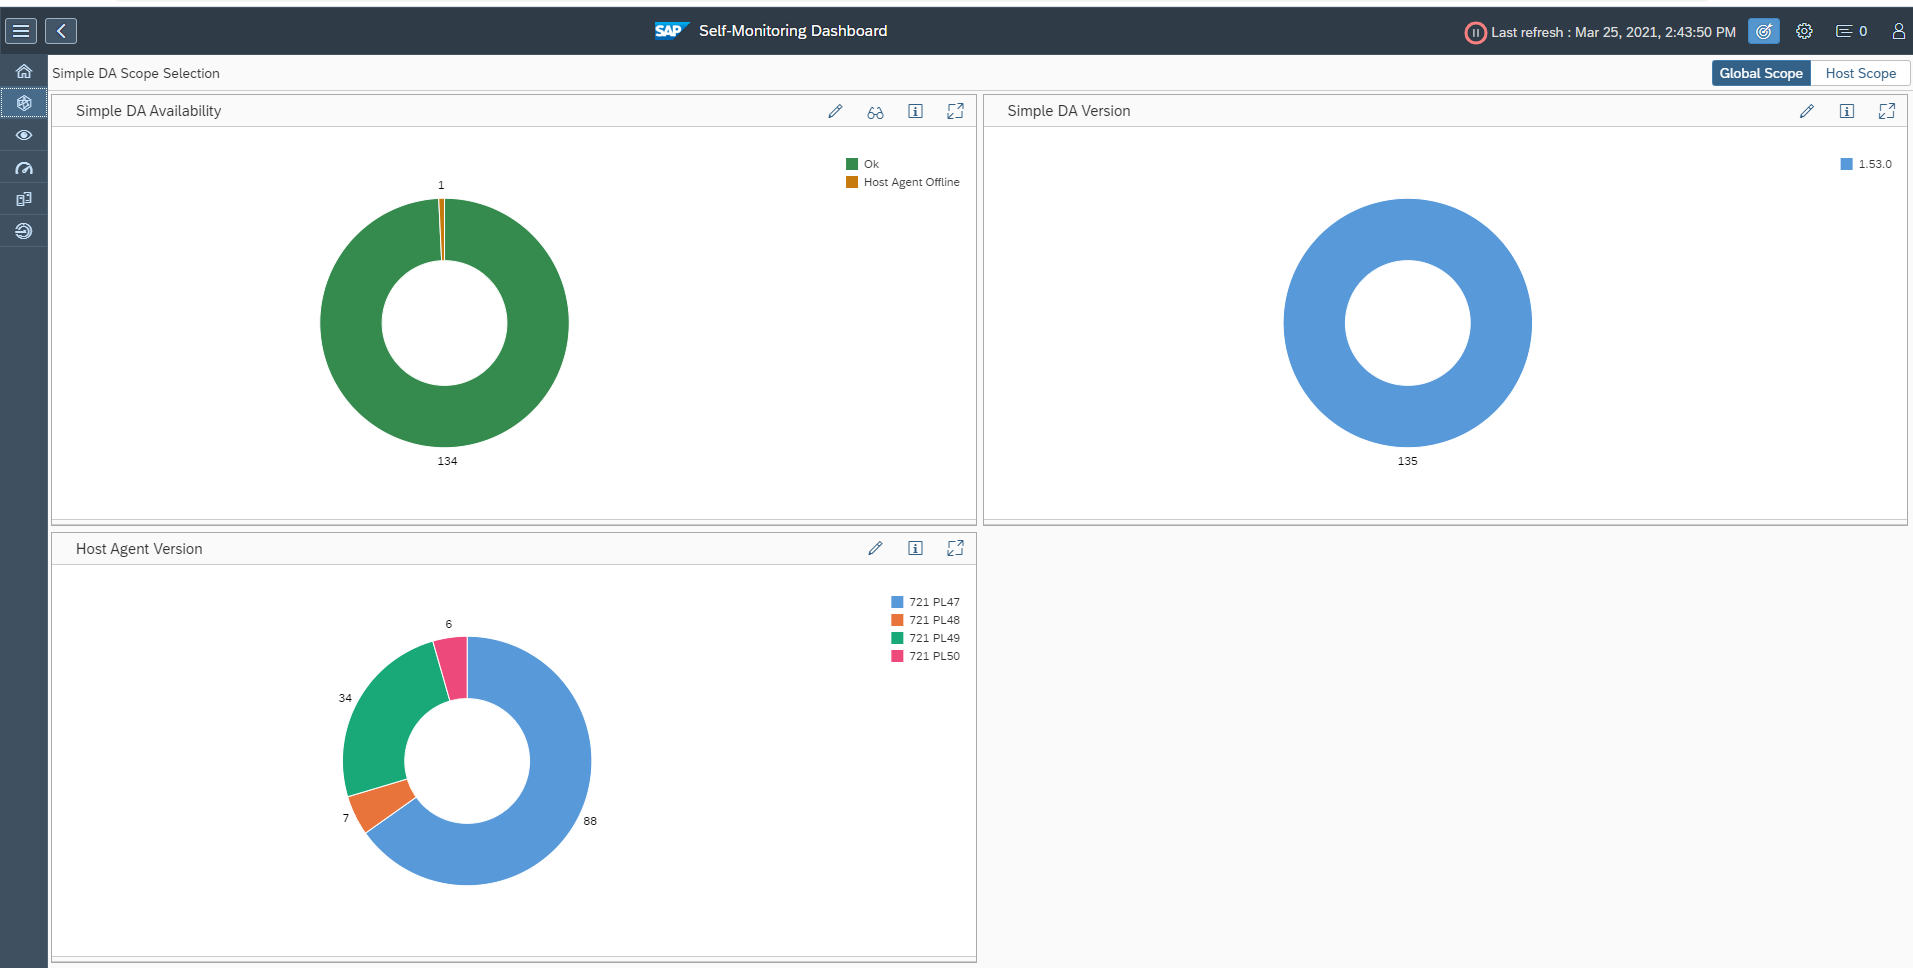
The next option is to check the MAI (monitoring and alerting infrastructure) data collection:
Important here is to fix the systems in error.
Wily Introscope
The Wily option will show if your Wily Introscope connected to Focused Run is ok. Wily is used for special use cases like JAVA and Business Objects products.
Managed system overview
The managed system overview gives the overview of the diverse systems and application status:
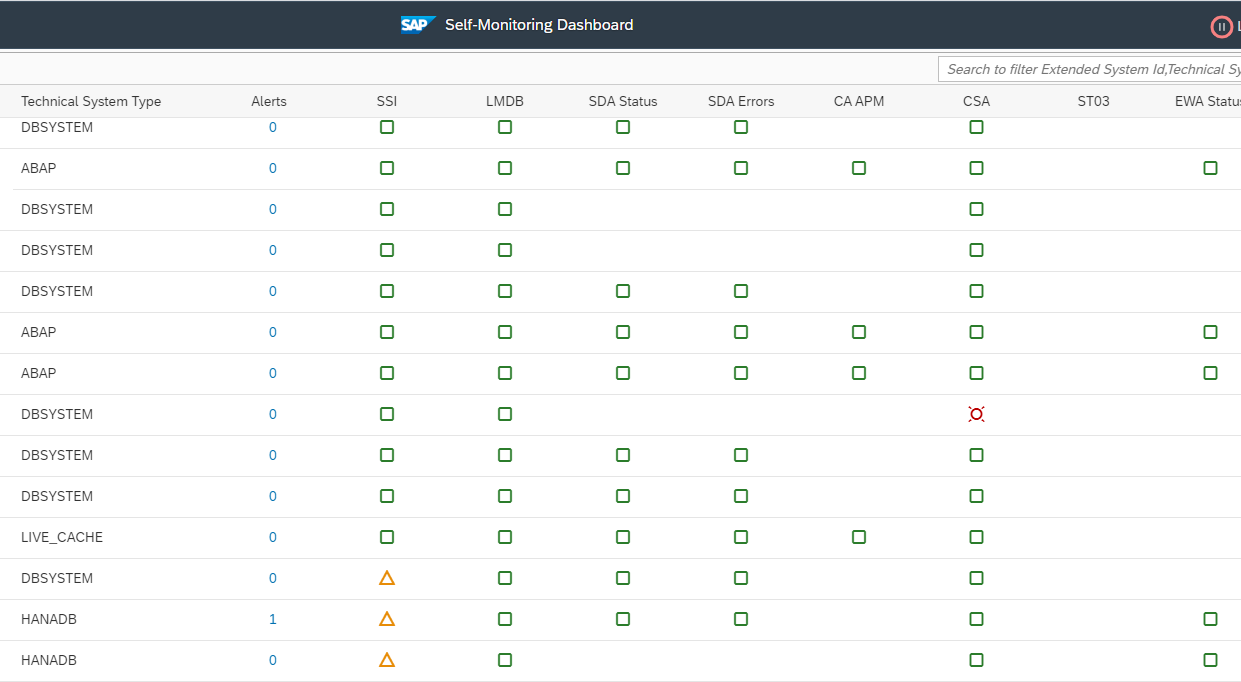
Any red or yellow item can mean a setup issue. But it can also be because of missing authorizations and privileges of the Focused Run technical user in the connected managed system.
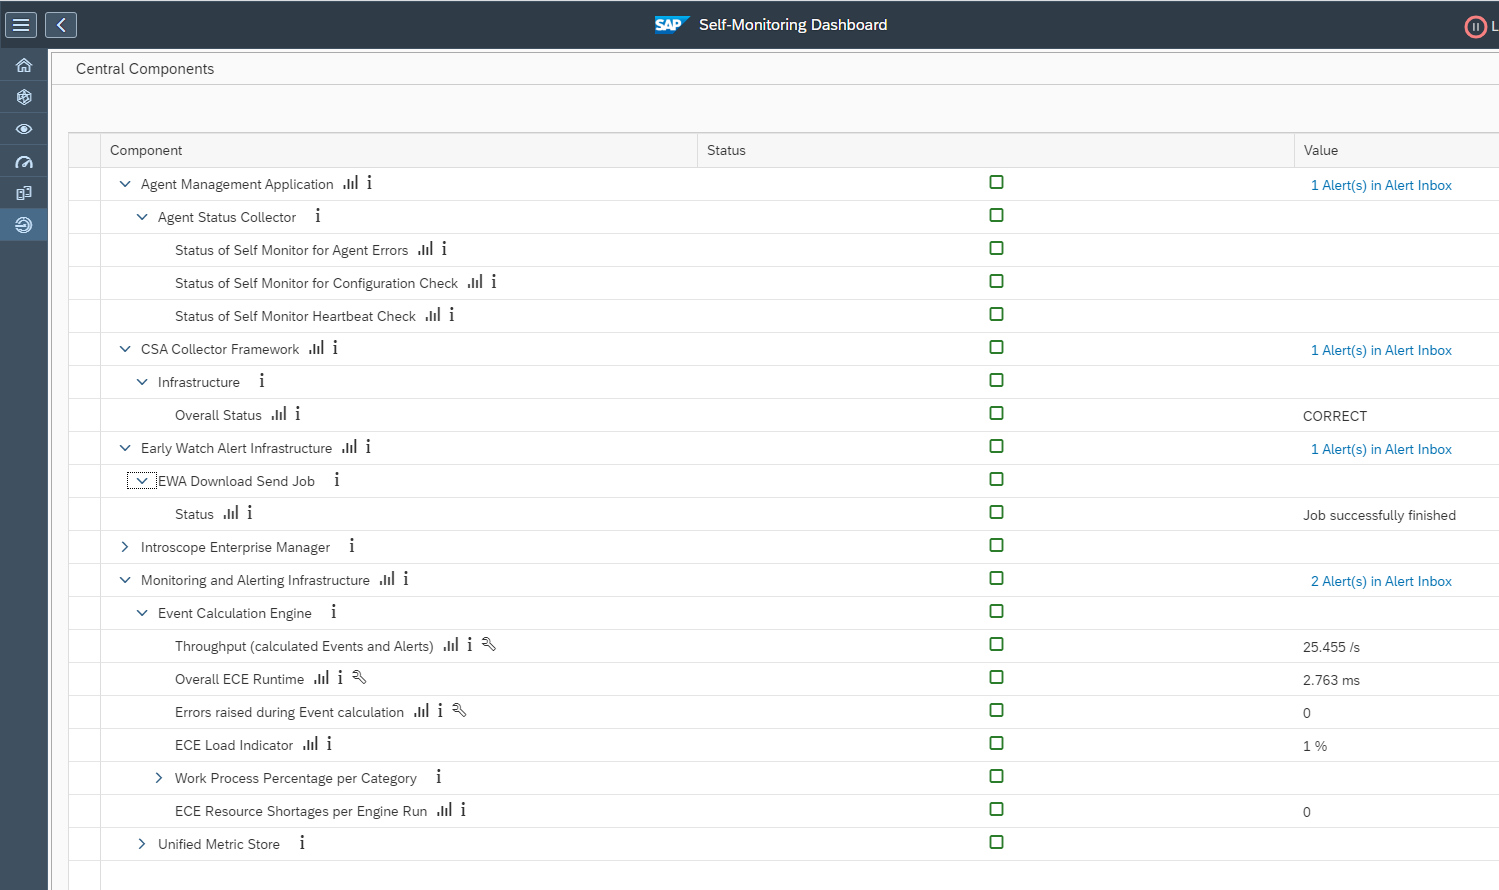
Central component monitoring
The central component monitoring shows the overview of the central components:
Identifying all grey metric in System Monitoring
In SAP Focused Run there is no standard mechanism to identify and display all grey metrics in System Monitoring, a grey metric can cause critical situations not being captured and alerted in monitoring hence we need to monitor such grey metrics.
In this blog we explain how you can list all the grey metrics by directly reading from database tables that store the monitoring data.
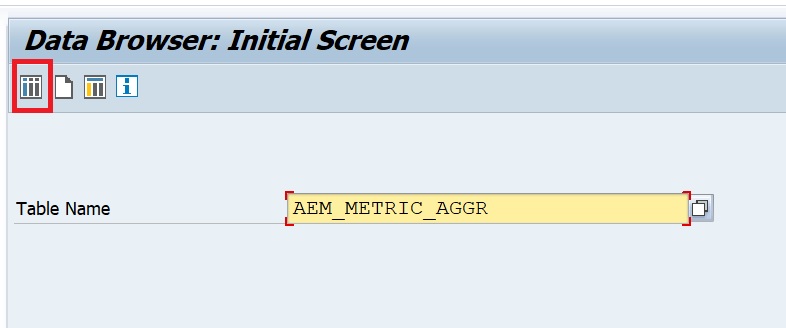
Focused Run system monitoring metric aggregate data is stored in table AEM_METRIC_AGGR. We can filter on metric status = Grey to see the list of grey metrics.
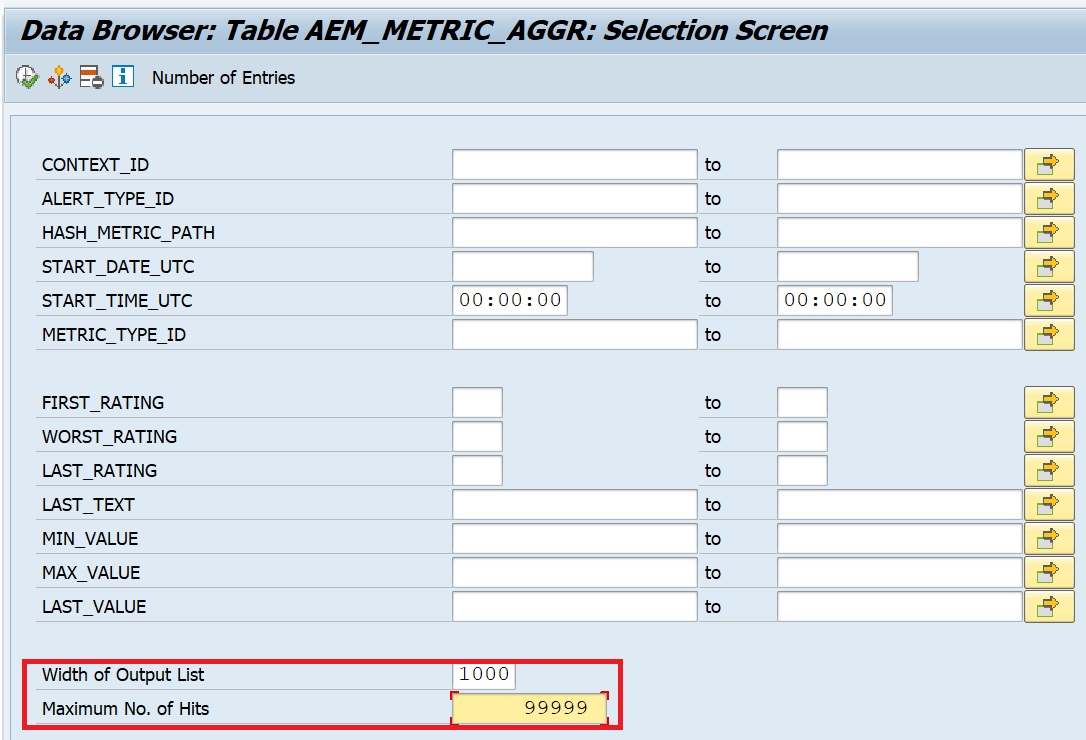
Open the table in transaction SE16:
Increase the width and no of hits and click on execute:
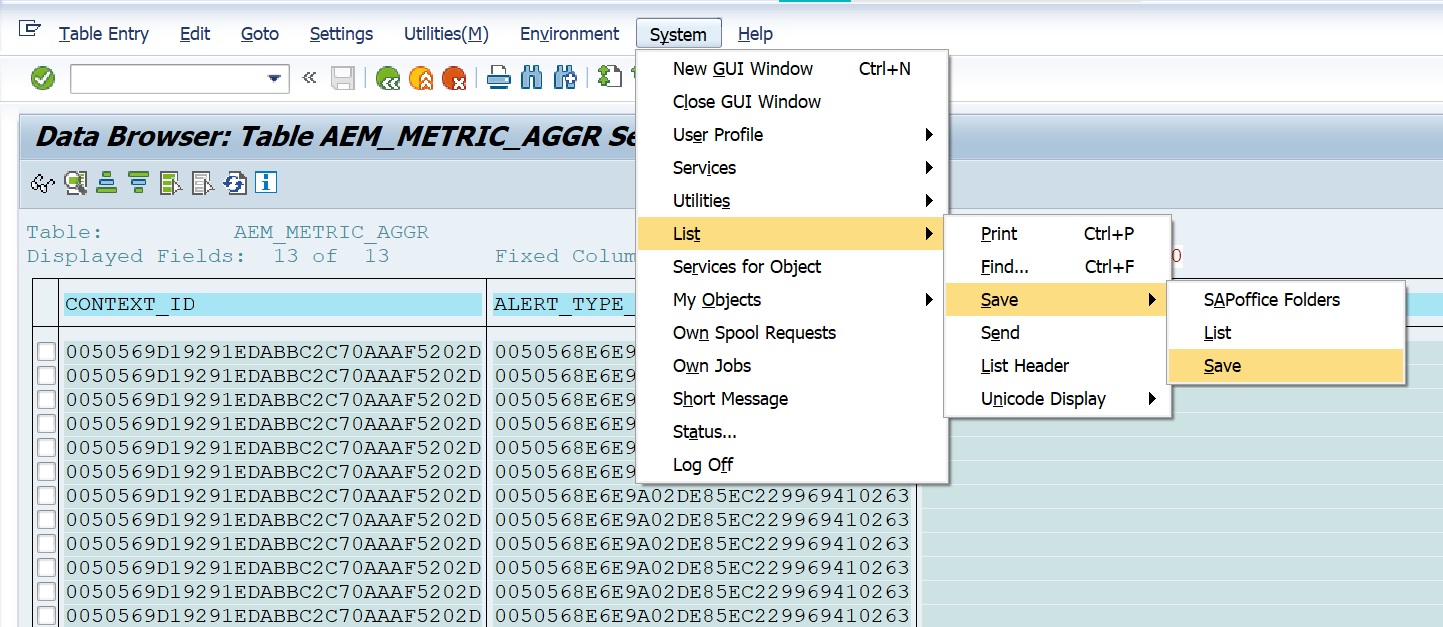
Now you have all the data that you can export to an excel sheet. For this select the following menu option.
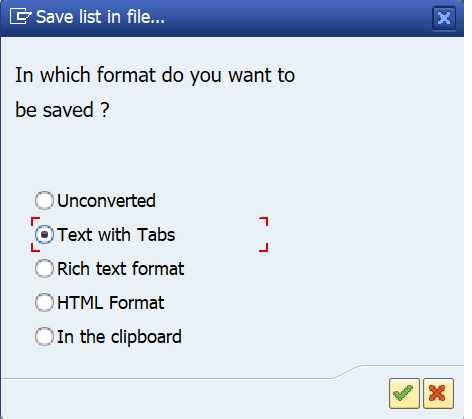
Select file type as Text with Tabs.
Provide the path and filename to save the file and then click on Generate button.
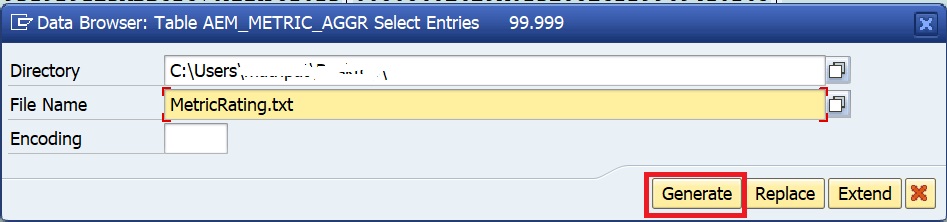
Now open the .txt file in MS Excel.
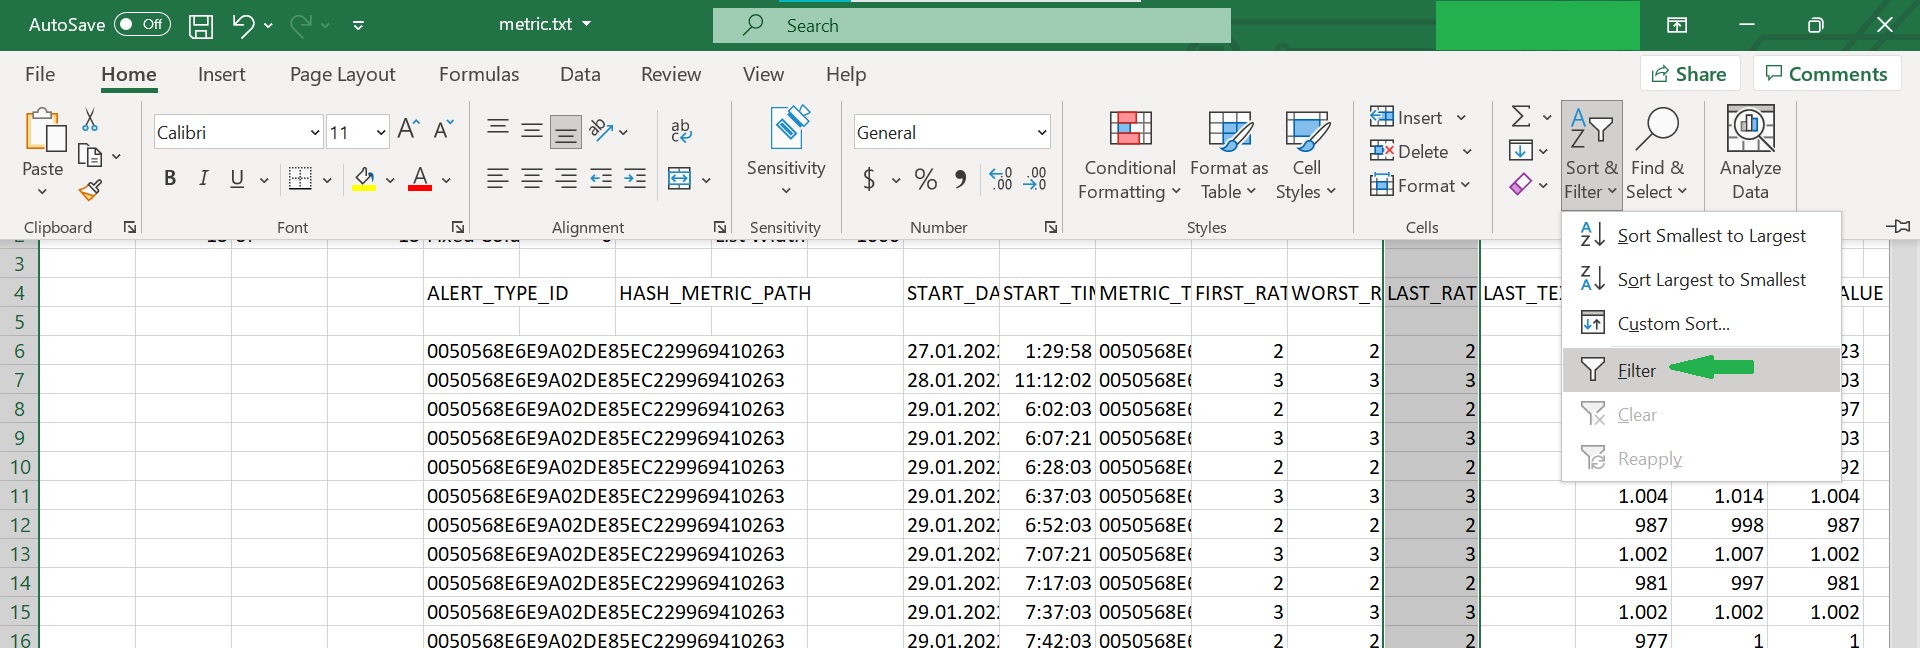
In the Home tab select option for filtering as shown below
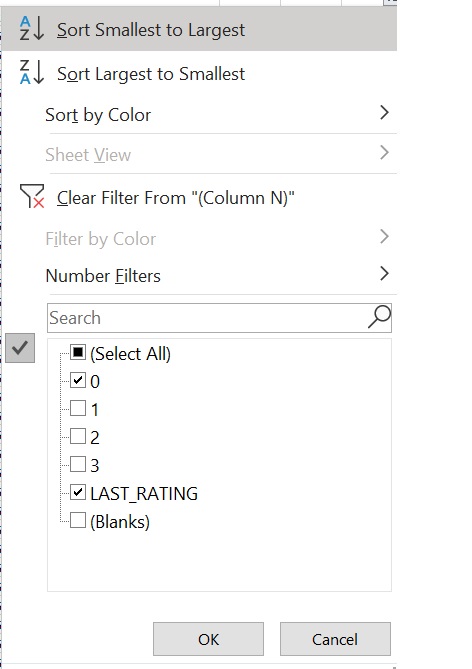
Now set the following filter for the column LAST_RAT
Now you will get the list of all grey metrics as shown below.
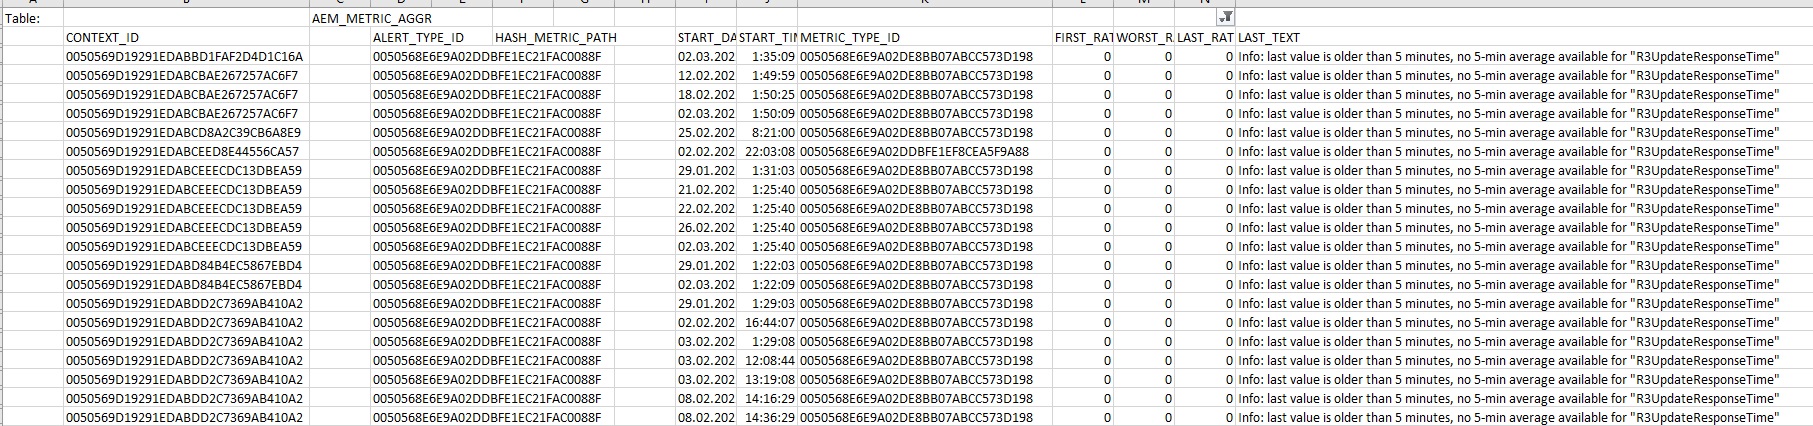
Note: The Context_ID value will give you the ID of the managed object, Metrtric_type_ID will give you the ID of the metric name and the Last_text will give you the return text of the last data collection which will give you the reason for grey metric.
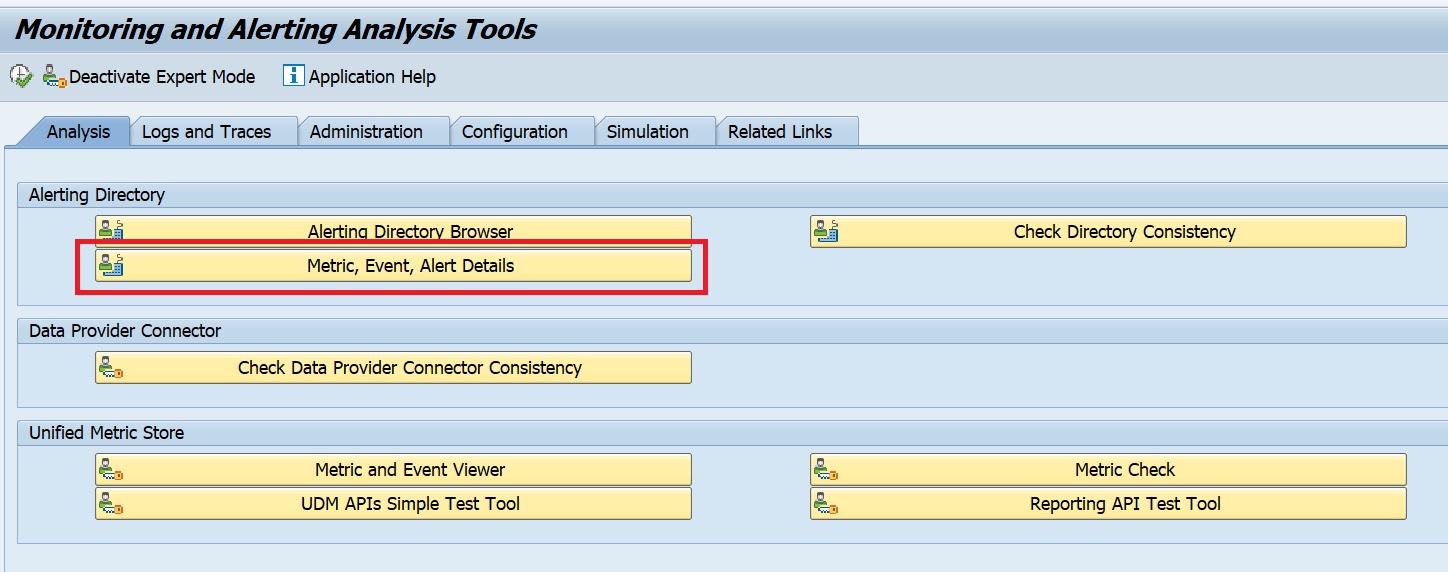
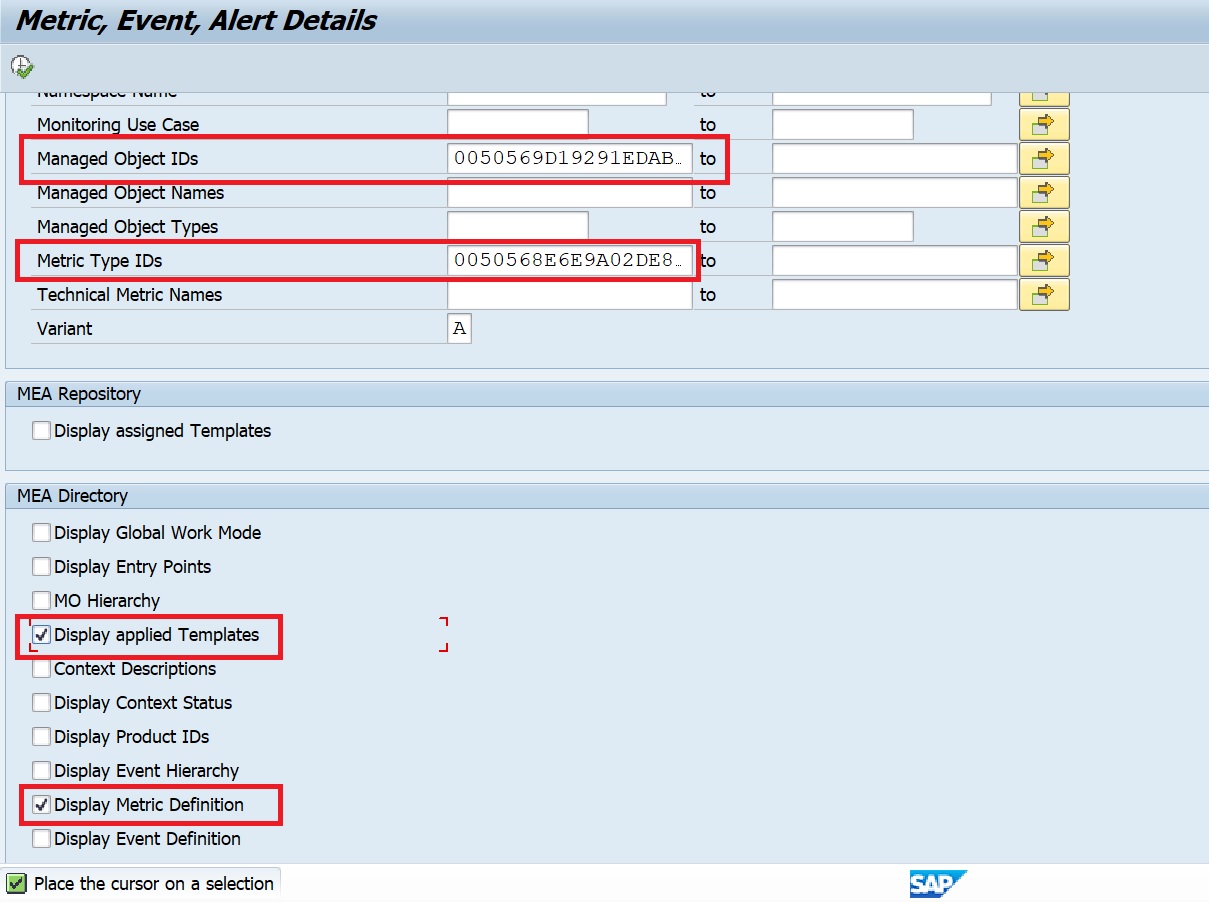
In order to get the managed object name and metric type you can use the following in transaction MAI_TOOLS –> Metric Event Alert Details.
In the selection screen for Managed Object ID enter the Context ID from the excel and for Metric Type ID enter the same from the excel. Also select the checkboxes as shown below and execute.
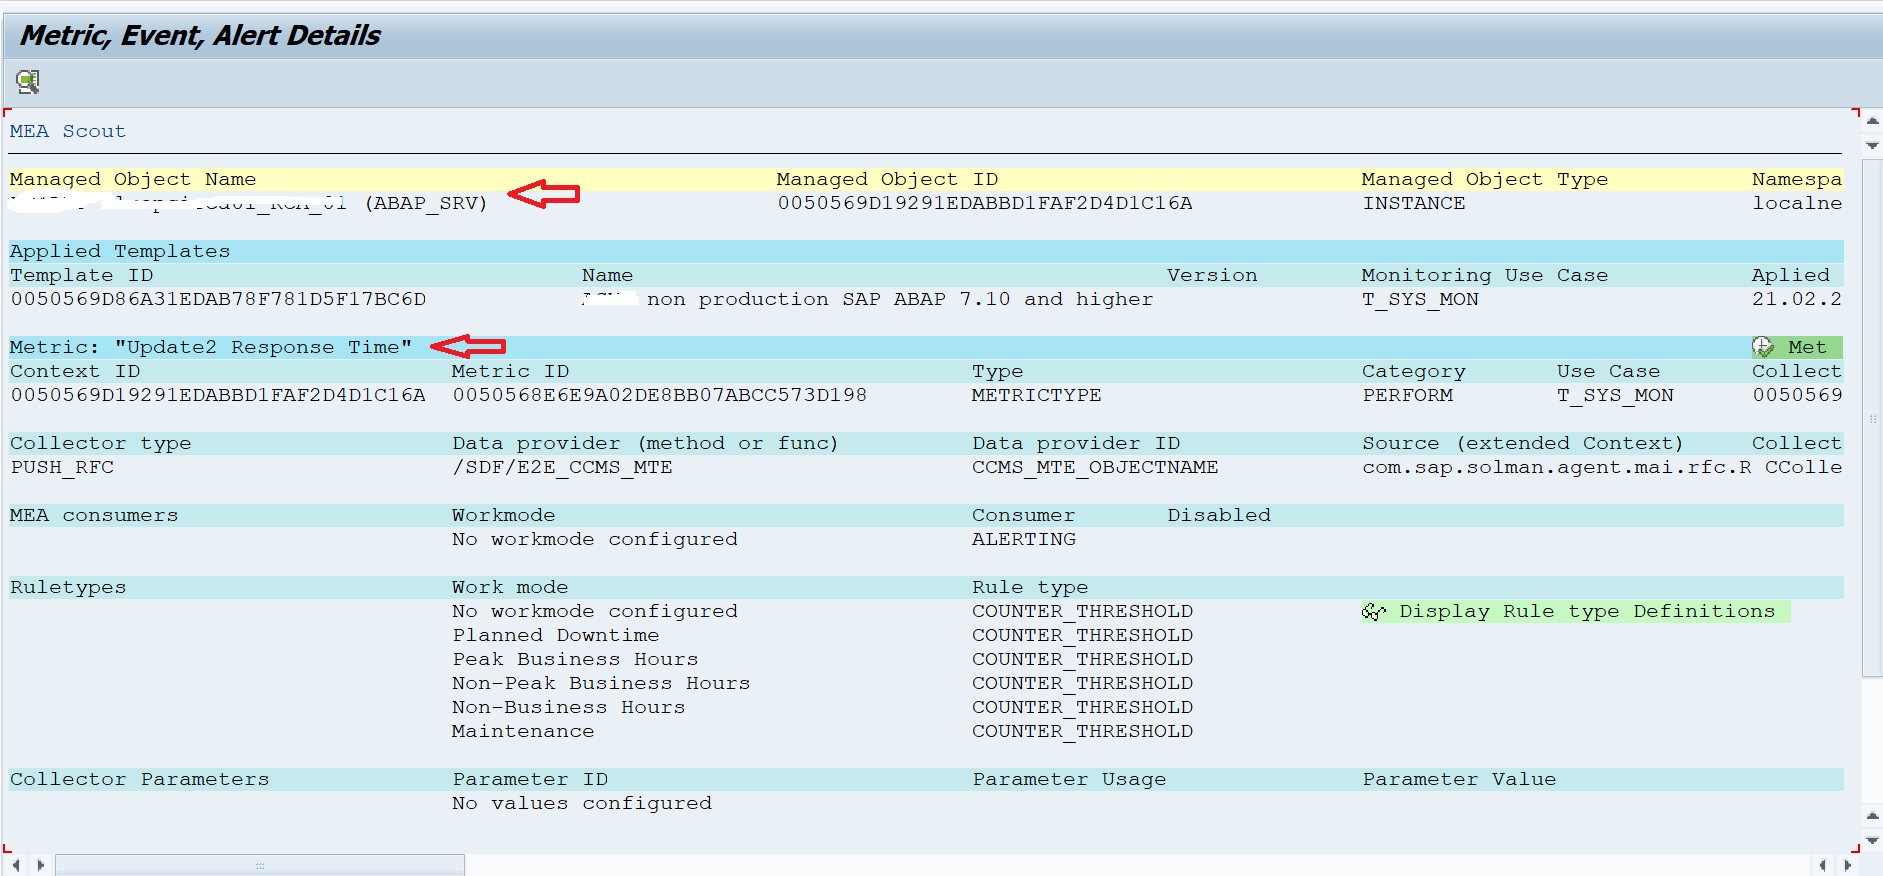
Now you will get the info on the Template as well as the Metric name which is currently in grey.
SAP instructions for grey metrics
You can also check the instructions from SAP in OSS note 2859574 – How to list all current Grey Metrics in FRUN.
Alerting on critical metrics turning grey
It is essential to activate alerting on critical metrics turning grey in order to avoid missing critical issue not getting detected by Focused Run.
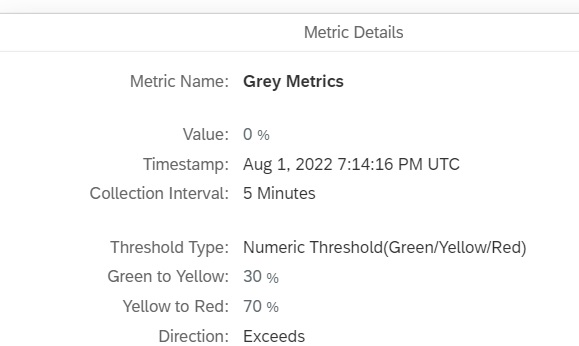
Since SAP Focused Run 3.0 FP2 , a new metric has been added to the self monitoring template in System Monitoring, the Grey Metrics metric measure what percentage of critical metrics in Grey.
This metric by default uses threshold 30% for Yellow and 70% for Red rating. You can change this threshold to show red if value crosses more than 1% so that if there are any critical metric that is in grey then alert is raised.
Note: This metric considers only those metrics which are marked as critical in Self Monitoring app. The percentage is calculated based on how many metrics out of the metrics designated as critical metrics in Self Monitoring app are in Grey.
To designate a metric as critical metric navigate to Self Monitoring App in Focused Run launchpad –> Infrastructure Administration.
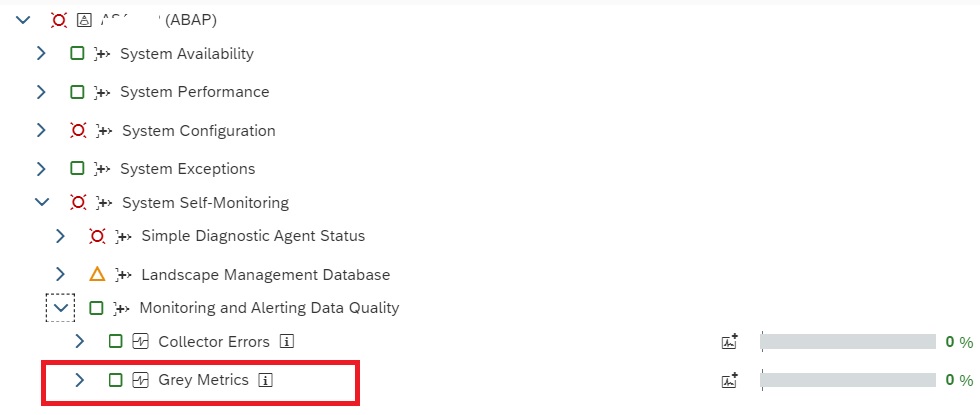
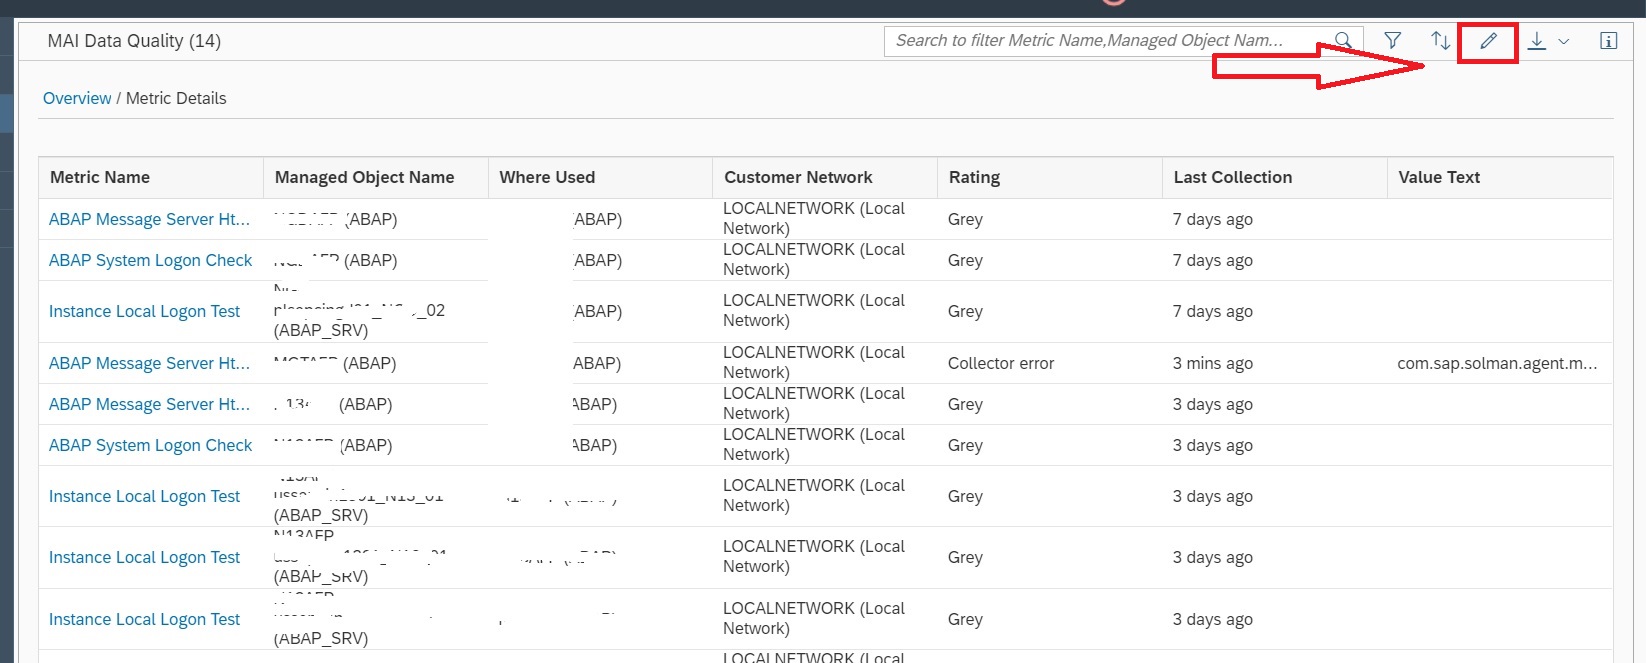
In the Self Monitoring app navigate to MAI Data Quality.
In the Overview screen select the Managed System type to go to its details screen.

In the Details page it shows list of systems with their critical metrics that are in grey. To modify the list of designated critical metrics click on the chnage button.
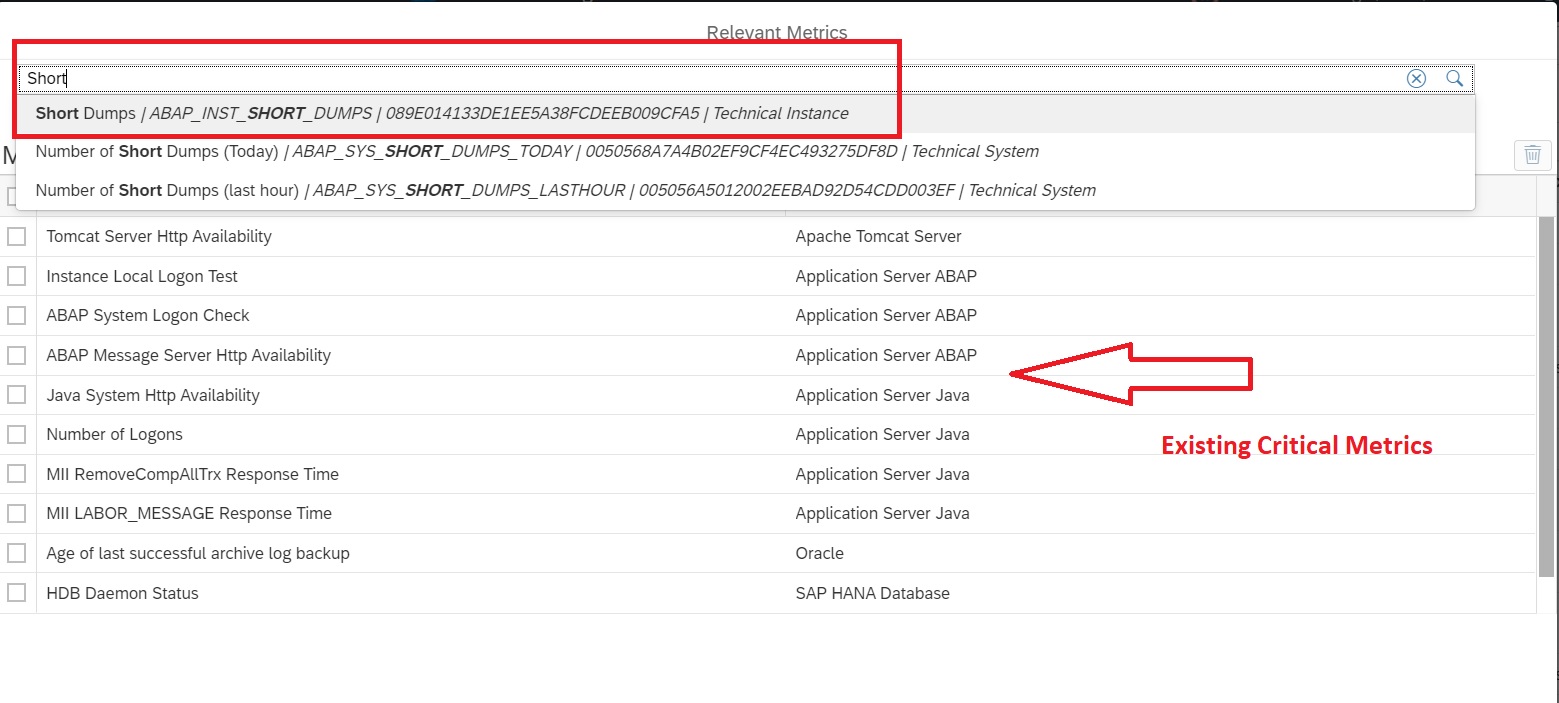
In the new popup use the text search button to enter the text of the metric you want to add to the list.
Finally click on the “+” button and then click on close to save the added metric in the critical metric list.
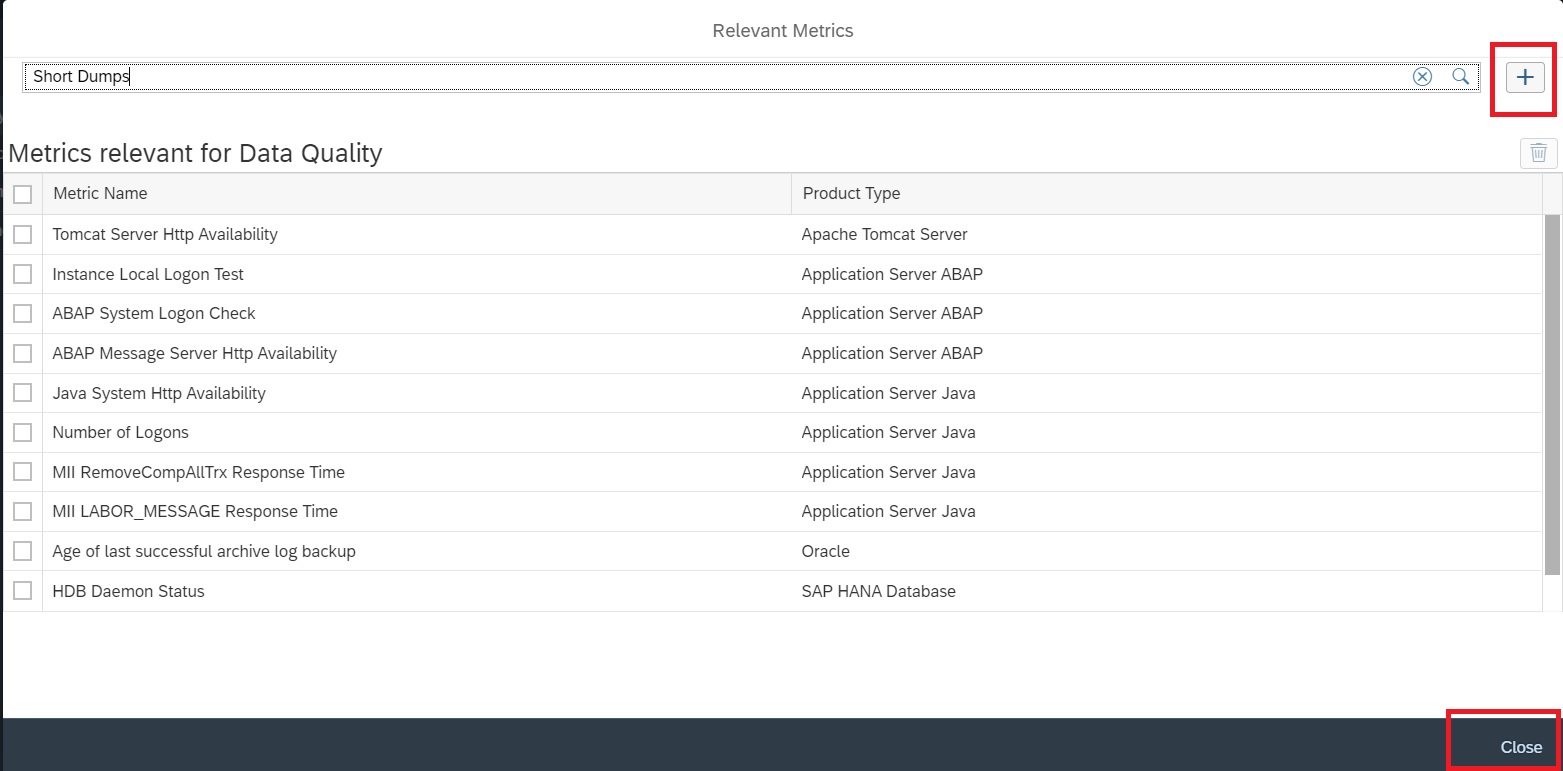
Now the added metric will be considered as critical metric while calculating % of Grey Metrics.
<< This blog was originally posted on SAP Focused Run Guru by Frank Umans and Manas Tripathy (Simca). Repost done with permission. >>