manage the figures you need for service availability management:
- Uptime of the system
- Planned and unplanned downtime of the system
All service availability management functions are present using this Fiori tile:
On the left hand side there is the menu with all options:
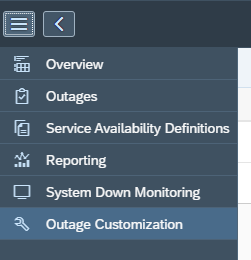
Service availability management definitions
There are 2 definitions we need to configure:
- The outage customization
- Service availability definitions
First we start with the outage customizing:
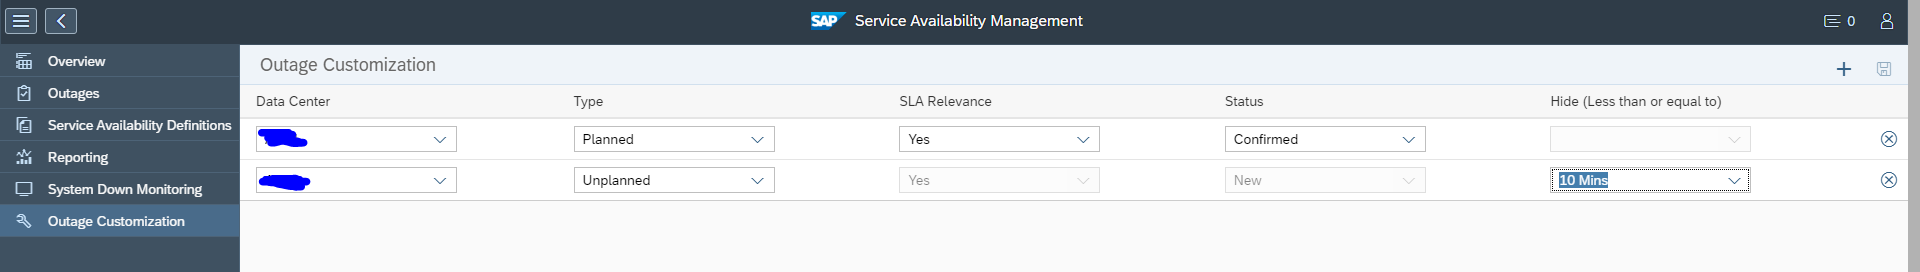
Make the required settings for planned and unplanned downtime.
Now you add a new service management definition:
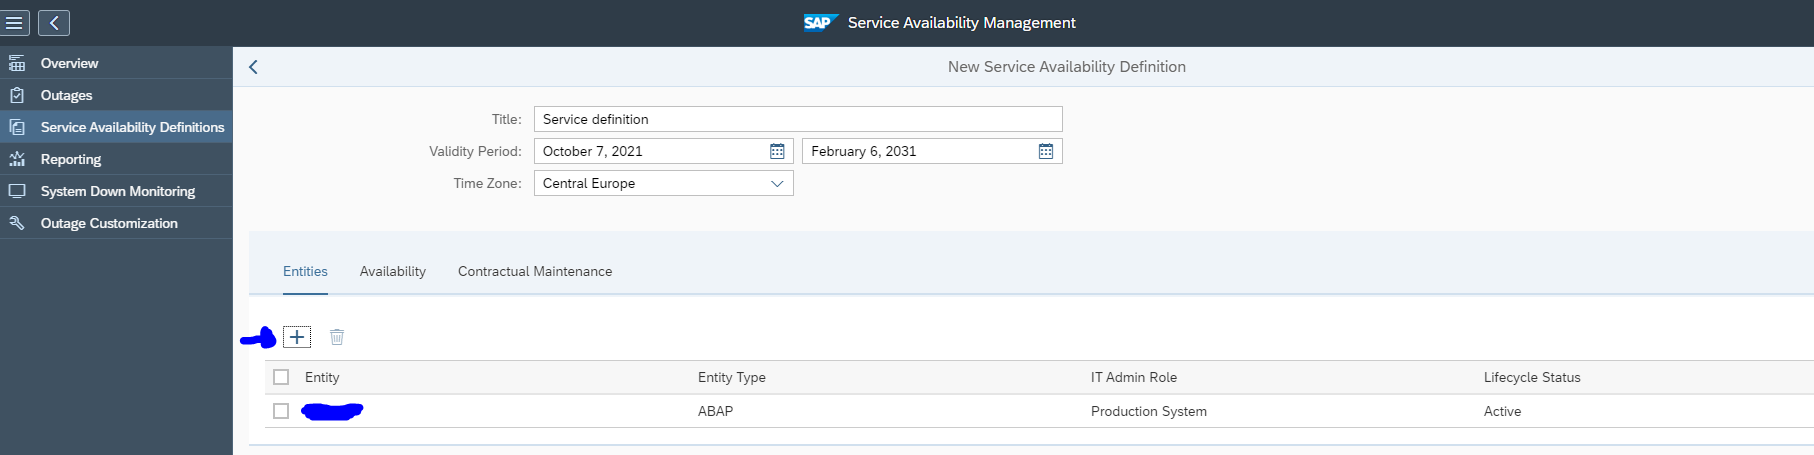
Provide a name and validity date for the definition and use the + symbol to add systems for which the definition is relevant.
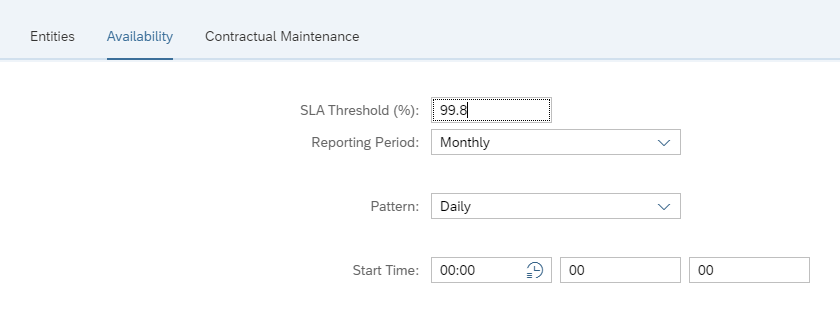
In the tab availability set the SLA threshold for the availability percentage:
If relevant you can set specific contractual maintenance time in the last tab:
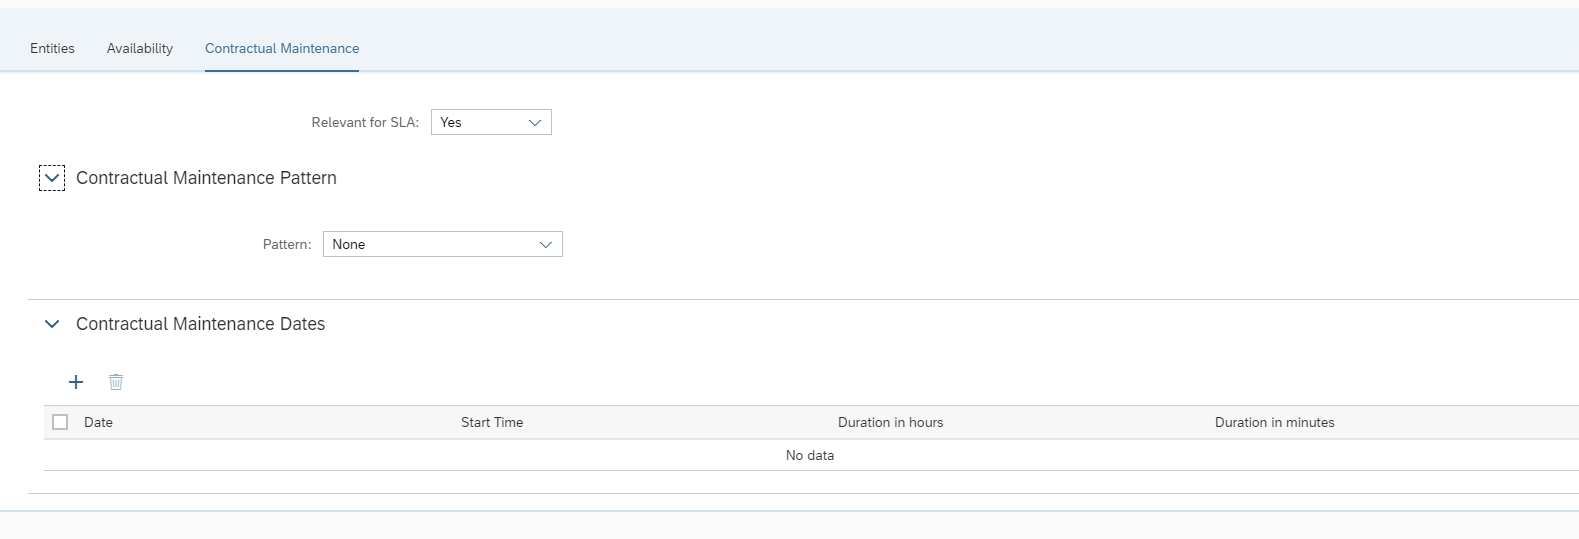
Example of use for this tab: you are running your SAP system hosted on for example AWS or Azure. Those platforms can have scheduled maintenance as well. That is not in your control.
Carefully check your entries and definition before saving. They cannot easily be changed later!
You cannot delete an active definition. To make it inactive you need to change the end date of the definition to today, and then delete it next day.
Each system can only be in one SLA definition!
Classifying the outages
On the Outages overview you can see the outages. The outages can be 0, or there can be open and/or confirmed outages:
Click on the open alert to classify it (click once for the line, click on the line for the details):
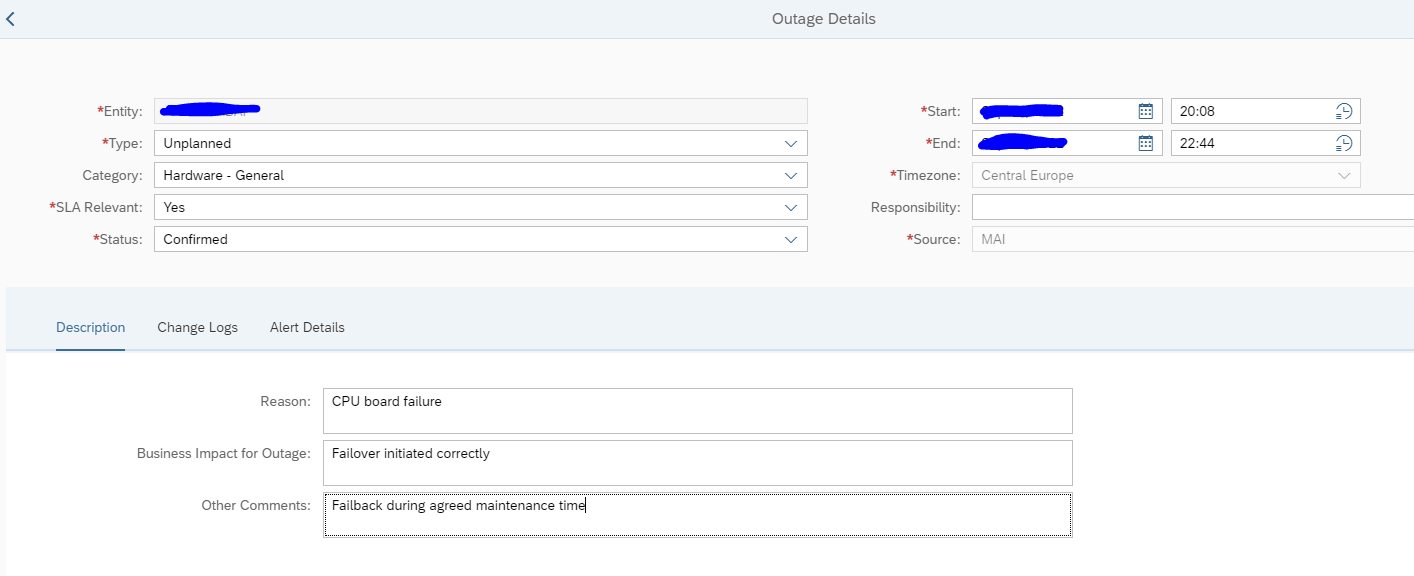
Classify the outage (planned/unplanned) and set the status. Fill out the text to clarify. And then save the update.
Outage reporting
There are 2 main reports. The uptime and outage reporting. The uptime reporting shows how long your system is up since the last reported planned or unplanned downtime. This overview is not so useful.
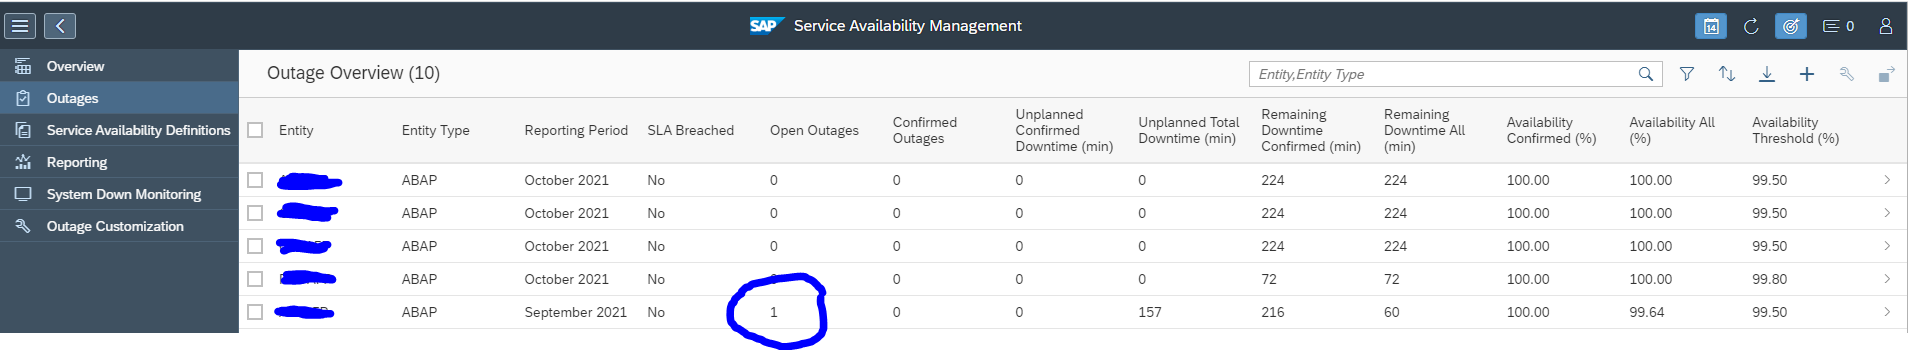
The useful overview is the outage reporting which shows you the downtime per system and per month:
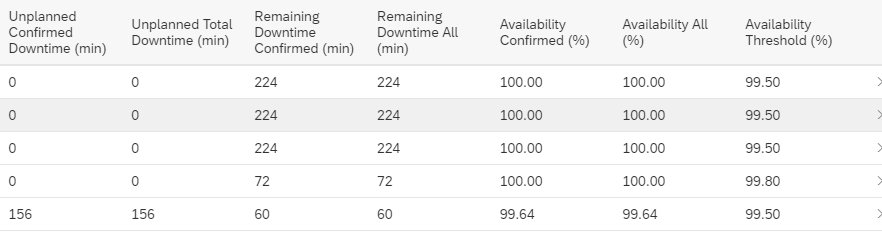
In the example above 1 system had outage, but that was short enough to still meet the SLA target. Availability was 99.64% versus SLA target over 99.5%.
<< This blog was originally posted on SAP Focused Run Guru by Frank Umans. Repost done with permission. >>