In System Monitoring of ABAP systems in Focused Run, with the standard monitoring template, we can monitor the frequency of ABAP dumps.
For monitoring if there are dumps of a specific type we have to create a custom metric. In this blog we explain how.
For creating a custom metric in the monitoring template, open the Template Maintenance App in the Advanced System Management area of Focused Run Launch-pad.
Note: You can’t add a custom metric to a SAP delivered standard template. For that you will have to copy the standard template to your own custom template.
Open your custom ABAP instance level template in edit mode.
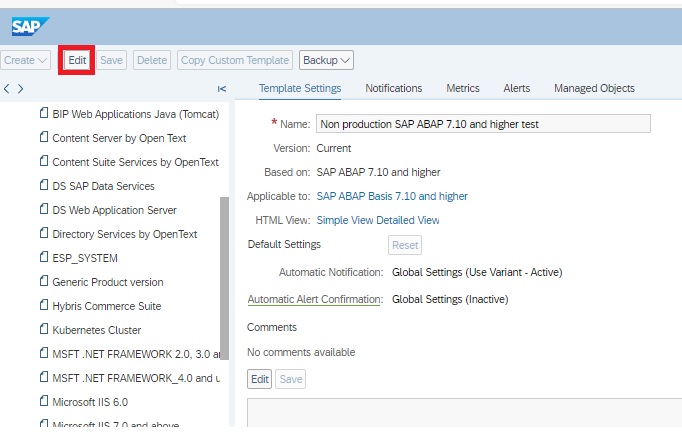
Switch to expert mode for template maintenance.

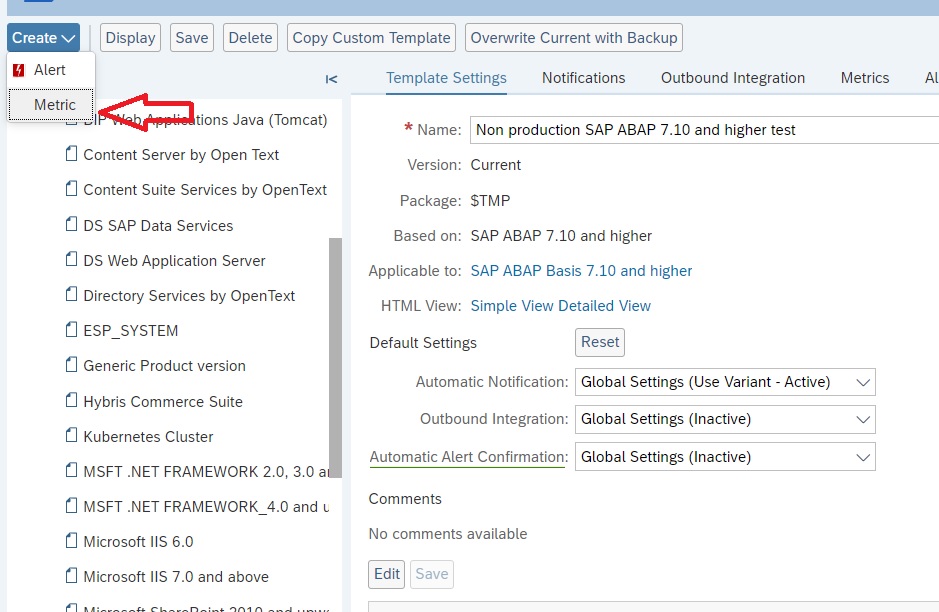
Click on Create –> Metric to create a custom metric.
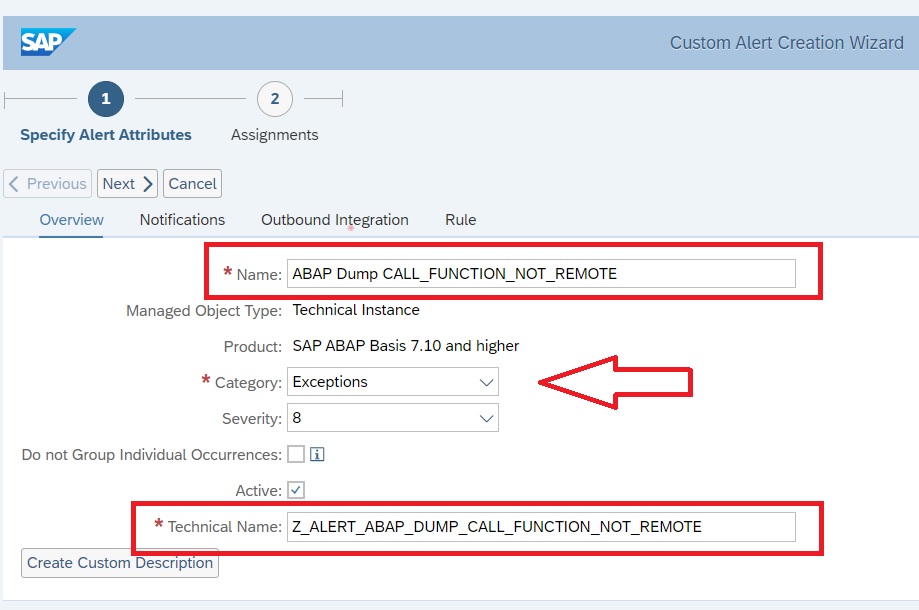
Provide a Name, a Technical Name and metric type in the Overview tab as shown below.
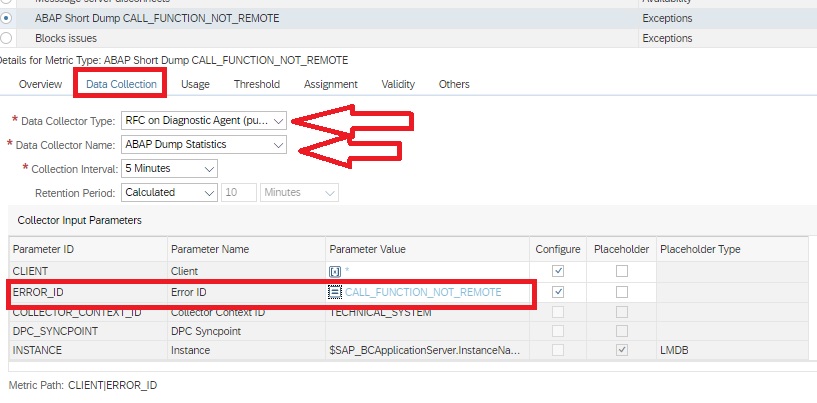
In the Data collection tab enter details as shown below. Here for the parameter Error_ID you can provide the ID of the specific ABAP dump that you want to monitor.
Navigate to Threshold tab to specify the Threshold type and Threshold. For instance in this example we have specify the threshold to rate the metric as reed if there is 1 or more of the specific dump.
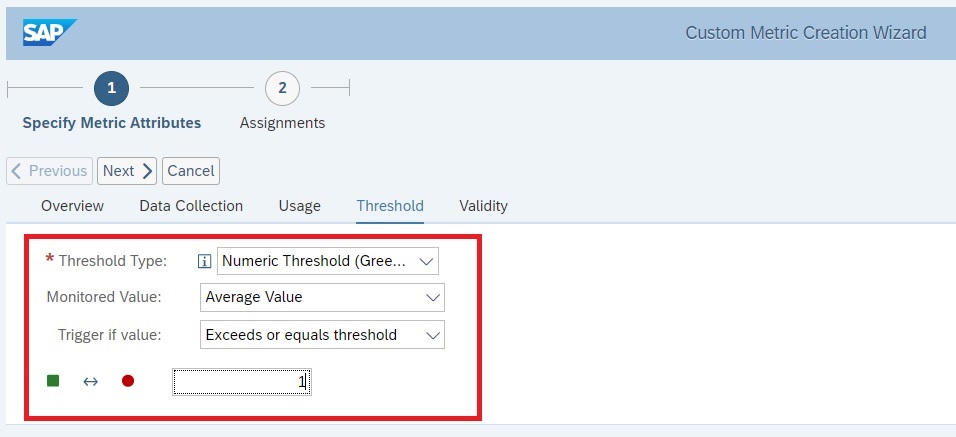
Now you can click on Next and then Finish button to save the metric.
Next you need to create a custom alert to generate a specific alert for this specific dump.
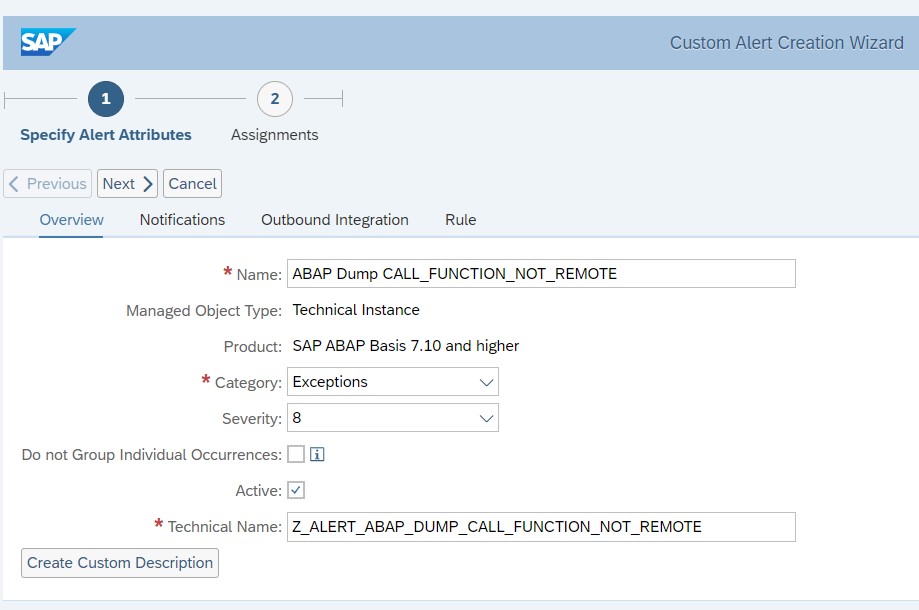
In the expert mode maintenance go to the Create button and then from the drop down select Alert.

Enter the details as shown below and click on Next button.
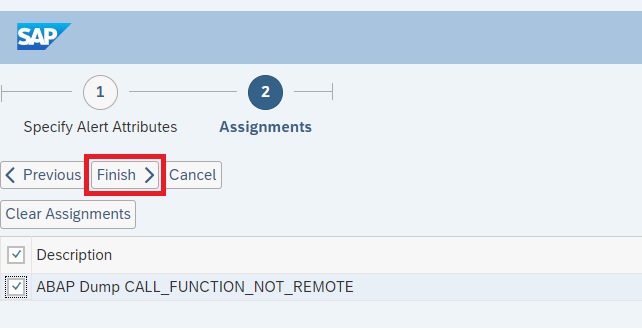
Then in the Assignments tab you will see the custom metric you just created. Select the check box for this metric and click on Finish to save the alert.
Now your custom metric is ready together with alerting active.
To activate this template update on all managed systems navigate to Managed Objects tab for the template and click on Apply and Activate button.

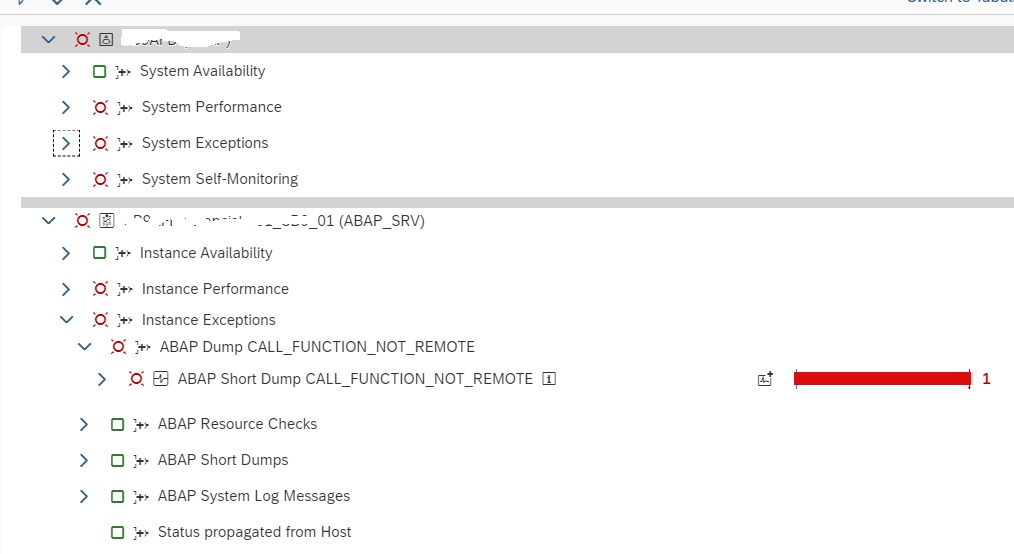
Now you can see custom metric under instance level in system monitoring.
Thanks Manas!
Very helpful except you are missing the screenshot after:
In the Data collection tab enter details as shown below. Here for the parameter Error_ID you can provide the ID of the specific ABAP dump that you want to monitor.
Still haven’t gotten this to work, but it definitely helped me get started.
Hi Dave,
Thanks for your response. Is your metric grey or green but not capturing the alert?
BR
Manas
Hi Dave,
Updated with screenshot from monitoring. Just figured out that this data supplier only works at instance level. So ensure to create the custom metric at instance level.
Thanks for notifying the issue. We have now updated this blog/.
BR
Manas
Hi Dave,
Also updated the screenshot where you can specify the dump name you want to monitor in the data collection settings.
Please let us know if your issue is resolved.
BR
Manas
I am not able to get this “ABAP DUMP STATISTICS” data collector under RFC on Diagonostic Agent (PUSH). Please help
Hi Soumyajit,
The data supplier works only at instance level. Ensure you create the metric in the instance level template.
BR
Manas
Hi Manas,
I have checked under technical instance template only but still I cannot see any such data collector name (ABAP DUMP statistics) under type RFC on Diagnostic Agent(Push). Please help.
I have checked under instance level templates only but right now there is no such data collector present named as “ABAP Dump statistics” please check and help me
Hi Soumyajit,
Please update the monitoring content to the latest, it seems you are using a old content. Also what version of FRUN do you use?
BR
Manas
Hi Soumyajit,
It seems you are using an old monitoring content. Please update the ST-CONT to latest. Also what version of FRUN are you using?
BR
Manas