In most cases a fine tuning of an existing SAP template is sufficient for your needs.
In some cases you want to have your own metric defined to monitor a special part of the SAP system. This own created metrics are also called custom metric.
SAP, when you read this blog, please feel free to copy any of the custom metrics below into the standard SAP set. This will help everybody.
Questions that will be answered in this blog are:
- How do I create a custom monitoring metric?
- Do I need to re-create the custom metric per monitoring template?
- What are examples of custom metrics?
Creating custom metric
In this example we create a custom metric to make sure that the background user WF-BATCH is not locked by accident.
There is already a metric in the ABAP template that is called User Lock Status. This can be used as a basis for our custom metric.
Goto your template into change mode and on top left choose Create (you need to be in Expert mode first):
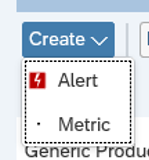
And select Metric. Now the screen opens for a new metric creation:
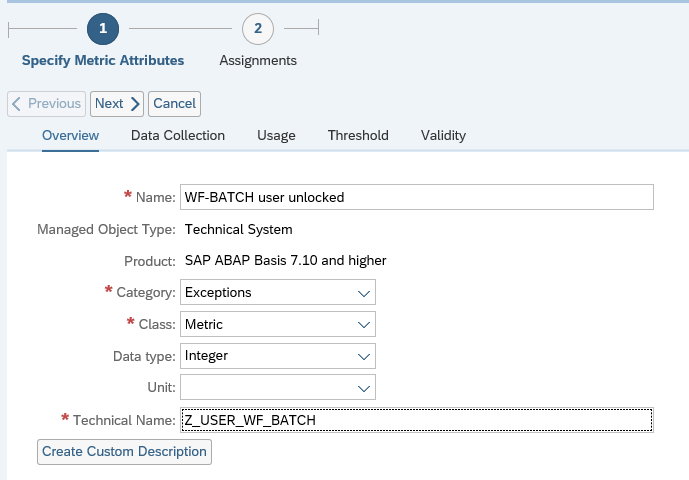
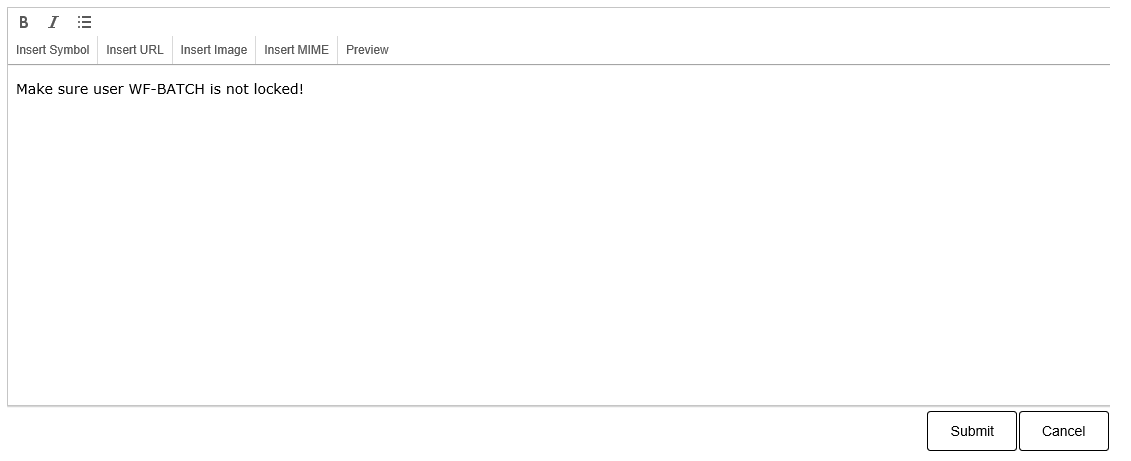
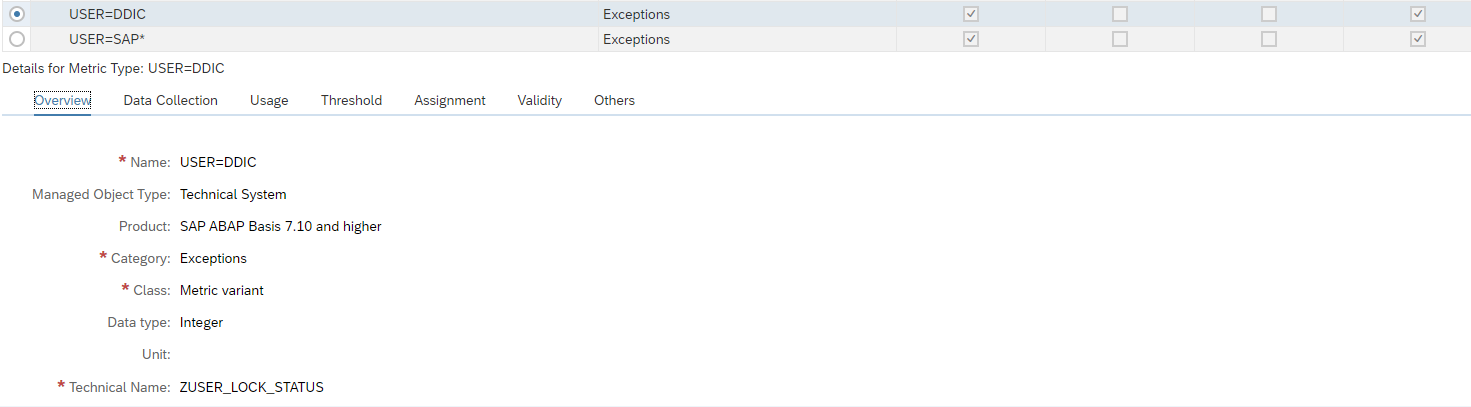
Fill out the details, and create a custom description:
Now go to the tab Data Collection:
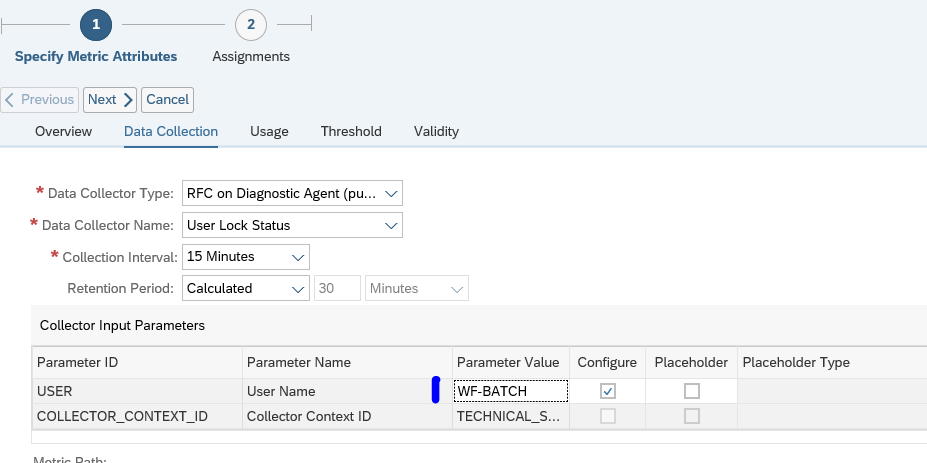
Copy the data from your reference metric here. Don’t forget to fill out the Parameter Value. In this case WF-BATCH. Also make sure you have a reasonable Collection Interval timing. Not everything is need to be collected every 5 minutes.
Now go to the tab Threshold:
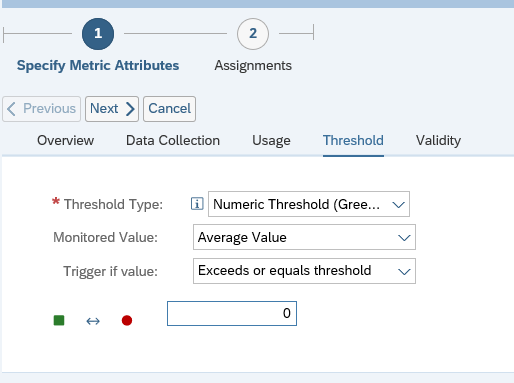
Configure your threshold setting.
Now press the Next button and assign the metric to the correct group:
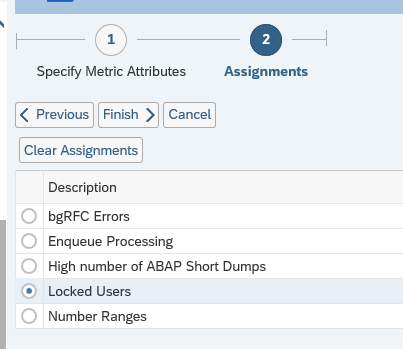
Now press Finish to save the metric.
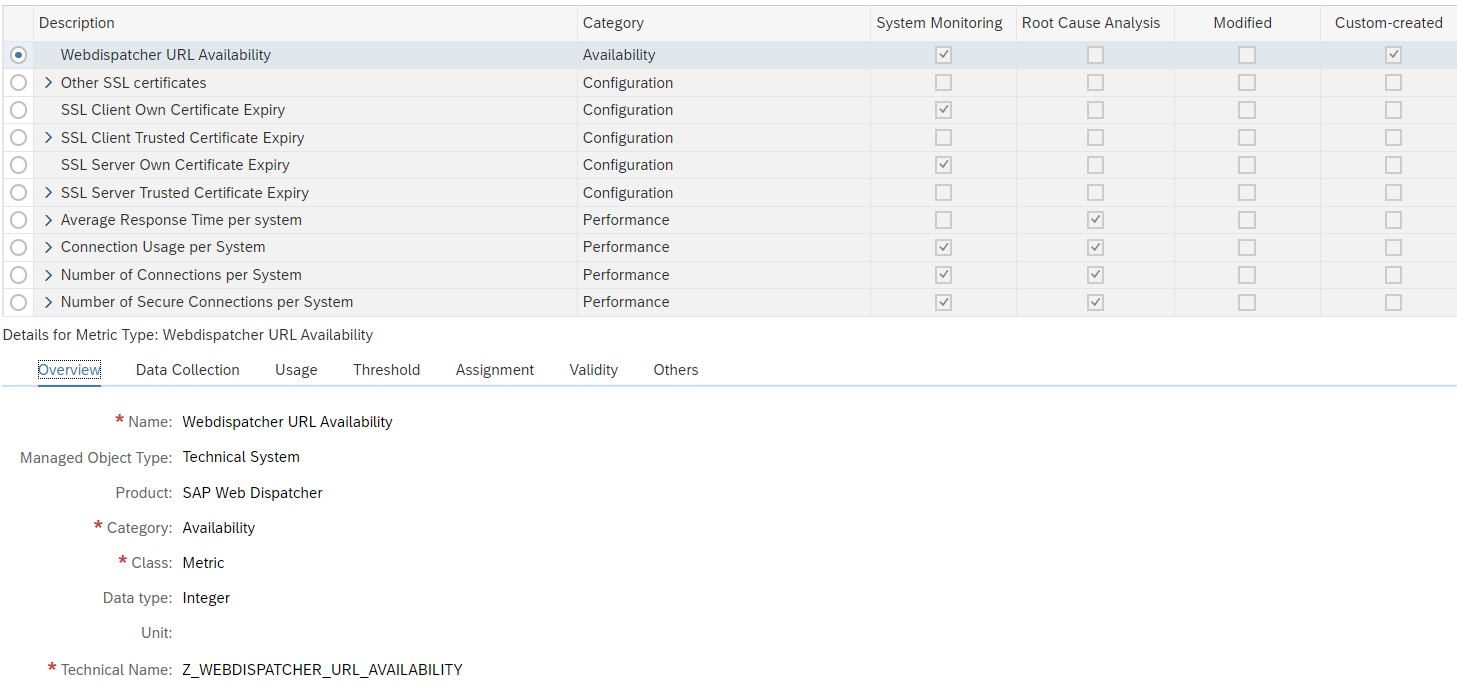
The new custom metric is now available in the monitoring template:
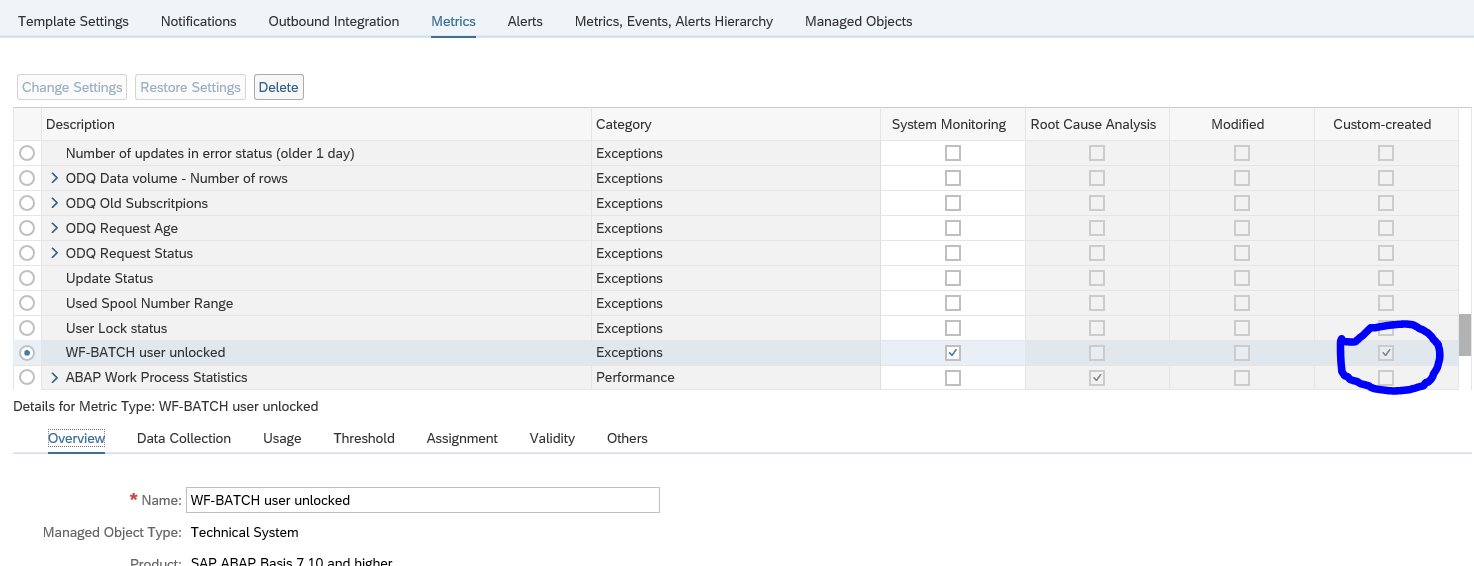
You see that this one has the Custom created marked. Later you can use the filter on Custom created column to quickly find it again.
Deploying custom metric to other templates
If you have to deploy the custom metric to other templates: so far this is a manual action. Per template you have to re-create the same custom metric. I have not found a nice way of re-using custom metrics yet.
List of other custom metrics
See below:
- Checking for certificates that are about to be expired and already expired certificates (in stead of only one out of the box metric that contains both)
- Checking web dispatcher URL
- Detecting errors in table locking of TBTCO
- Detecting long running DIA processes
- Detecting no more free work processes
- Detecting OS signals
- Detecting PRIV modes
- Detecting message server disconnects
- Detecting missing hardware ID
- Detecting resource exhaustion in ABAP system
- User lock status of DDIC and SAP*
- Checking for specific logon group to be active and working
- Detecting file system mounted
- Detecting specific ABAP short dumps
For system log message read OSS note 3391086 – Grey Metrics for ABAP Syslog.
Detecting errors in table locking of TBTCO
From availability perspective, you want to detect as quickly as possible if you are suffering from locking errors of table TBTCO. TBTCO table is used for printing. If the locking error situation occurs the printing function will fail, and even worse, it can impact the complete SAP ABAP system.
You can create a custom monitoring metric to measure and act on this.
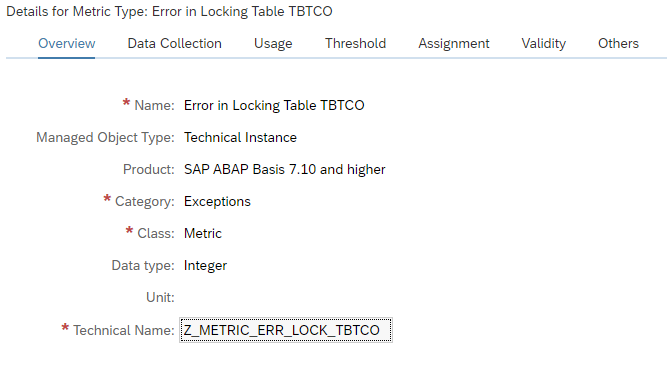
Create technical name Z_METRIC_ERR_LOCK_TBTCO:
In the data collection:
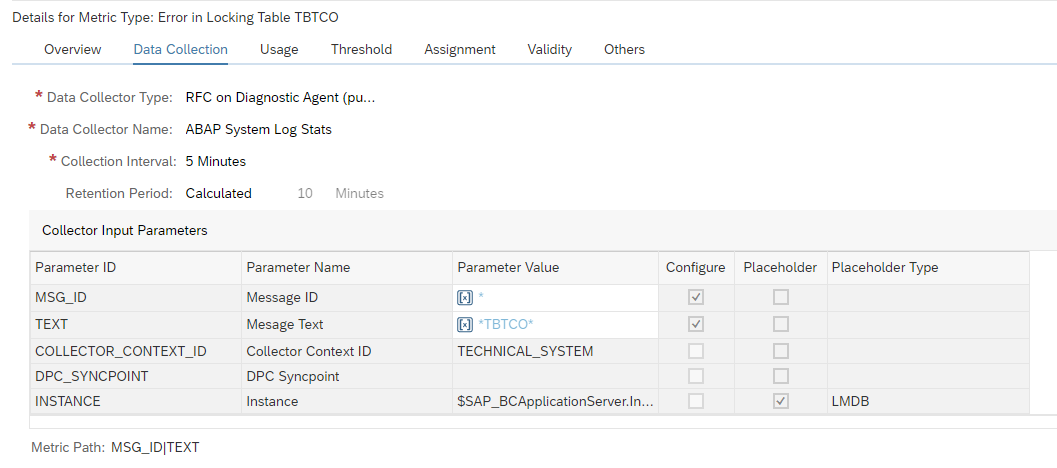
Data to enter: RFC on diagnostics agent (push). Select ABAP System Log Stats. Filter on message text *TBTCO*. This captures severe errors for TBTCO like the locking error.
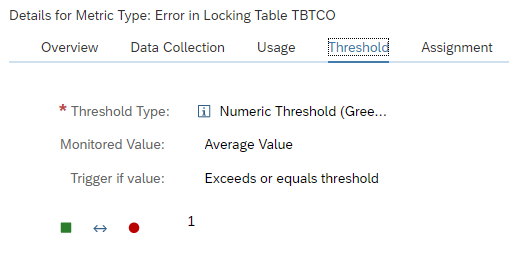
Define the threshold for alerting:
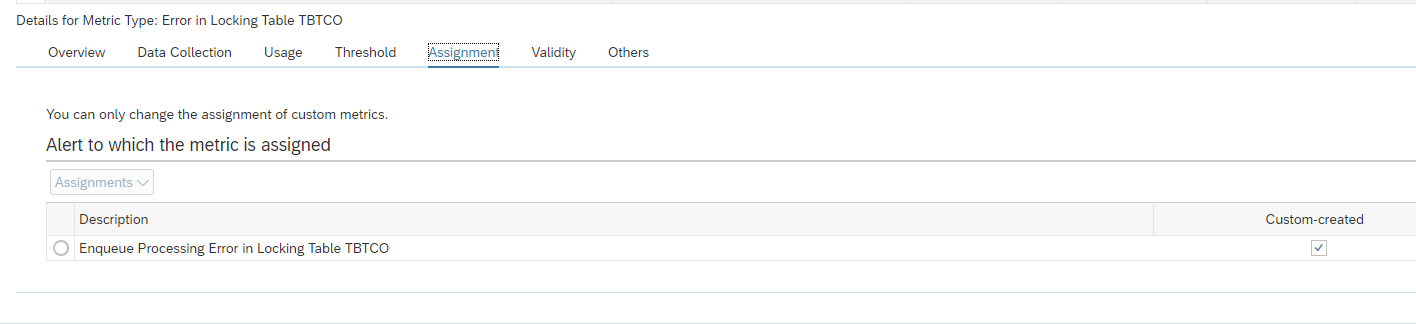
And assign the metric to the ABAP Instance not available alert group:
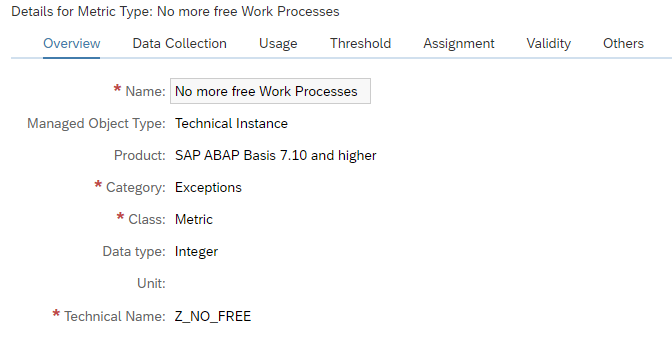
Detecting no more free work processes
From availability perspective, you want to detect as quickly as possible if you don’t have any free work processes left.
The template to be adjusted is the technical instance SAP ABAP 7.10 and higher template. Don’t forget to tick it on for monitoring otherwise it is not active.
In expert mode create a custom metric.
Create technical name Z_NO_FREE:
In the data collection:
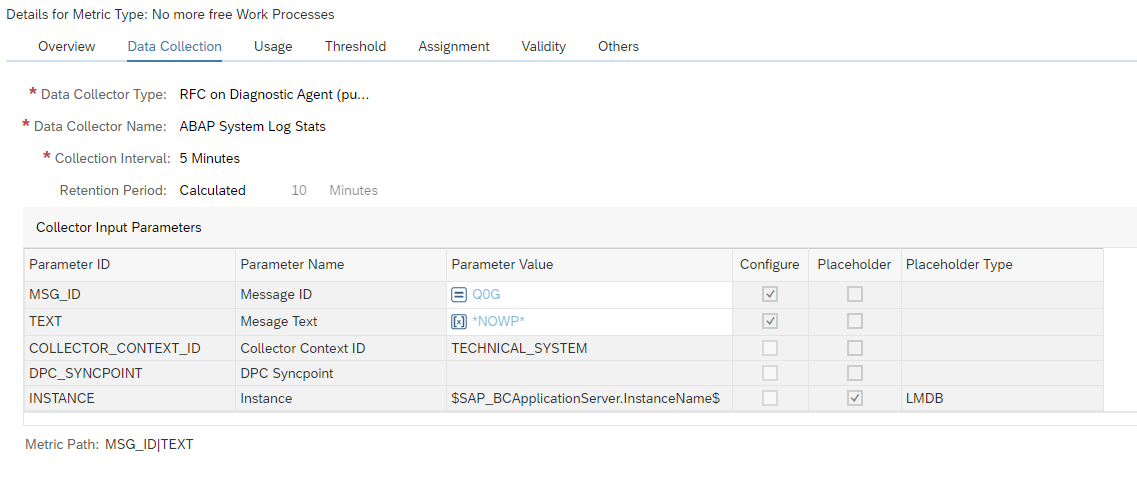
Data to enter: RFC on diagnostics agent (push). Select ABAP System Log Stats. Filter on message number QoG with text *NOWP*.. For more information on system log messages, read this blog.
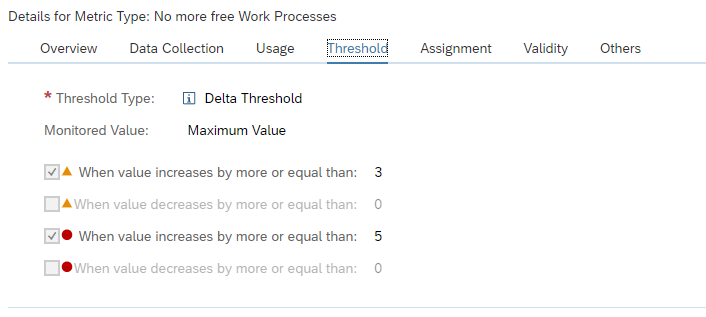
Define the threshold for alerting:
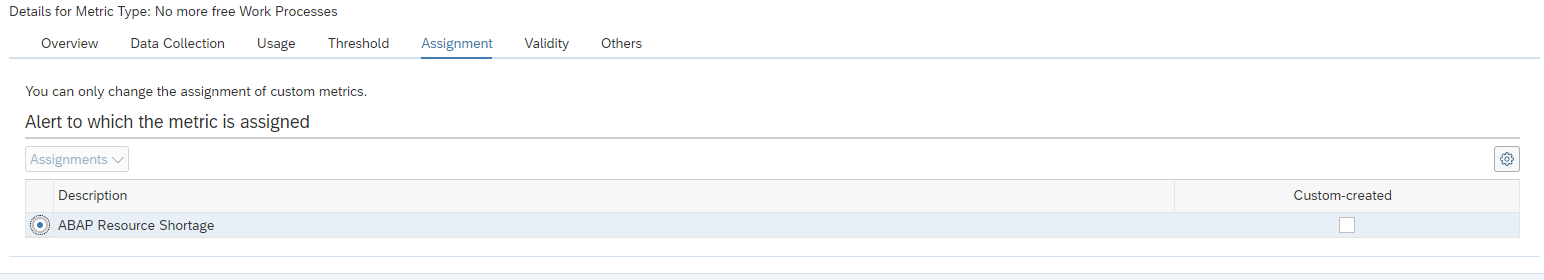
And assign the metric to the ABAP Resource Shortage alert group:
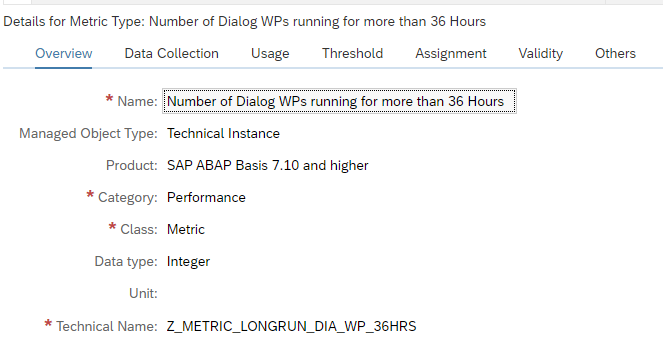
Detecting long running DIA process
In some exceptional cases you can have a DIA process that runs for a long time without action and still occupies the resources.
You can create a custom monitoring metric to measure and act on this. The template to be adjusted is the technical system SAP ABAP 7.10 and higher template. Don’t forget to tick it on for monitoring otherwise it is not active.
In expert mode create a custom metric. Create technical name Z_METRIC_LONGRUN_DIA_WP_36HRS:
Now setup the definition for the data collection:
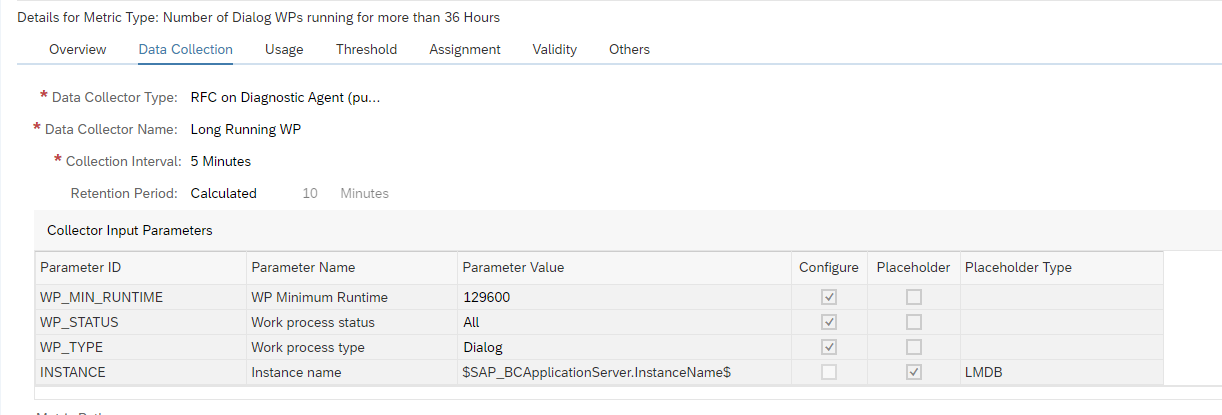
It is using the Push.
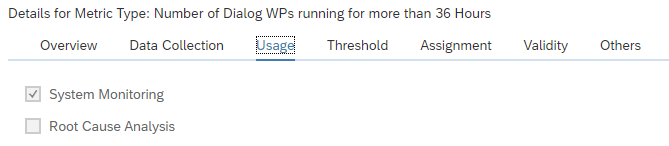
And set the usage:
Last but not least: you need to set the alerting threshold:
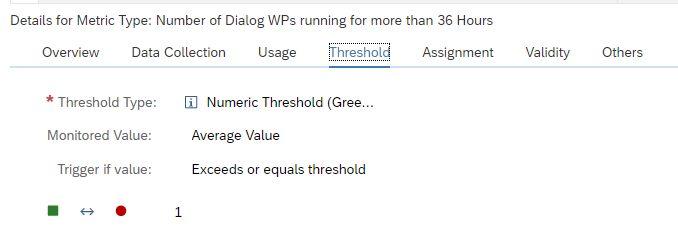
The alert is raised if a single DIA work process is running longer than 36 hours.
Save the custom metric and make sure the template reassignment is done to activate the custom metric for your systems.
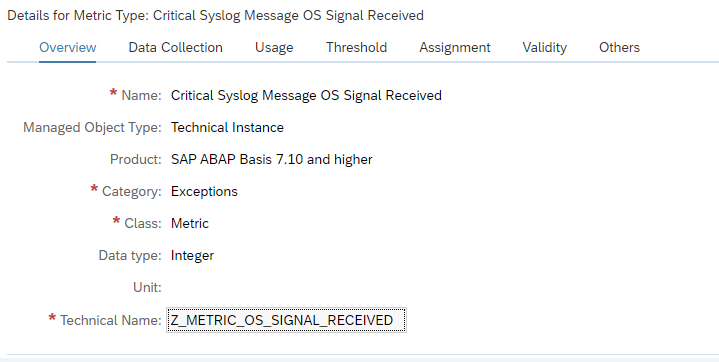
Detecting OS signals
In some cases the OS system will give critical signals to the SAP system that are visible in the ABAP system log. An example is the signal 11. When this happens, the system is in trouble and you as admin need to check fast to see what is going on to stop the system from full collapse, crash or very poor performance.
You can create a custom monitoring metric to measure and act on this.
The template to be adjusted is the technical instance SAP ABAP 7.10 and higher template.
Don’t forget to tick it on for monitoring otherwise it is not active.
In expert mode create a custom metric.
Create technical name Z_METRIC_OS_SIGNAL_RECEIVED:
In the data collection:
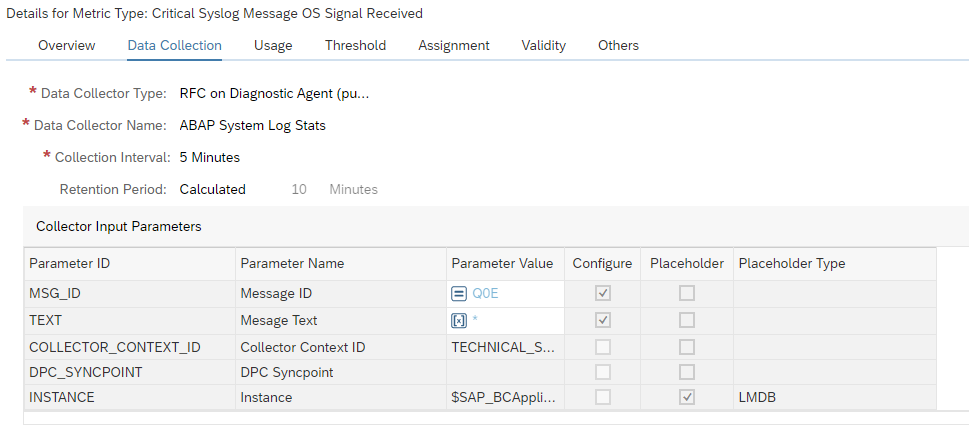
Data to enter: RFC on diagnostics agent (push). Select ABAP System Log Stats. Filter on MSG_ID QoE. This captures severe errors for OS signals.
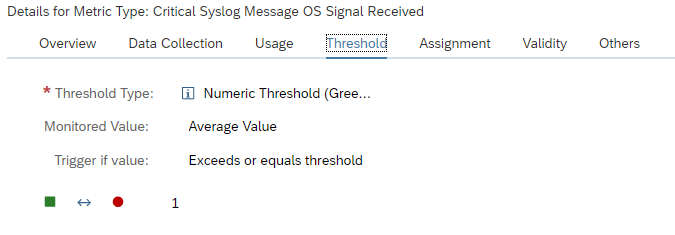
Define the threshold for alerting:
And assign the metric to the system message alert group:
Detecting PRIV modes
The template to be adjusted is the technical system SAP ABAP 7.10 and higher template. Don’t forget to tick it on for monitoring otherwise it is not active.
Create technical name Z_METRIC_DIA_WP_PRIV:
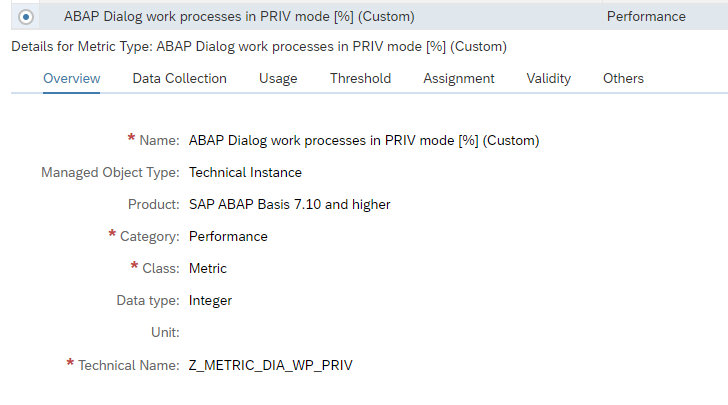
Now setup the definition for the data collection:
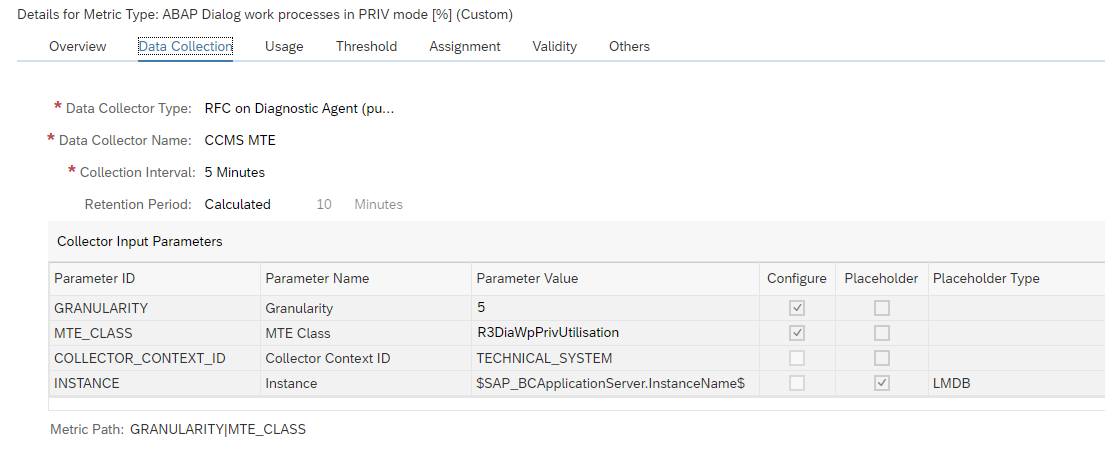
This will collect the PRIV dialog processes in percentage.
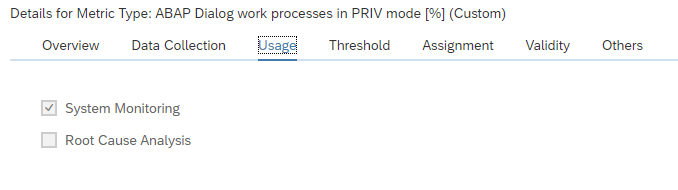
Mark the custom metric as relevant for monitoring:
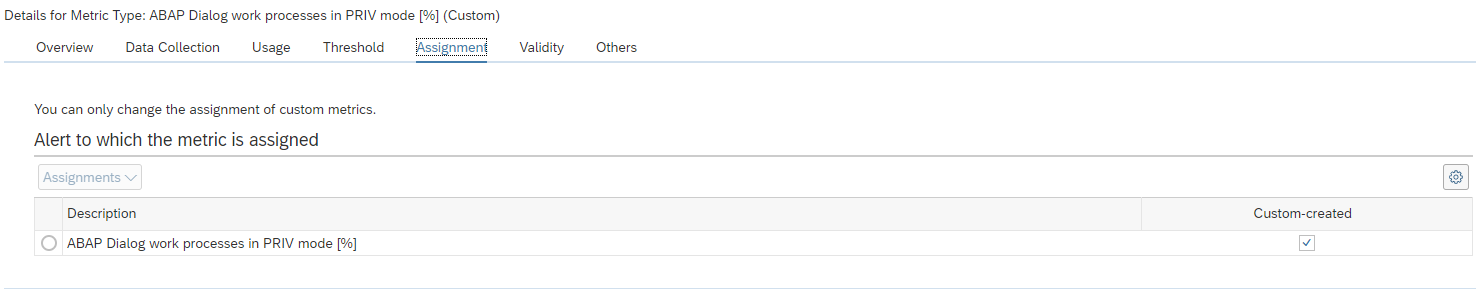
And set the assignment:
Last but not least: you need to set the alerting threshold:
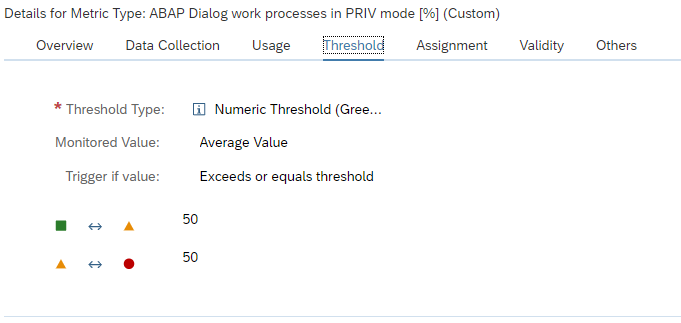
Save the custom metric and make sure the template reassignment is done to activate the custom metric for your systems.
Detecting message server disconnects
From availability perspective, you want to detect as quickly as possible if you are suffering from message server disconnects.
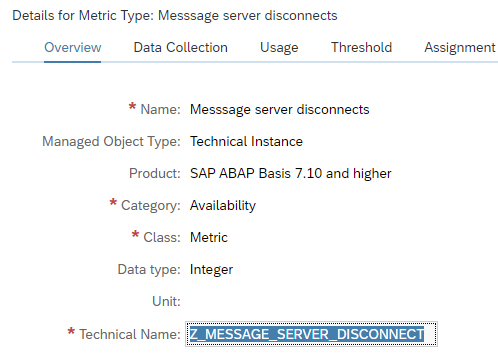
Creation of the custom metric for message server disconnects
Create technical name Z_MESSAGE_SERVER_DISCONNECT:
In the data collection:
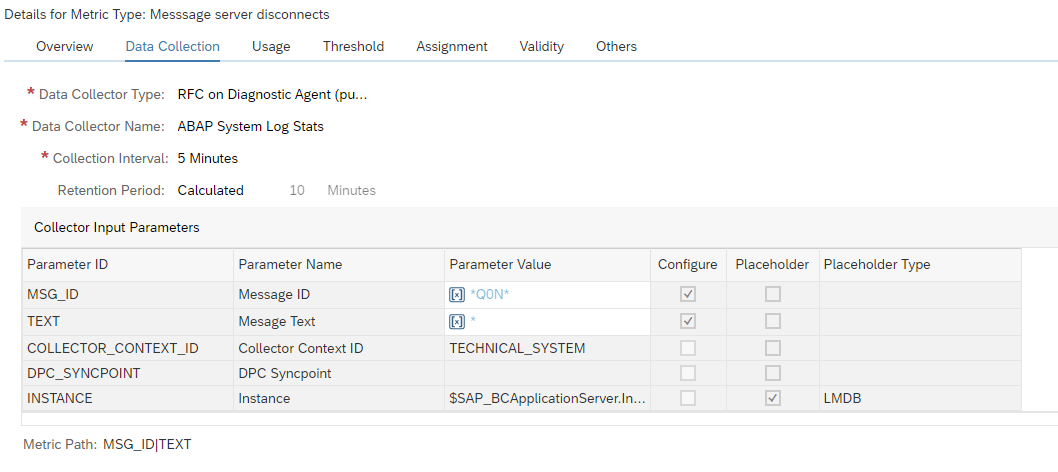
Data to enter: RFC on diagnostics agent (push). Select ABAP System Log Stats. Filter on message number Q0L, Q0M and Q0N. Any of those indicate message server errors. For more information on system log messages, read this blog.
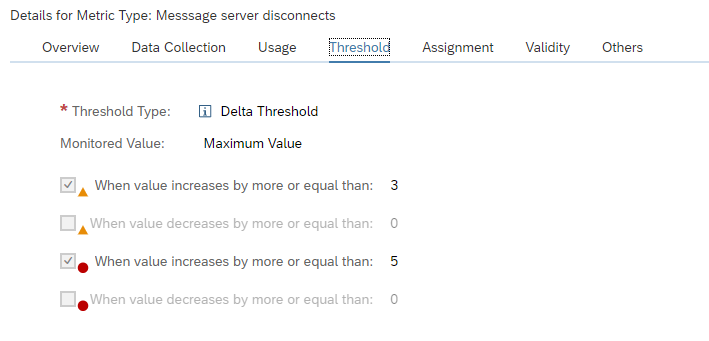
Define the threshold for alerting:
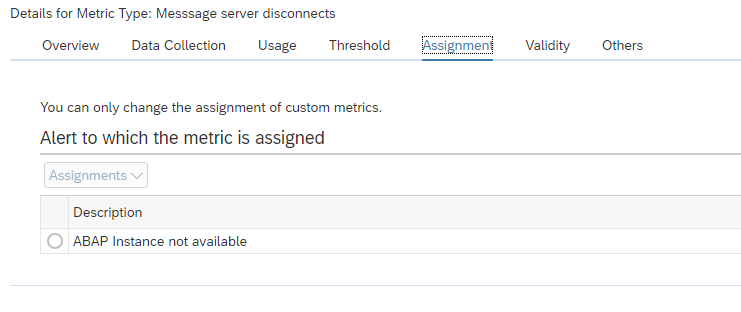
And assign the metric to the ABAP Instance not available alert group:
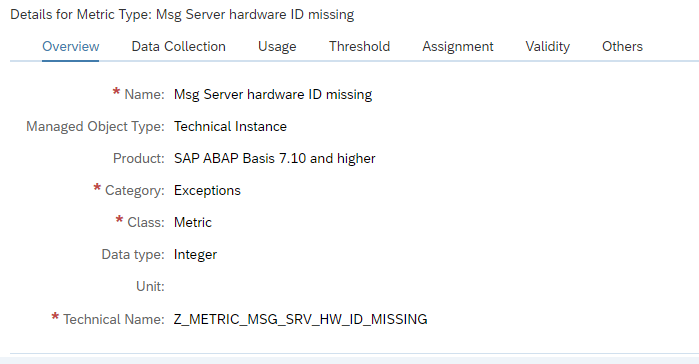
Detecting missing hardware ID
From availability perspective, you want to detect as quickly as possible if you are suffering from missing hardware ID.
The template to be adjusted is the technical instance SAP ABAP 7.10 and higher template. Don’t forget to tick it on for monitoring otherwise it is not active.
In expert mode create a custom metric.
Create technical name Z_METRIC_MSG_SRV_HW_ID_MISSING:
In the data collection:
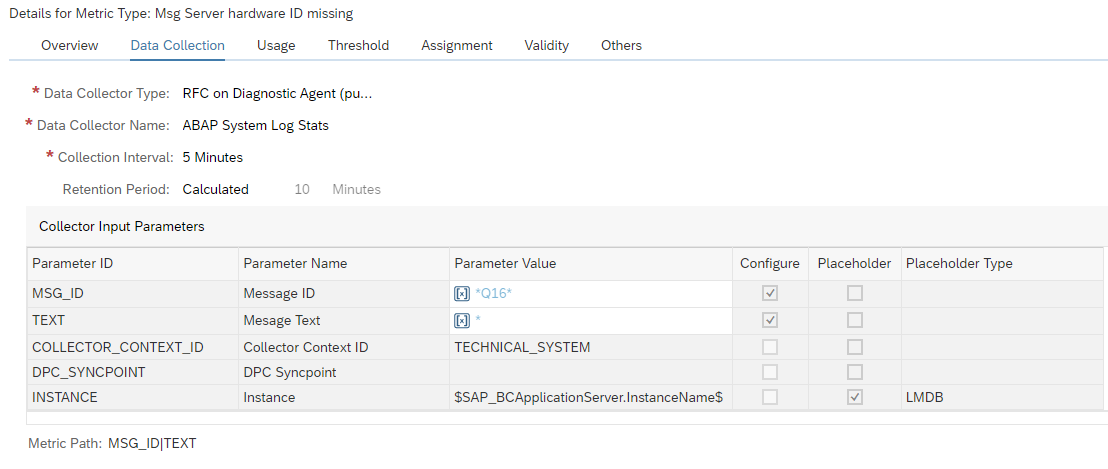
Data to enter: RFC on diagnostics agent (push). Select ABAP System Log Stats. Filter on message number Q16. This indicates missing hardware ID. For more information on system log messages, read this blog.
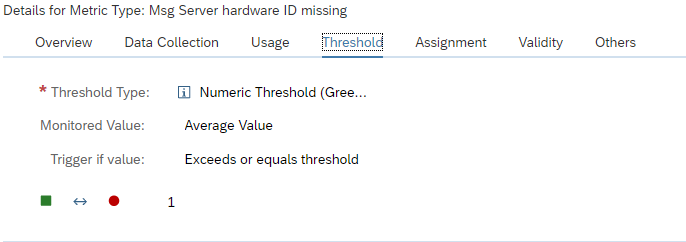
Define the threshold for alerting:
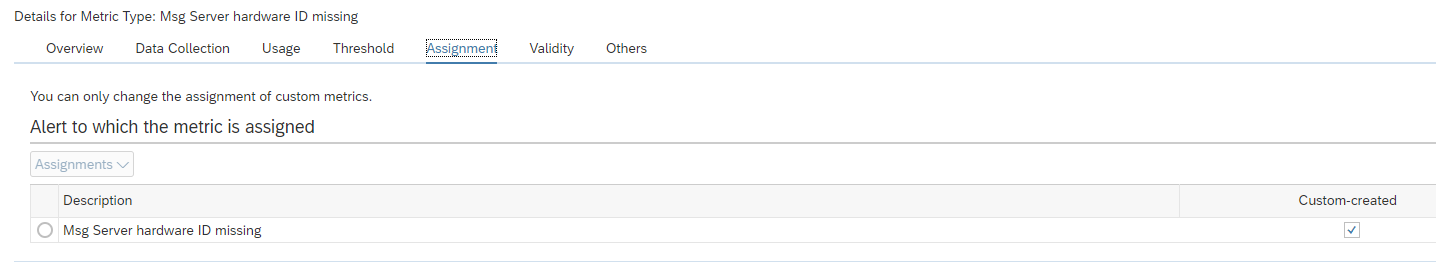
And assign the metric to the ABAP Instance not available alert group, create a custom alert group:
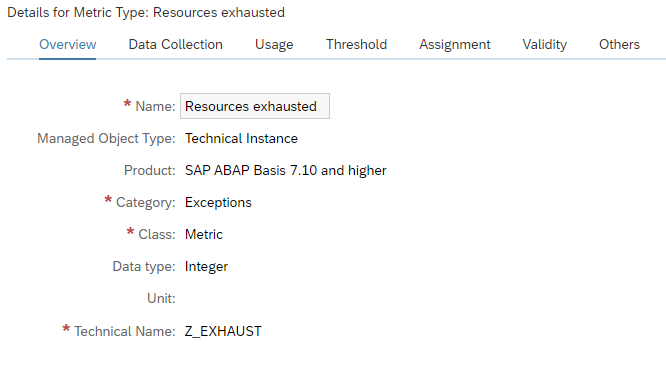
detecting resource exhaustion in ABAP system
From availability perspective, you want to detect as quickly as possible if you are suffering from resource exhaustion.
You can create a custom monitoring metric to measure and act on this.
Creation of the custom metric for resource exhaustion
Create technical name Z_EXHAUST:
In the data collection:
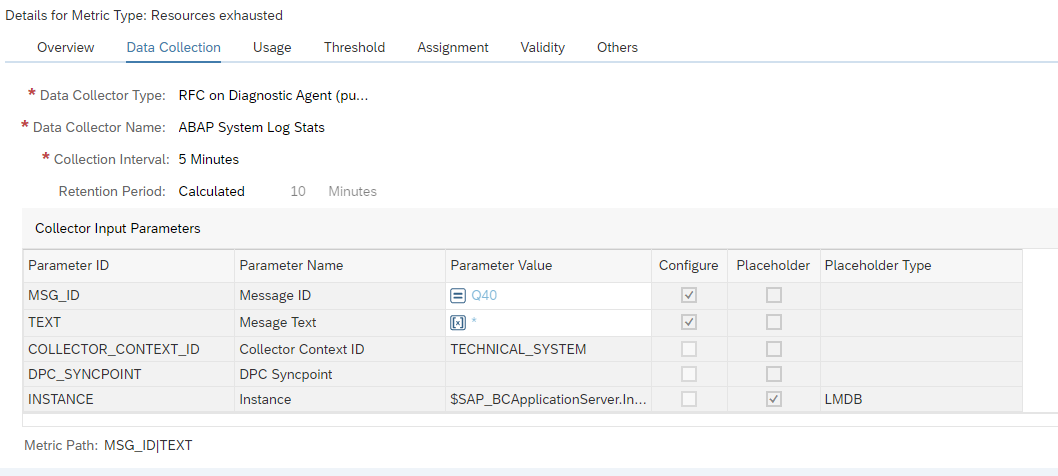
Data to enter: RFC on diagnostics agent (push). Select ABAP System Log Stats. Filter on message number Q40. This is the message for resources exhausted. For more information on system log messages, read this blog.
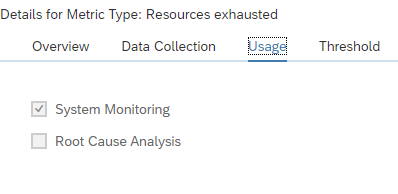
Set the usage to monitoring:
Define the threshold for alerting:
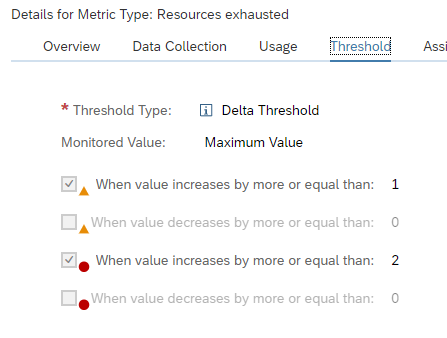
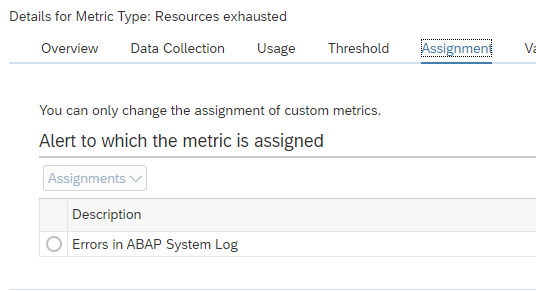
And assign the metric to the ABAP Instance not available alert group:
User lock status of DDIC and SAP*
From security perspective, you want to validate that 2 important users are locked in the main system clients: SAP* and DDIC. For more background you can read this blog.
Create technical name ZUSER_LOCK_STATUS:
In the data collection:
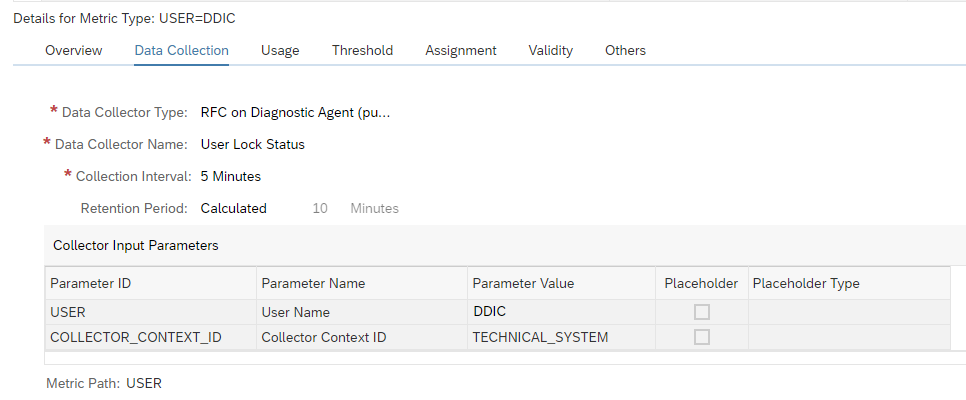
Data to enter: RFC diagnostics agent (push). User Lock status Data collector. Enter as parameters the user ID (DDIC) and the COLLECTOR_CONTEXT_ID as TECHNICAL_SYSTEM.
Set the threshold as a text threshold:
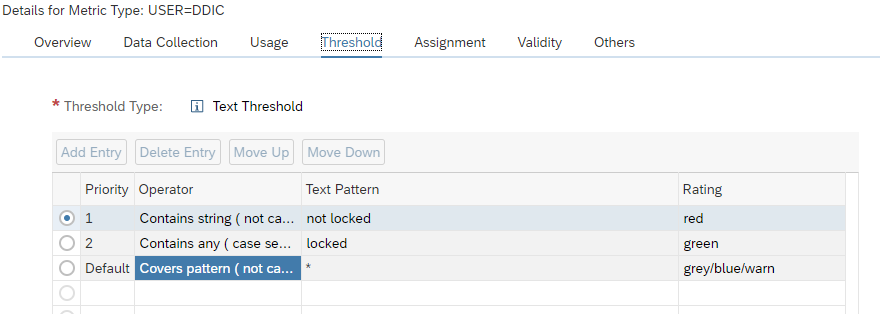
Set the red rating in case the string contains the word ‘not locked’ and set to green in case it contains the word ‘locked’.
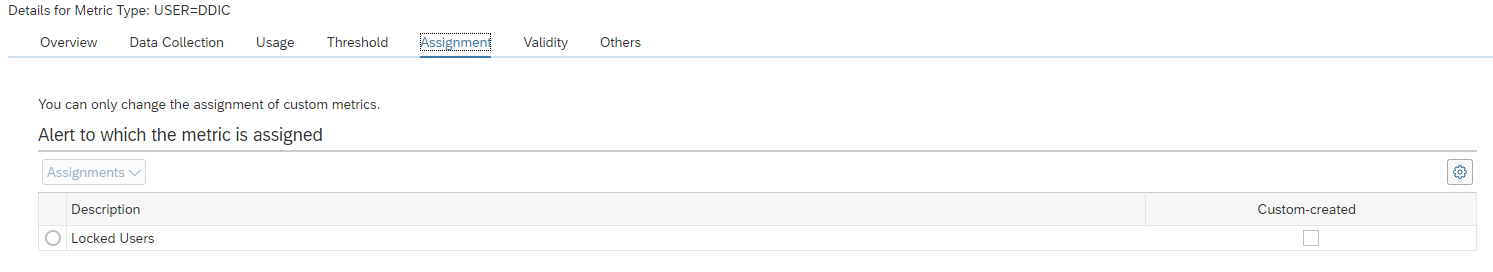
Now assign it to Alert group for locked users:
Save the metric.
Repeat the same for SAP*.
Checking web dispatcher URL
When you are using a web dispatcher, you want to check that the main URL is available. You can achieve this via URL monitoring in health monitoring (see blog).
In some cases you want to integrate this vital start URL into system monitoring, since that is your main central tool.
You can create a custom monitoring metric to measure and act on this.
In the use case below we will setup URL monitoring for web dispatcher for SAP Netweaver Gateway serving FIORI pages.
Creation of the custom metric for web dispatcher URL monitoring
The template to be adjusted is the technical system SAP Web Dispatcher template. Don’t forget to tick it on for monitoring otherwise it is not active.
In expert mode create a custom metric. Create technical name Z_WEBDISPATCHER_URL_AVAILABILITY:
In the data collection:
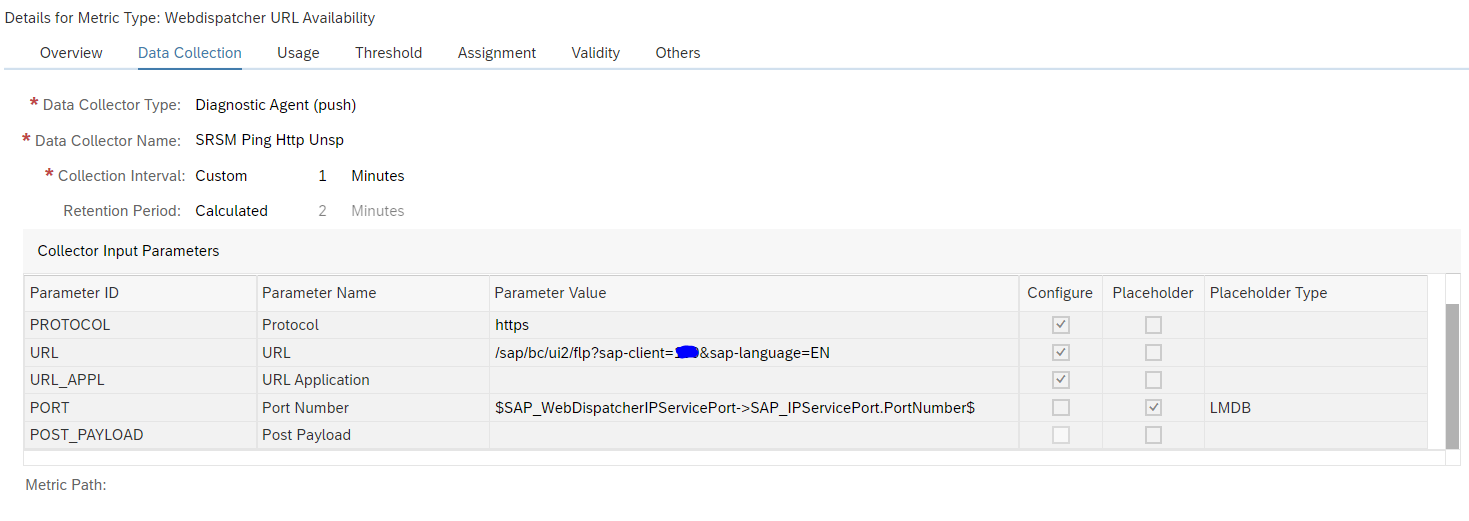
Data to enter: RFC on diagnostics agent (push). Select SRSM Ping Http Unsp. Select the HTTPS protocol and setup the URL to monitor: /sap/bc/ui2/flp?sap-client=xxx&sap-language=EN. This is the main FIORI start URL. The port number is taken from the LMDB settings of the web dispatcher: $SAP_WebDispatcherIPServicePort->SAP_IPServicePort.PortNumber$.
Define the threshold for alerting:
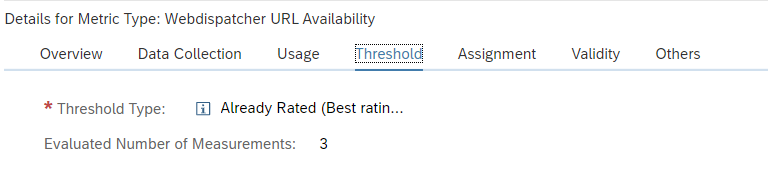
We take here three measurements. If we don’t do this, a single glitch in the network will cause an alert to be triggered.
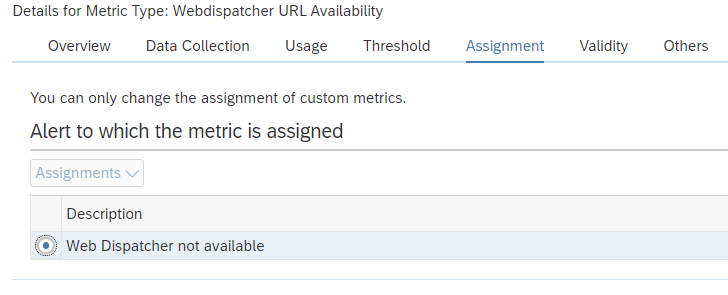
And assign the metric to the system message alert group:
<< This blog was originally posted on SAP Focused Run Guru by Frank Umans. Repost done with permission. >>