Create custom metric for system monitoring…

In some cases you want to have your own metric defined to fine tuning the system monitoring template.

Questions that will be answered in this blog are:

  • How do I create a custom monitoring metric?
  • Do I need to re-create the custom metric per monitoring template?
  • What are examples of custom metrics?

Creating custom metric

In this example we create a custom metric to make sure that the user WF-BATCH is not locked.

There is already a metric in the ABAP template that is called User Lock Status. This can be used as a basis for our custom metric.

Goto your template into change mode and on top left choose Create (you need to be in Expert mode first):

And select Metric. Now the screen opens for a new metric creation:

Fill out the details, and create a custom description:

Now go to the tab Data Collection:

Copy the data from your reference metric here. Don’t forget to fill out the Parameter Value. In this case WF-BATCH. Also make sure you have a reasonable Collection Interval timing. Not everything is need to be collected every 5 minutes.

Now go to the tab Threshold:

Configure your threshold setting.

Now press the Next button and assign the metric to the correct group:

Now press Finish to save the metric.

The new custom metric is now available in the monitoring template:

You see that this one has the Custom created marked. Later you can use the filter on Custom created column to quickly find it again.

Deploying custom metric to other templates

If you have to deploy the custom metric to other templates: so far this is a manual action. Per template you have to re-create the same custom metric. I have not found a nice way of re-using custom metrics yet.

Examples of custom metrics

Examples of custom metrics:

Fine tuning monitoring templates…

This blog explains about fine tuning of the monitoring templates.

Questions that will be answered are:

  • How to update the SAP content for templates?
  • What is a good rule of thumb for the amount of templates to create and maintain?
  • Should I transport the templates or maintain them locally?
  • How to create your own template?
  • How to fine tune a single metric?
  • How to change the alerting settings of a metric?
  • How to assign the template to a system?
  • How to update the template of a system?

SAP content updates

As a starting point you use the SAP pre-delivered content. Also the SAP content gets updated. OSS note 2695734 – Manual Content Update for FRUNCONT200 in Focused Run 2.0 for SAP Solution Manager (FRUN-CONT) is keeping track of the updates. It also explains where to download the content files. For version 3.0 take OSS note 2991255 – Manual content update for FRUN-CONT 300 in SAP Focused Run (FRUN-CONT). And for 4.0 OSS note 3275006 – Manual content update for FRUN-CONT 400 in SAP Focused Run.

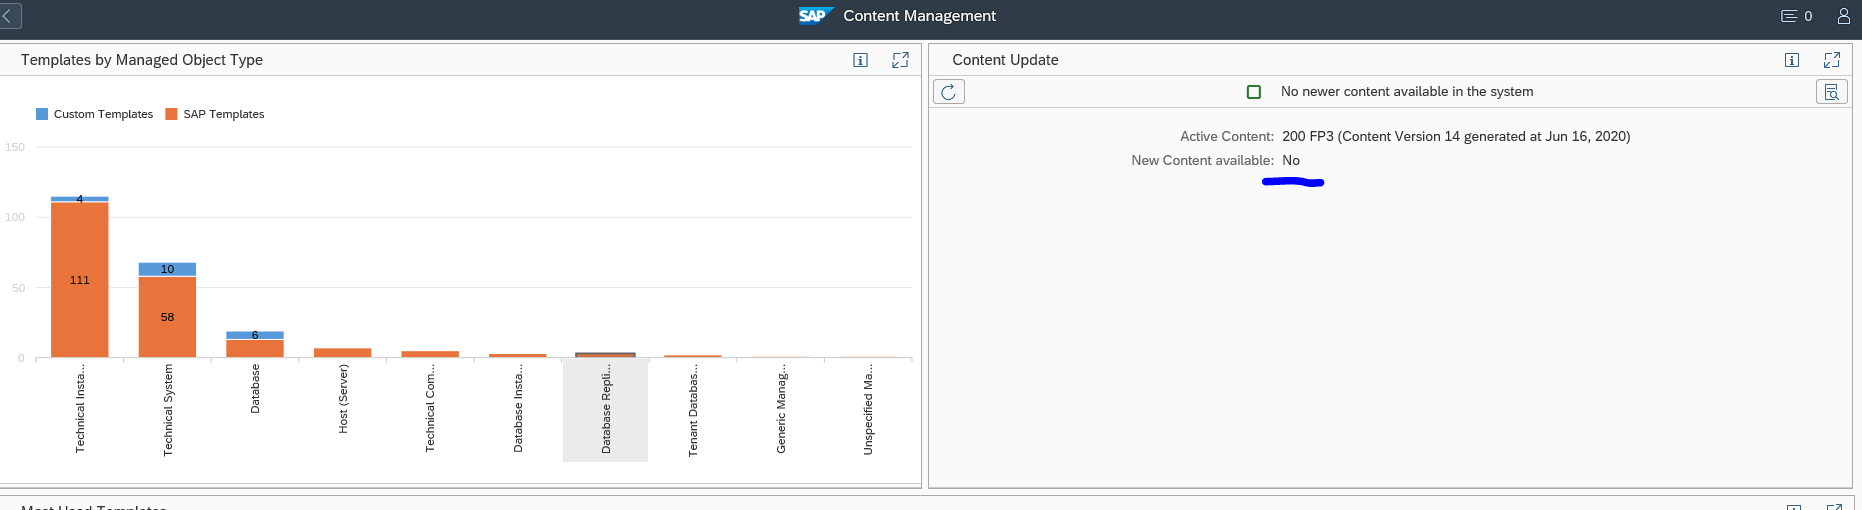
Use program RCSU_MANUAL_UPLOAD to upload the downloaded content. Then use the FIORI tile Content management to activate the new content:

And update the content or see it is already up-to-date:

Before you start fine tuning your own templates, make sure the standard SAP content is up-to-date.

Amount of templates to fine tune

In principle it is up to you to generate as much templates as needed. Initially it seems a good idea to have many different templates. The setback is that fine tuning a specific metric that is valid for all templates, you need to repeat this action. Also when you have fine tuned a template, you need to update the attached systems.

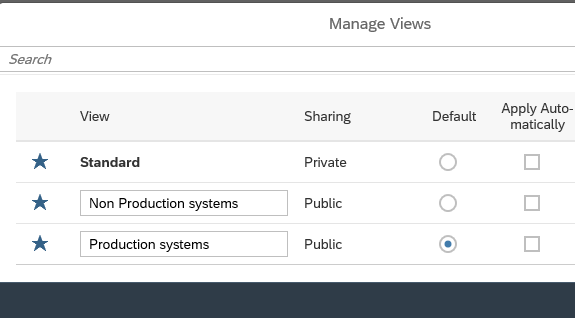
A good starting point for fine tuning is to have 2 templates to start with:

  1. Template for productive system
  2. Template for non-productive system

The template for productive system can have more metrics activated with sharper thresholds for generating alerts.

The main goal for a non-productive template can be focused on system availability only.

For productive system you want to manage all aspects of a system including performance and all content exceptions.

Local maintenance or transport

The template maintenance can be done on a productive Focused Run system directly. Or you can choose to maintain the templates on a trial/test Focused Run system, test it there, and then transport it to the productive Focused Run system. The transport is the best approach that gives the most control.

Who should fine tune a template?

This is an organisational question. If you let everybody maintain the templates and metric content of the templates, you will quickly loose control. Best to limit the amount of people to maintain the template settings. Be careful when handing out template control to a service provider. They tend to change the thresholds to very high levels, so they get less alerts. In stead of solving the alerts….

Creation of own template

Open the template maintenance FIORI tile:

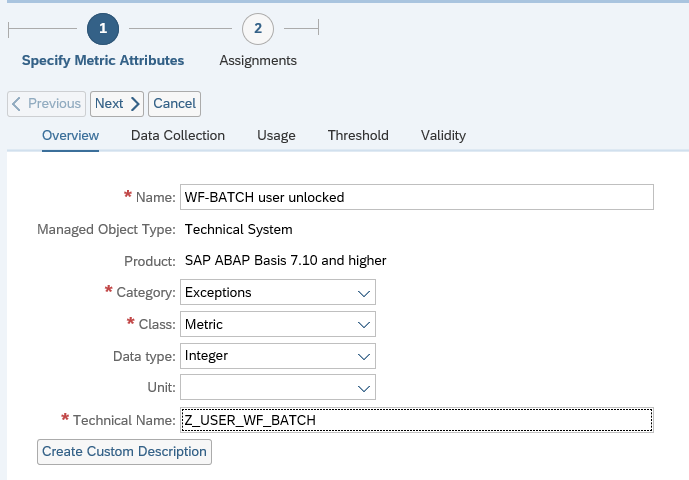
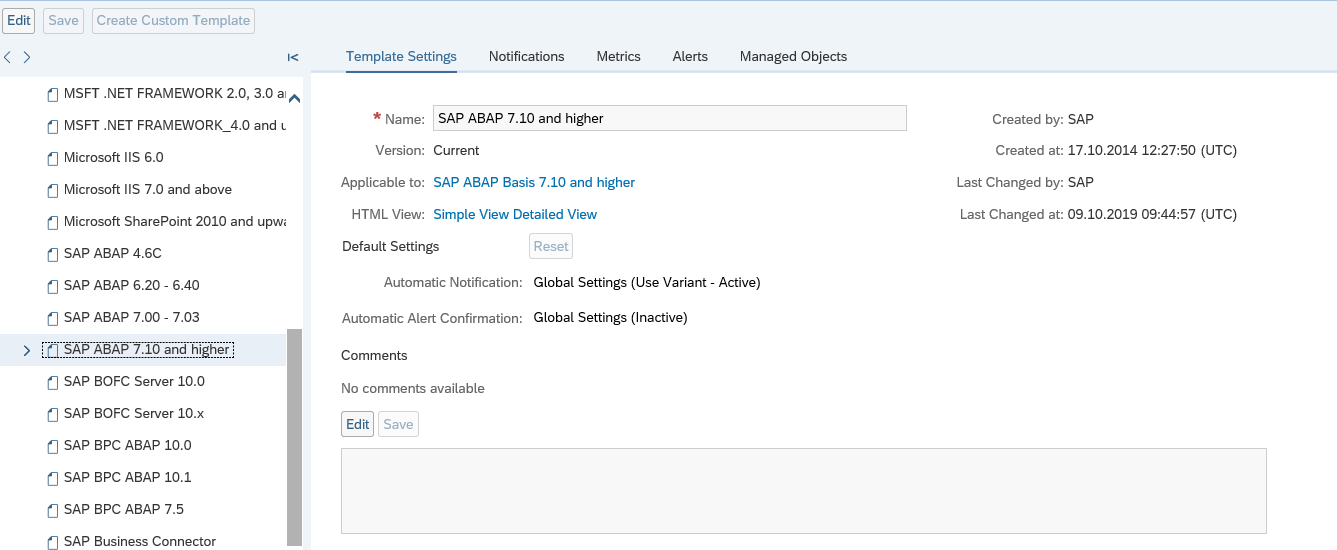
Select the template you want to fine tune. In this example we will fine tune the Technical System template for ABAP 7.10 and higher:

Press the Edit button and then the button Create Custom Template:

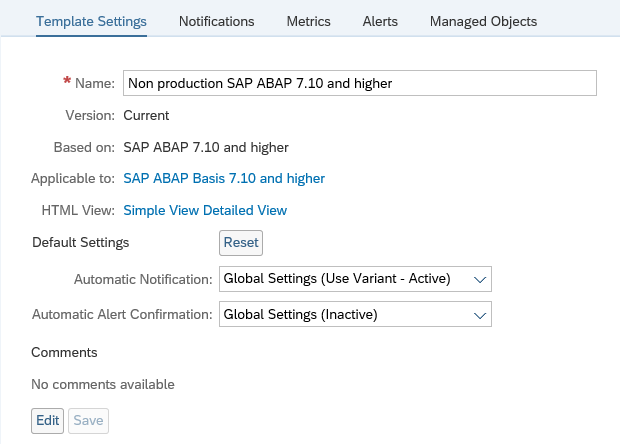
Give the template a good name. The most descriptive text must be at the beginning.

Fine tuning the template

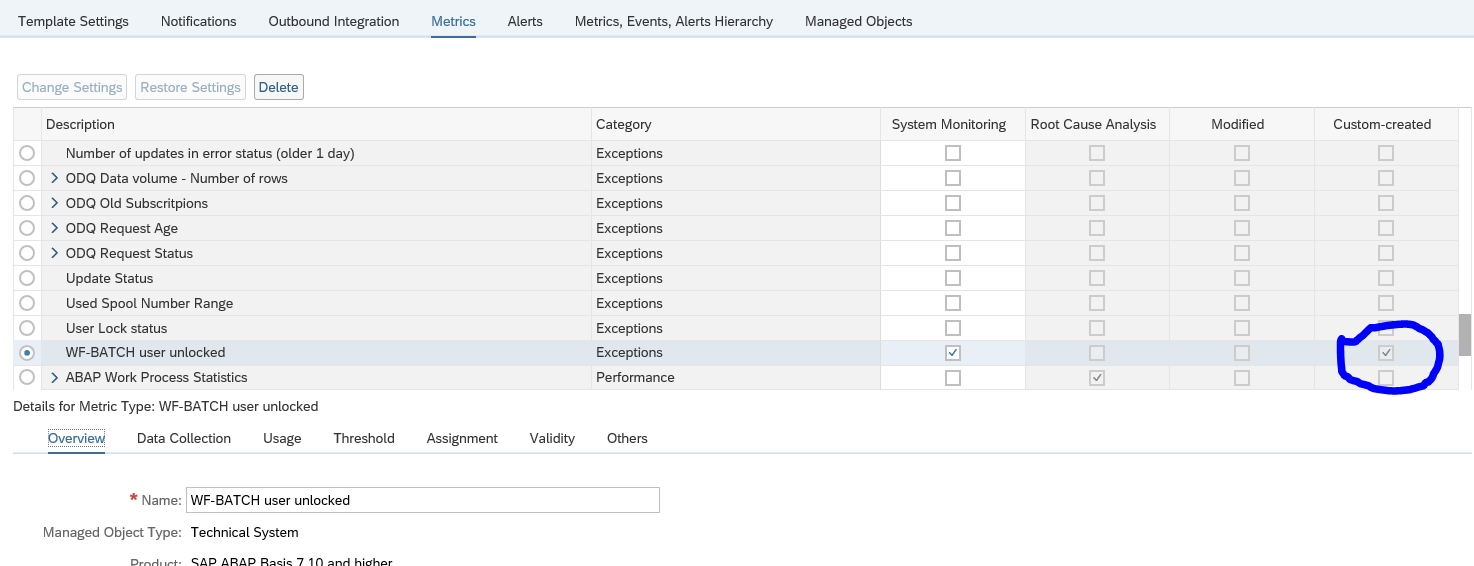
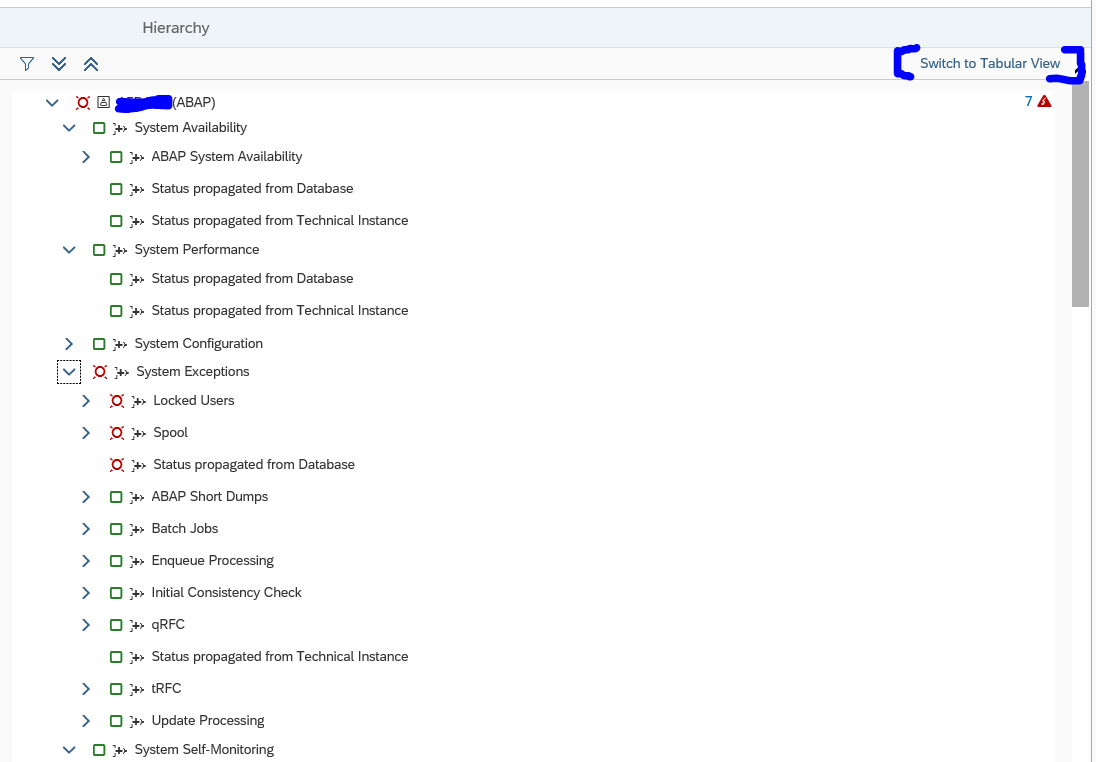
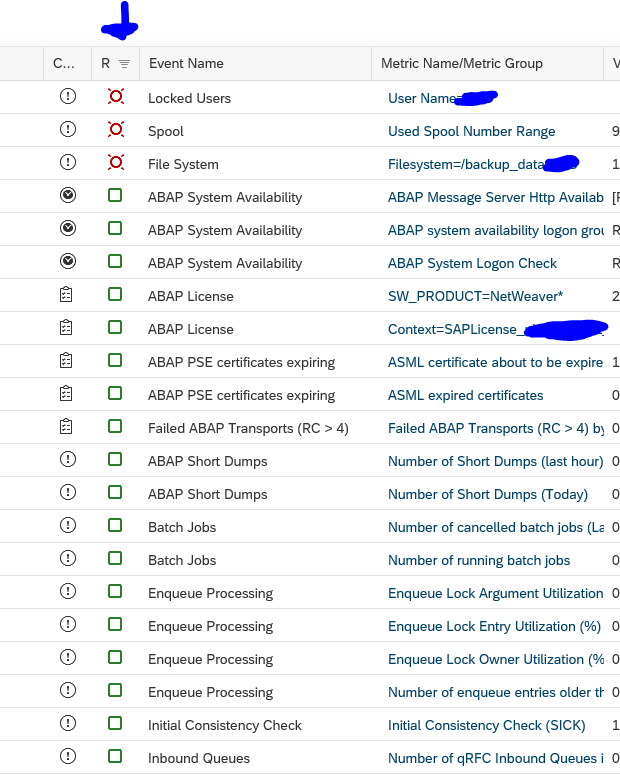
Case 1: include or exclude in monitoring

Goto the metrics tab:

In the system monitoring you can switch on or off metrics. Press save after each change to save your setting changes.

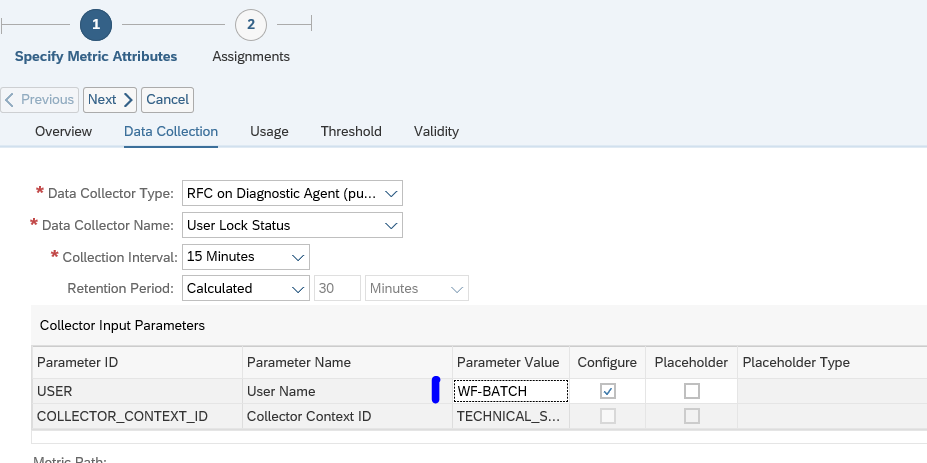
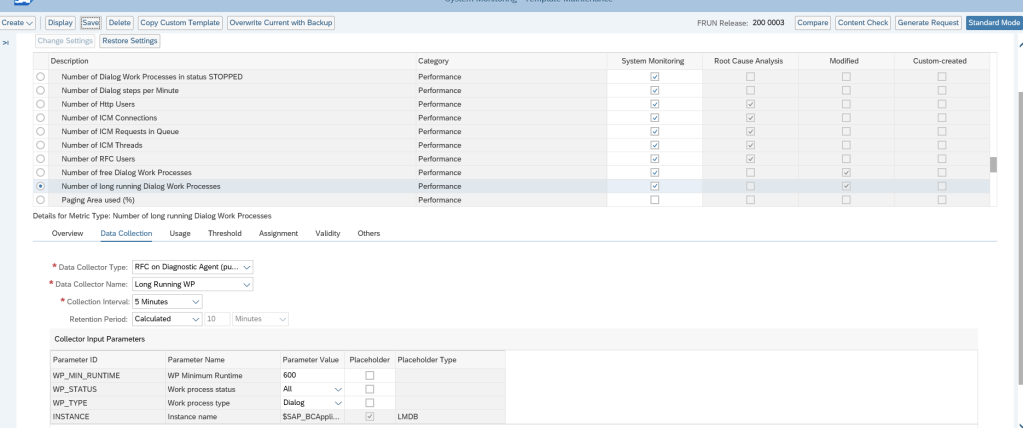
Case 2: fine tune data selection

In the standard SAP delivery there is an alert for Number of long running Dialog Work Processes. Goto the Expert mode (button top rights), then select the tab data collection:

Go into edit mode via the Change Settings button, and you can update the field value in parameter value for WP_MIN_RUNTIME to your needs.

This is just an example. You can fine tune a lot of metrics in this way.

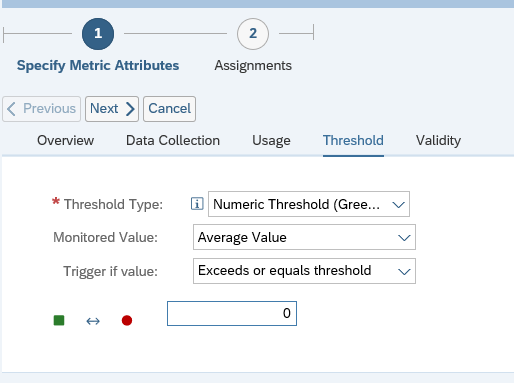
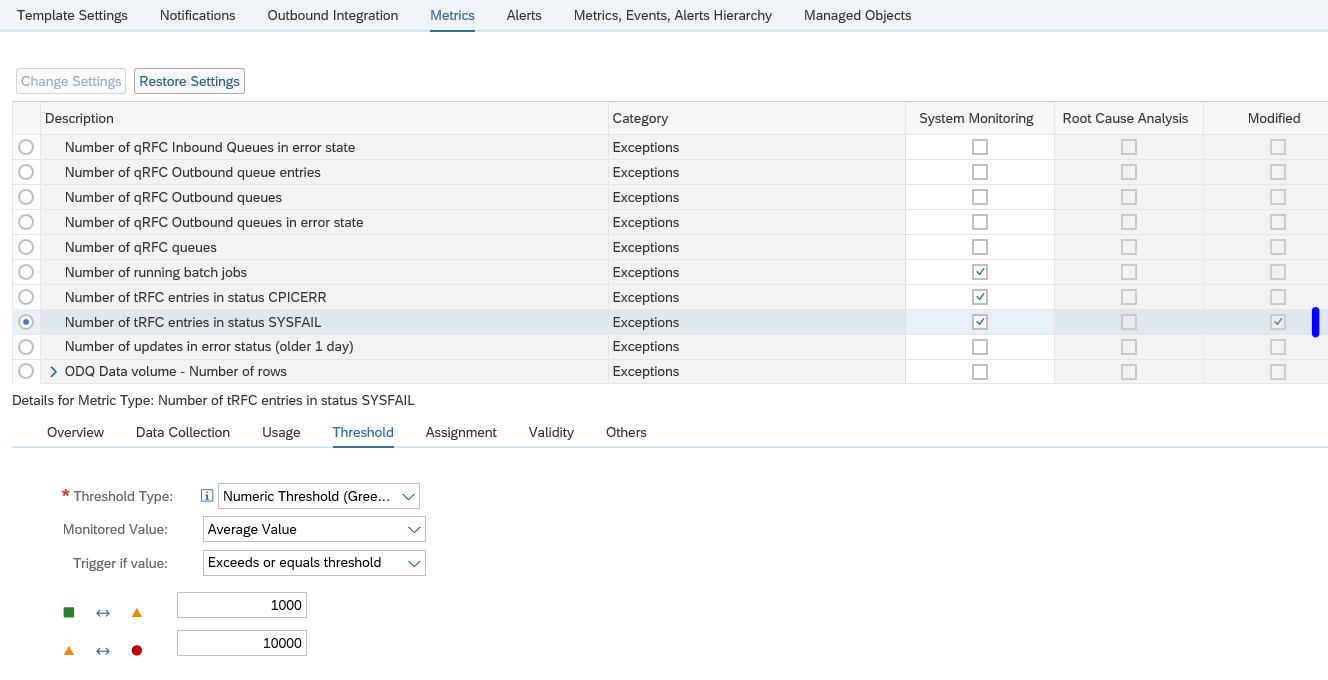
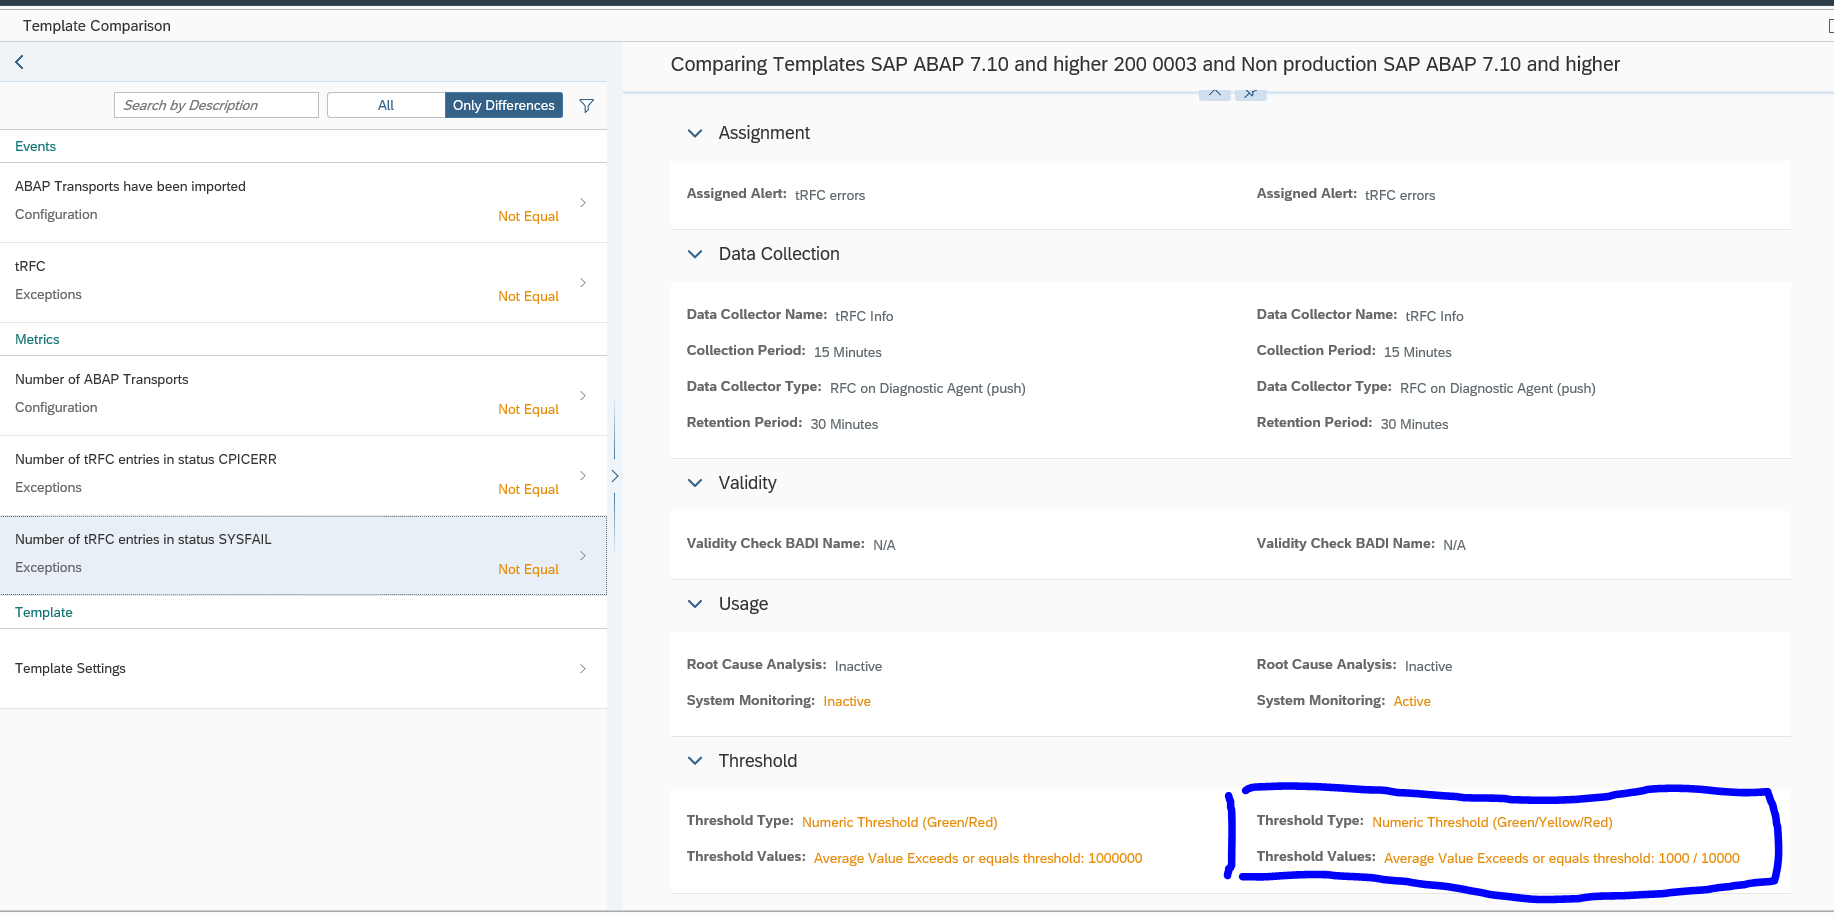
Case 3: fine tune threshold and alert settings

If you want to change the thresholds, first click on the expert mode button on the top right corner. Then press the Change setting button to edit the Threshold tab settings:

In this example we changed the type from Numeric (green/red) to Numeric (green/yellow/red) and we changed the values. The modified column indicates that we have changed a metric and that the definition is different from the standard SAP one.

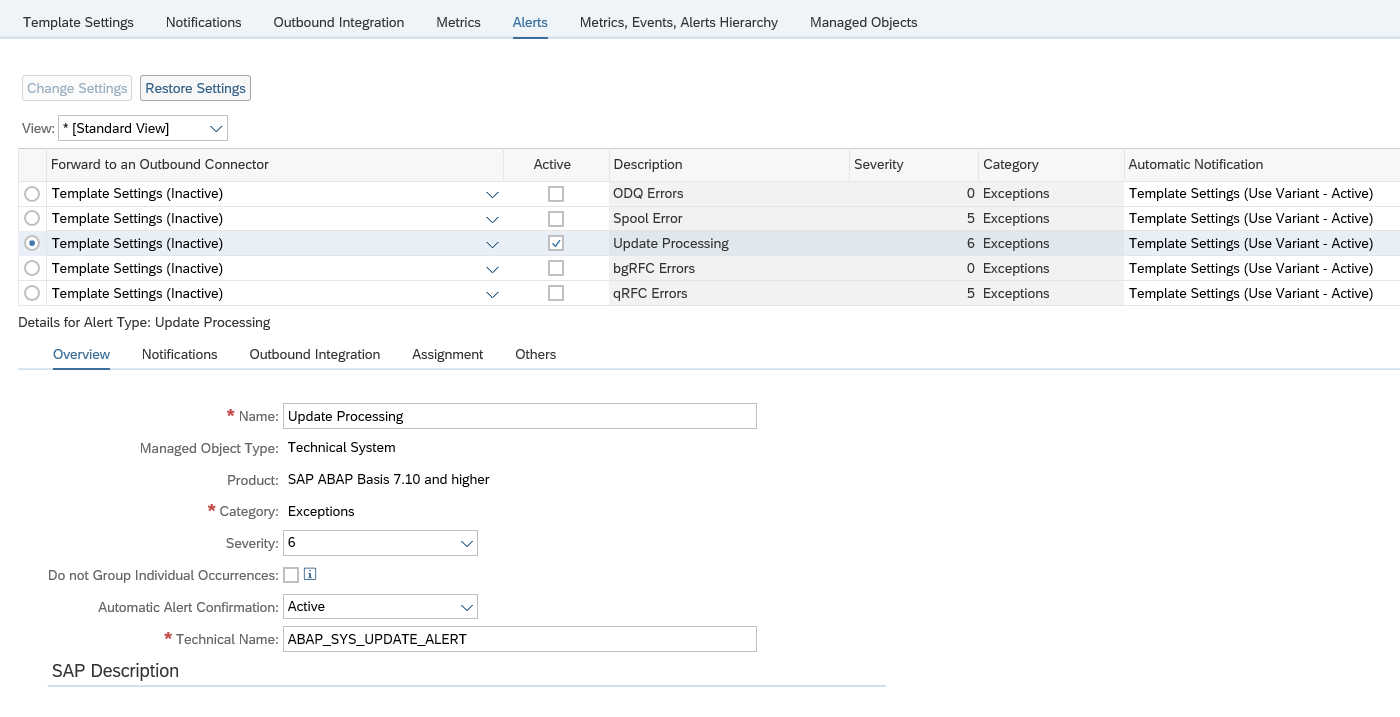
On the Alerts tab you can make changes to the alert settings:

You can change the following:

  • If an alert is to be generated or not (Active means, alert is generated)
  • Severity of the alert
  • If an alert will be automatically confirmed when the system detects that the issue is solved
  • If an automatic notification will be send or not (see this blog to set up mail notification)

The usage of alerts, will be explained in this blog.

The configuration of automatic notifications is explained in this blog.

In the last tab Managed Objects you can see there are no systems assigned yet to the newly created template.

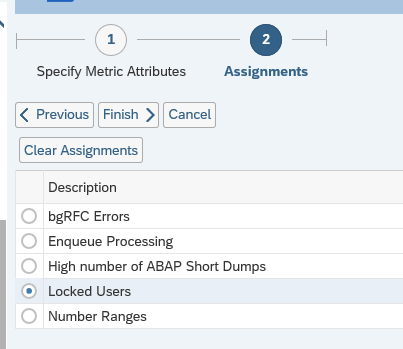
Assigning custom template to a system

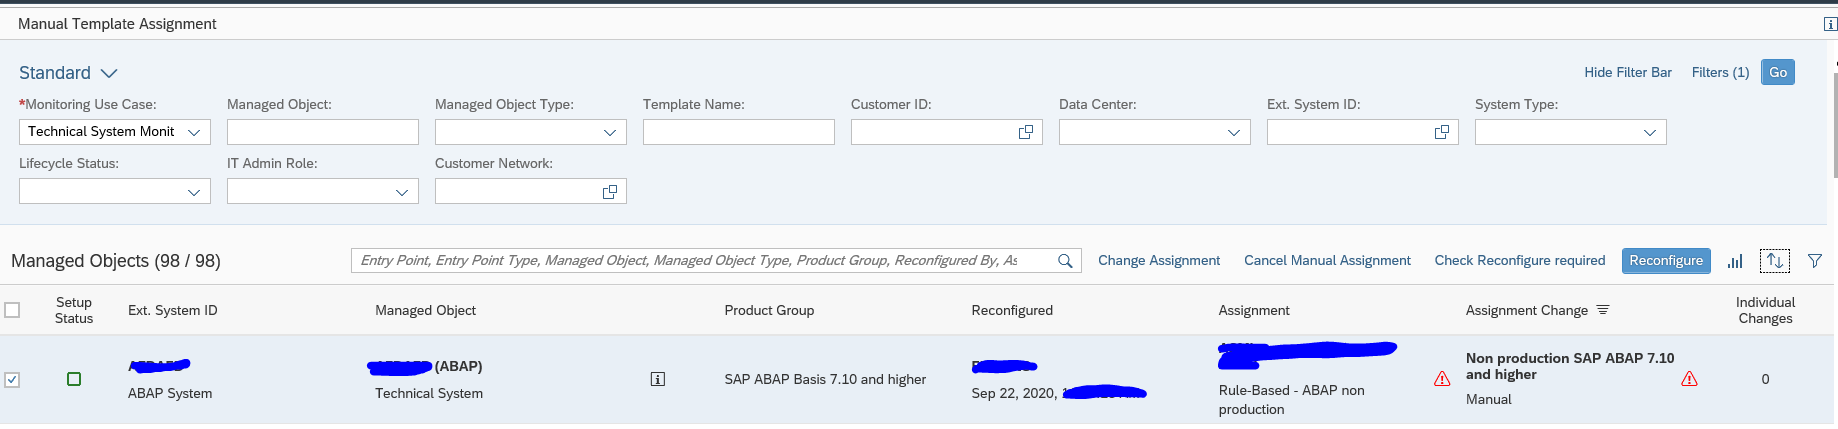
To assign a new custom template to a system, goto the Individual maintenance FIORI tile:

Select the system and press the button Change assignment and assign the wanted new template:

Now press the button Reconfigure to effectuate the template change.

Automation of template assignments can be configured as well by using rules. This is explained in this blog.

Template updates

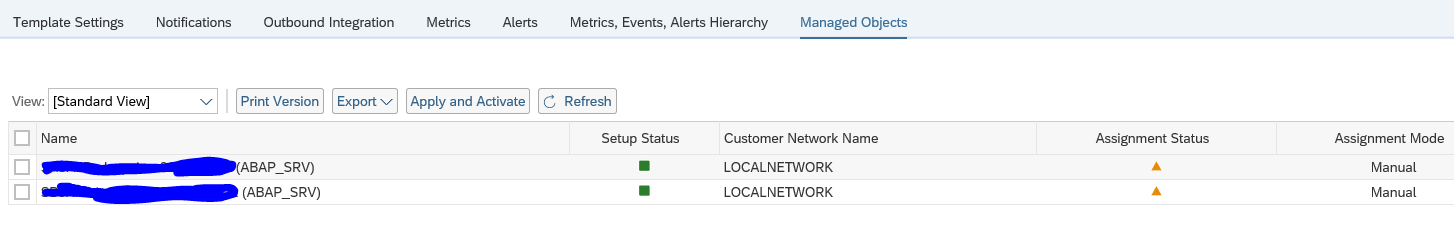
If you have systems assigned to a template, and you have executed template changes, goto the tab Managed objects in the template maintenance screen:

Select the systems and press the Apply and Activate button. The system will apply the updated template now.

If you use transport mechanism for template updates: after transport import, you need to go to the updated templates, and still to the update assignment. This is not automatically done after the transport.
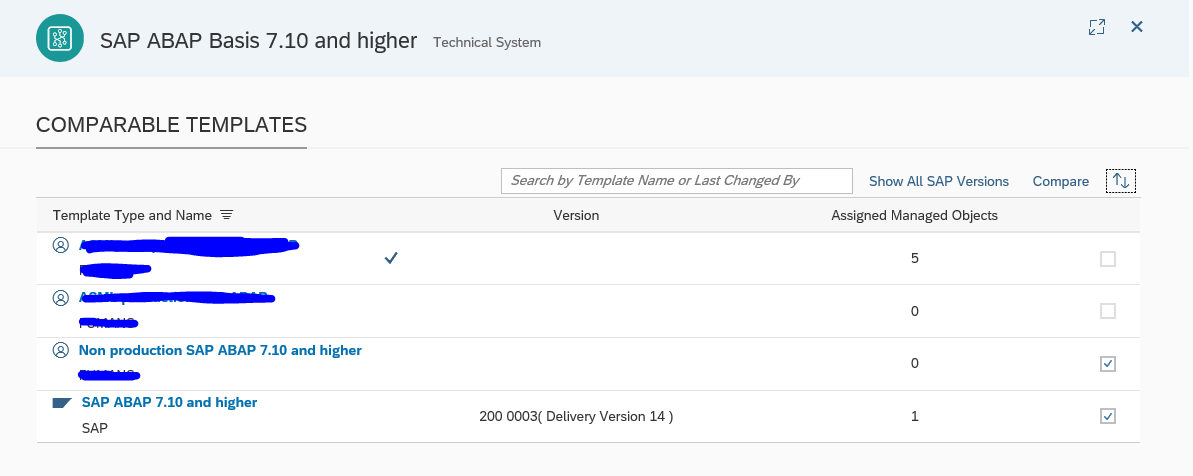
Compare templates

In the main screen of template maintenance you can select the button Compare to start the template comparison app. Select the templates to compare:

You now see the delta’s between the templates:

Creating custom metrics

Creation of custom metrics is possible. Read more about it in this blog.

The setback of custom metric is that it needs to be created each time for each template. This is another reason to keep the amount of custom templates as low as possible.

System monitoring usability tips and tricks…

This blog will give tips and tricks on the usability of System monitoring.

Questions that will be answered are:

  • How to optimize the scope selection?
  • How to use the tabular view?
  • How to check a specific metric across multiple systems?

Optimizing scope selection

In the scope selection of systems, you can create a few variants to speed up your work.

In this example we will setup a variant to quickly select all productive systems. In the scope selection block select the IT Admin Role for Productive System (setting the IT admin role is described in this blog):

Now select the down arrow next to Standard in the top left corner and select Save As:

You can choose to set this variant as default. Setting it as public will make the variant available for all users. Selecting the Apply Automatically tickbox will apply this specific variant immediately. This might be preferable, or annoying. Just try it.

Upon pressing Save you will get a request for transport popup or save it as local request.

You can also create a similar view for non-production systems.

In the end you can always press the Manage button to change the variants and texts:

Now you can easily switch between scopes for production and non-production:

Using the tabular view

In stead of using the hierarchy view, you can also switch to the Tabular View:

In this view you can for example sort the items on a column like the traffic light:

Or you can apply a text filter to search for a specific metric:

Checking a metric across multiple systems

If you have an issue in one system, you might want to quickly validate if you have similar issue in different systems, or you simple want to compare with different systems. From the monitoring of a system select the metric.

For this example we selected Short Dumps:

Select the i button to get the explanation text:

This gives the exact name:

Now goto the metric tool:

If you don’t see the correct metric, use the metric selection filter on the top right of the screen:

Press Apply, and you get the overview of this specific metric across all systems in your selected scope:

Storing metric data longer

Focused Run normally stores the data 28 days. If you need the data for specific metrics and systems longer, you can make use of the aggregation framework. Read the details in this blog.

System monitoring overview…

This blog will give you and overview of the functional capabilities of the System Monitoring in SAP Focused Run.

Questions that will be answered in this blog are:

  • What are the main functions of System Monitoring?
  • How to zoom in on systems and specific metrics?

System monitoring

From the Advanced System monitoring group in FIORI launchpad, select the System Monitoring tile:

Now select the systems you want the see the monitoring data about in the Scope selection block (for usability tips and tricks read this blog):

Select Go when you finished your filtering. You now reach the overview screen:

If you want to zoom in click on one of the numbers, or select the Systems button from the left hand toolbar:

The traffic lights indicate where the issue or issues are: availability, performance, configuration or exceptions. If you want to go directly to an alert click on the alert number. More on alerts in this blog.

Click on a single system in the left column to open the system monitoring view for a single system:

On the left hand side, you can see the application (in this case ABAP) on top. You can also see the database (HANA) and application server, CI and their hosts. On the right hand side in a tree structure you can see the diverse checkpoints and issues in the system. The checkpoints are called metrics and they are clubbed together into logical blocks (like system exceptions, performance, availability). In this case there is a system exception due to too many short dumps today.

You can open the graph for this metric to see the details in time:

By clicking on the start and to date, you can select the date/time range or use the Select Time Frame button for a predefined time range:

Summary

The overview above gives the top – down approach in full: from the total landscape, to single system, to group of metrics to single metric.

For more System Monitoring usability tips & tricks, read this dedicated blog.

Guidelines for fine-tuning and tweaking the alert metrics via templates are explained in this blog.

A special type of monitor is the System Down monitor, which focuses on availability of systems. Read more in this dedicated blog.