Activating statistical records in Focused Run…

Focused Run has functions to fetch ST03N data from ABAP backend systems and use the data for analysis in SAP Focused Run System Analysis functions.

System analysis SSI activation

First step is to switch on the general functions for system analysis during SSI activation. Full help link from SAP can be found here.

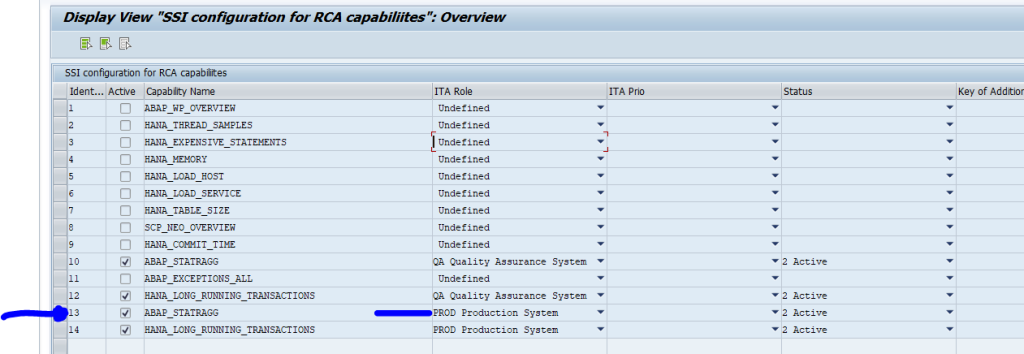
In Focused Run start SM30 for table RCA_SSI_CONF and add entry for activation:

Repeat SSI

For the system that you want to have ST03N data collected, you need to repeat the SSI.

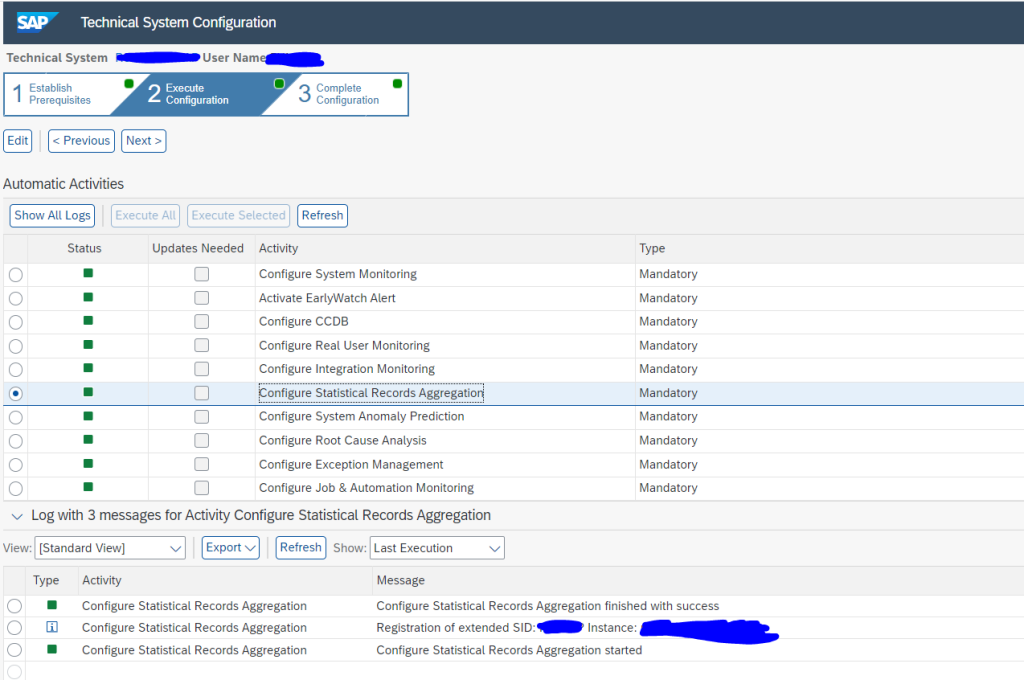
Check the detailed step in the SSI for the Statistical records aggregation:

Activate per system in System Analysis

Next step is to activate it per system in System Analysis:

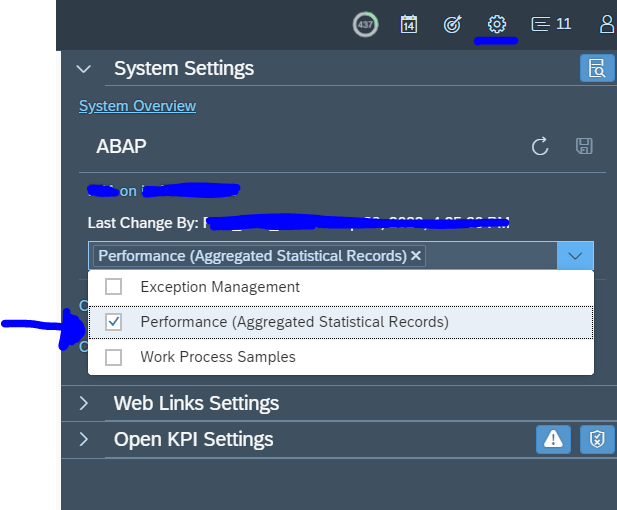
Go to the settings per system and make sure Performance (aggregated statistical records) is activated:

Overview of all systems

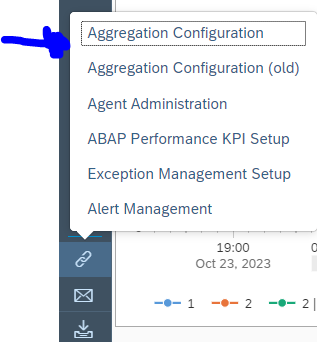
In System Analysis, go to the bottom left tool section to open the Aggregation Configuration tool:

The overview page opens:

Now you can see both configuration and data collection is ok.
System analysis…

System analysis is part of the Root Cause analysis functions of Focused Run. It can be used for issues analysis of current issues and for longer term trending.

Questions that will be answered in this blog are:

  • How can I start execute System Analysis for a system?
  • Which type of systems can be analysed with System Analysis?
  • How can I use the System Analysis tool for immediate analysis of issues with a system?
  • How can I use the System Analysis tool for getting insight in the longer term trends inside a system?

System analysis

Start the system analysis function by clicking on the FIORI tile for System Analysis:

Select the system you need to analyze for issues in the scope selection screen. In the first case we take an ABAP stack with time frame of the last 6 hours:

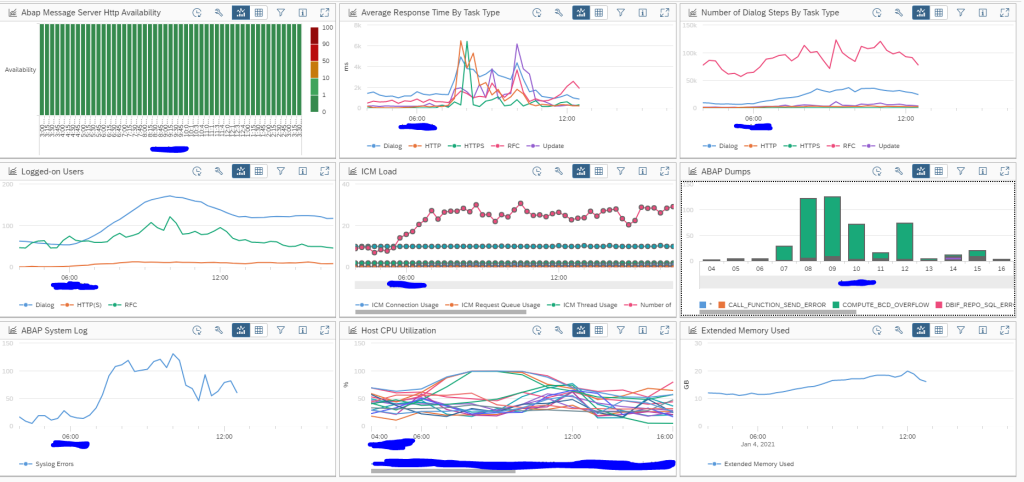
This overview might be bit overwhelming the first time. But you can see the performance was bad in the middle of the day (see top middle graph on average response time). Bottom middle graph shows CPU of some application servers was at 100%. And at the same time there were many dumps (right middle graph). This gives a clear direction were to look for issues.

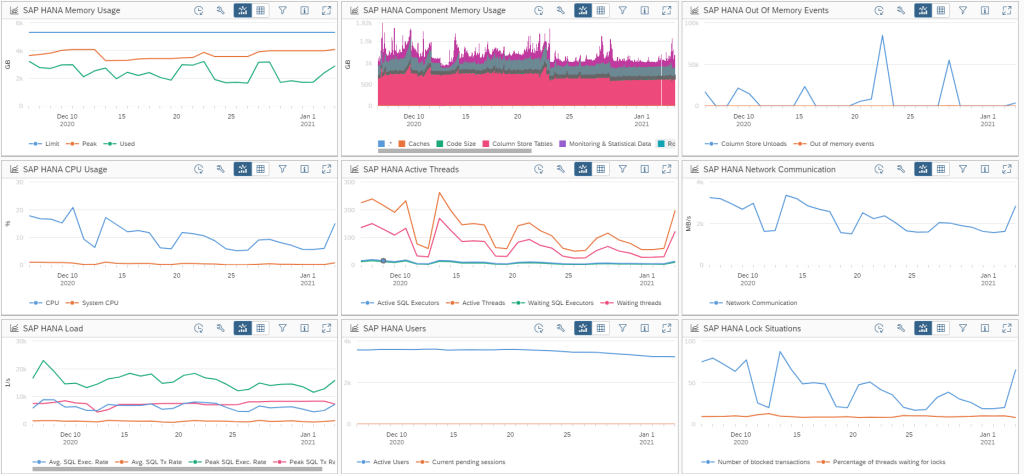
The system analysis overview adjusts the information automatically to its content. This is the information for a HANA system:

Note here that the time frame here is from the last month. This is for getting longer term overview of the system behaviour. You can get this longer term overview by changing the time frame of the system analysis tool.

Page catalog

You can select a specific view from the page catalog list on the left button bar on the screen:

So you can easily filter the specific page for the type of system you need to analyze.