OCC dashboards are the most flexible form of dashboarding in SAP Focused Run. It is completely up to you to define any dashboard based on the available data.
The explanation below will give a quick introduction on how to setup a dashboard with as example a line graph with CPU for one system and amount of short dumps per hour for that system in a bar chart.
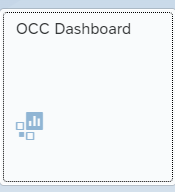
Set up new dashboard
Start the OCC dashboard FIORI tile:
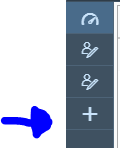
Click the add a new dashboard icon on the left:
Now open on the right hand side icon the personalization. Here you can change the default 2 by 1 layout if want as well:
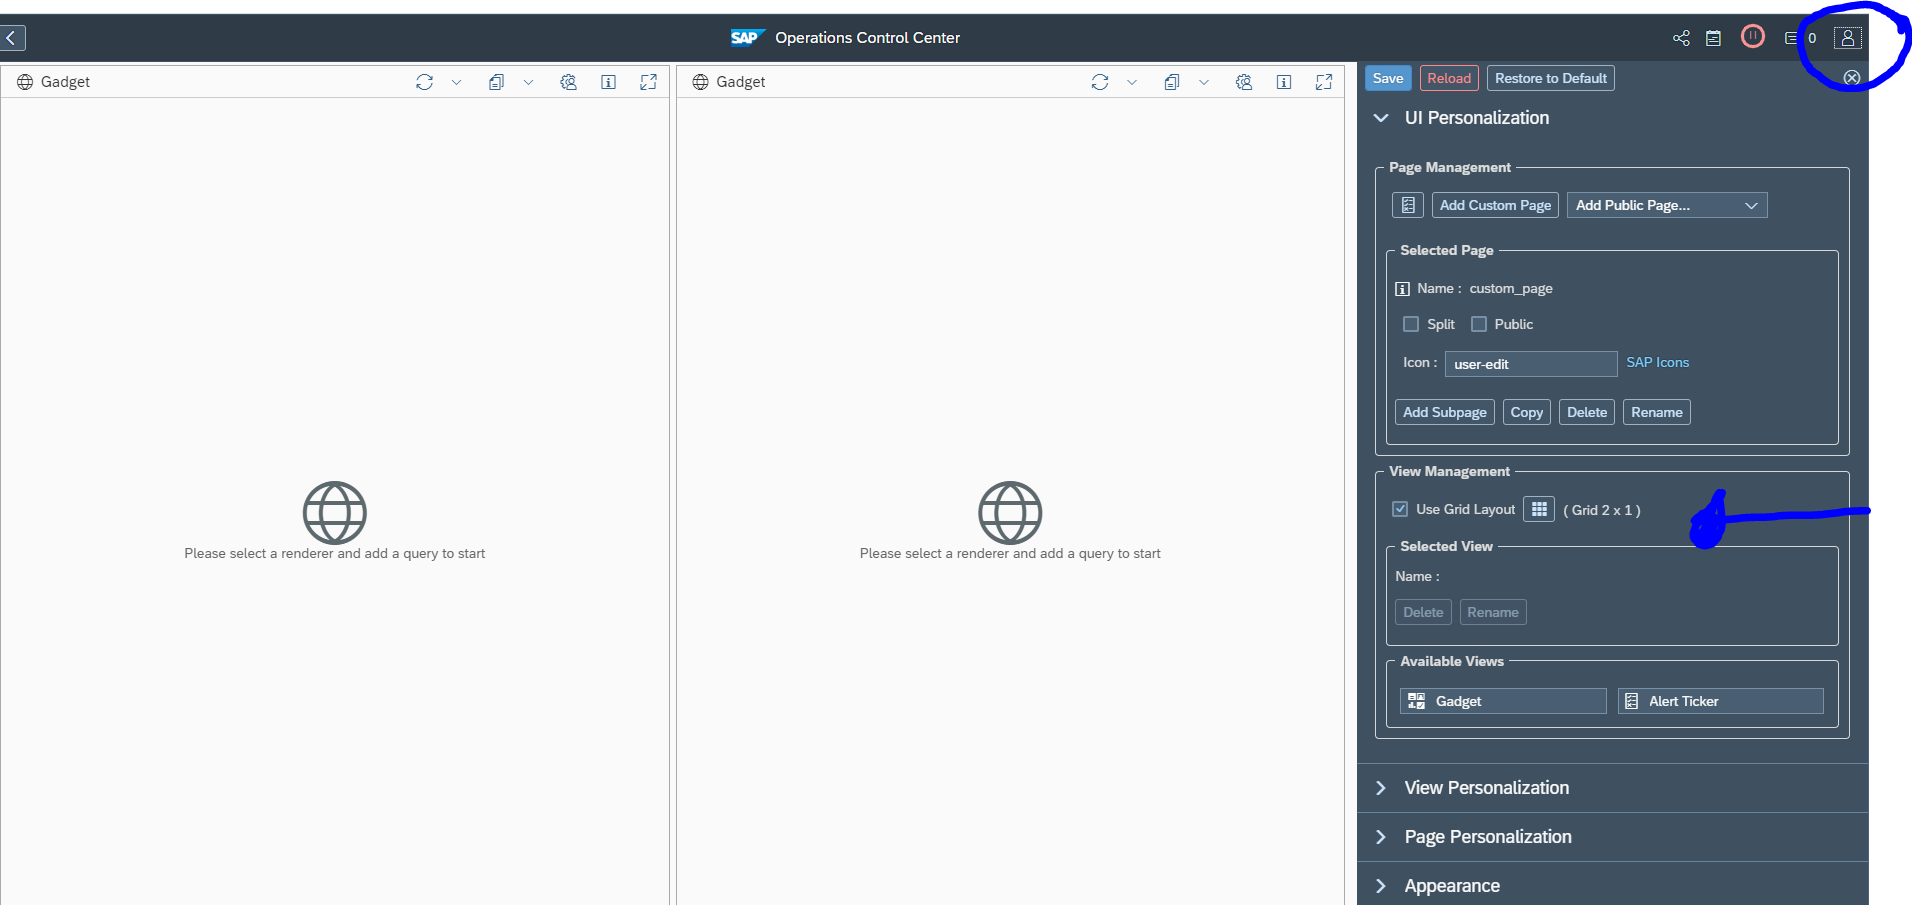
Now per gadget, select the personalization. First choose the type of graph, then select the query details:

Add the query by clicking the Plus sign:
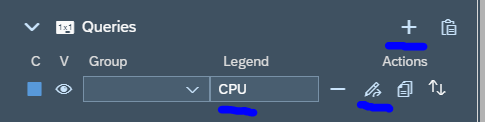
Give the legend a name and press the Change query button:

First select the data source. In this example we choose system monitoring. Select next your system, and select the metric (in this case CPU). Don’t forget to save on top of the personalization!

We repeat for the other gadget, but now select short dumps per last hour as example:
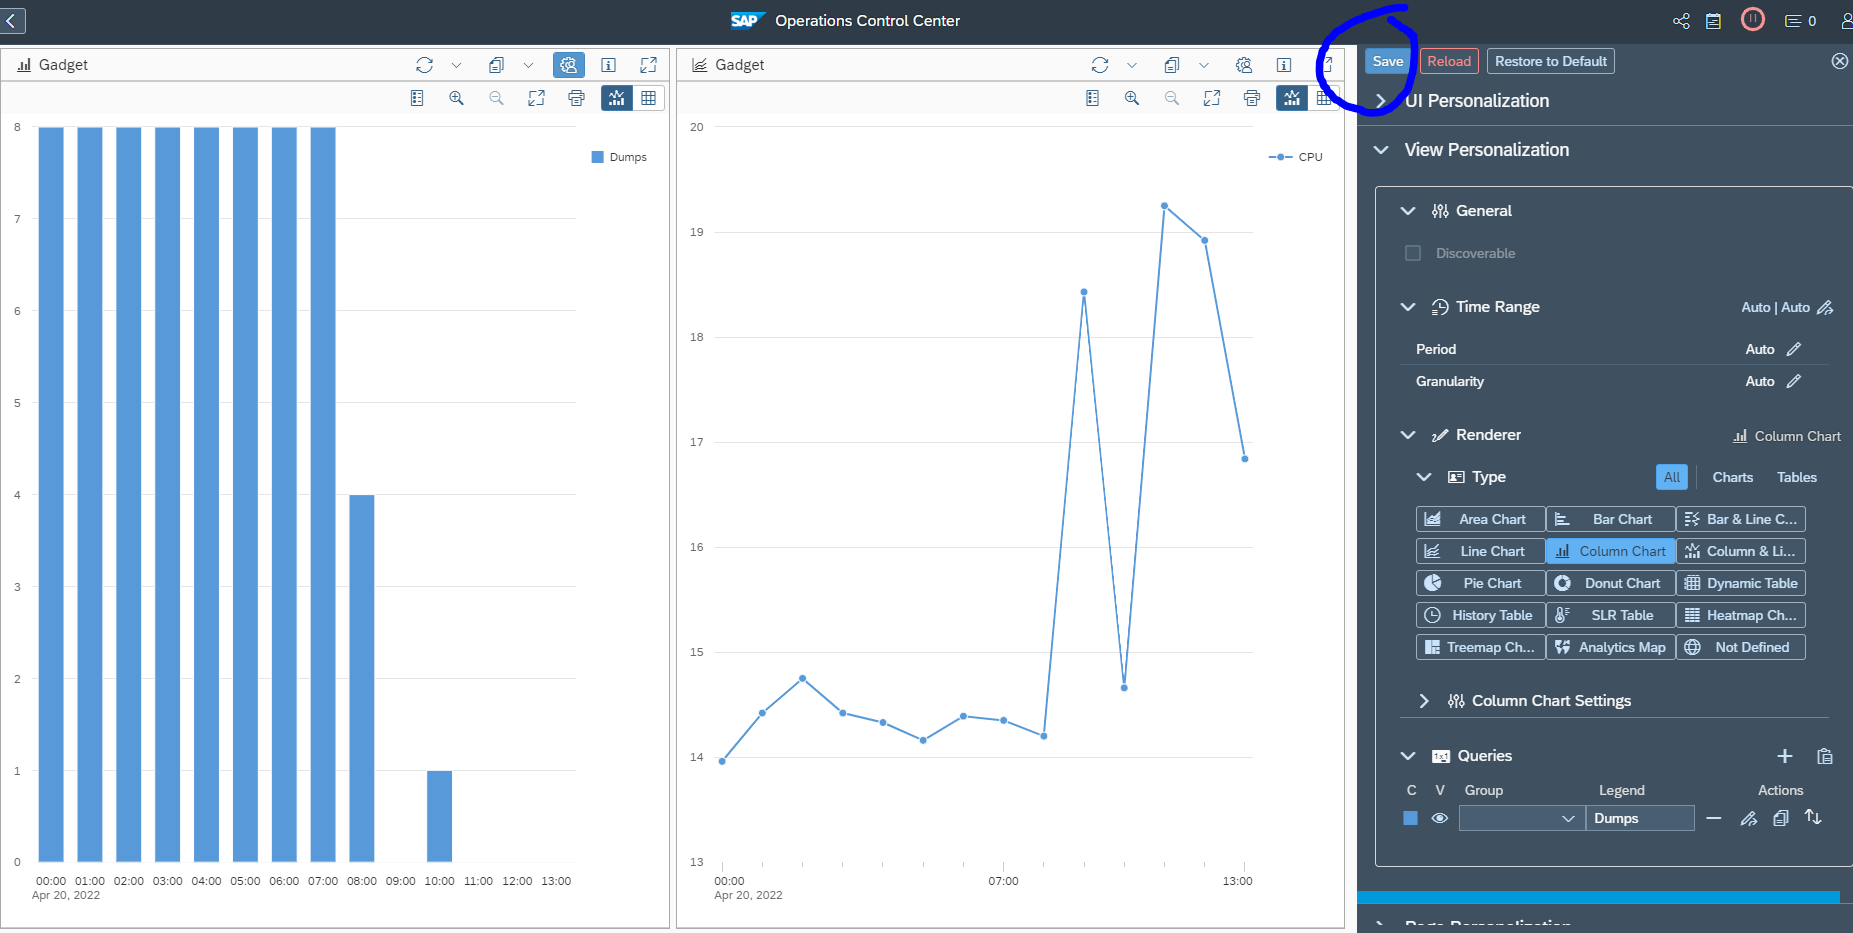
Test your dashboard to see if the results are according to your expectation.
Make dashboard public
If you are happy with your dashboard, you can make it public. To do so, go to the personalization options:
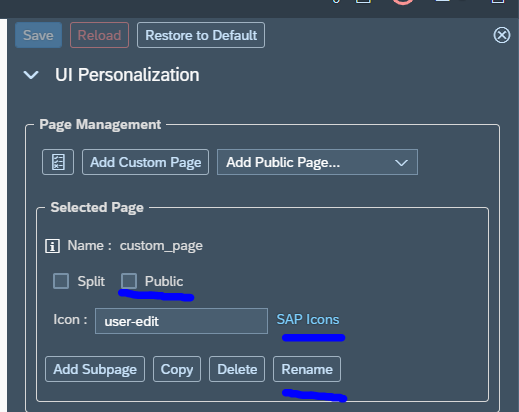
Set the selected page to public, select a proper icon, and rename the default user-edit to a proper name and don’t forget to Save.
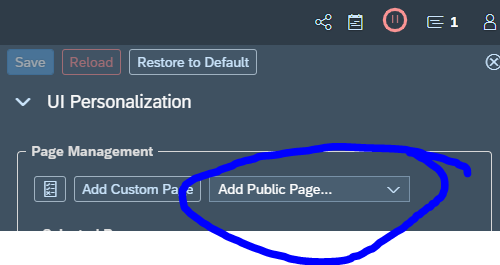
Other users can now add you dashboard from their UI personalization menu by clicking the Add Public Page and add your dashboard:
Other examples
Examples on this blog site: trend for ABAP short dump.