This blog focuses specifically on SLT integration monitoring. Monitoring an SLT system itself is explained in this dedicated blog.
Set up SLT integration scenario
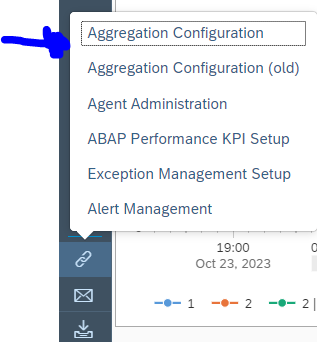
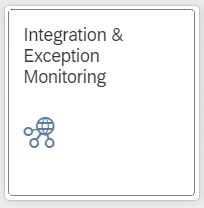
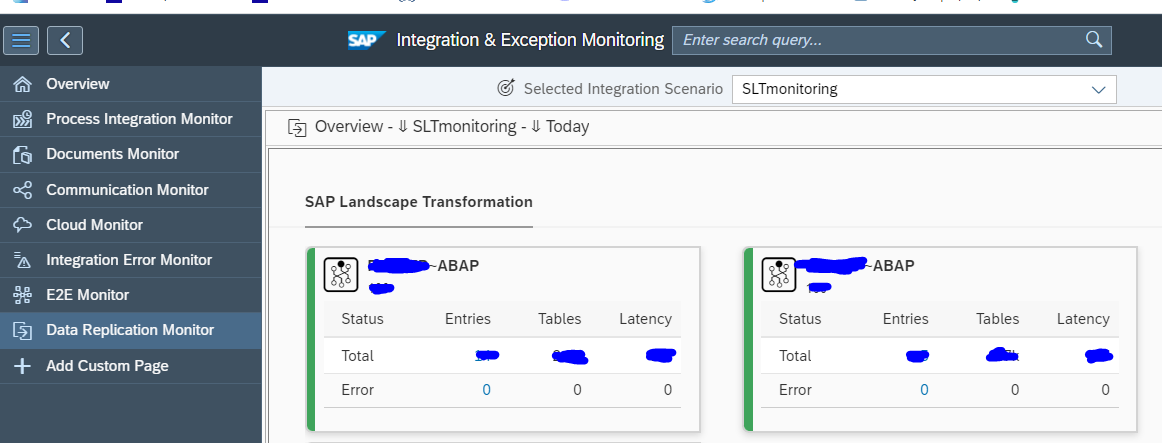
Start the integration and exception monitoring FIORI tile:
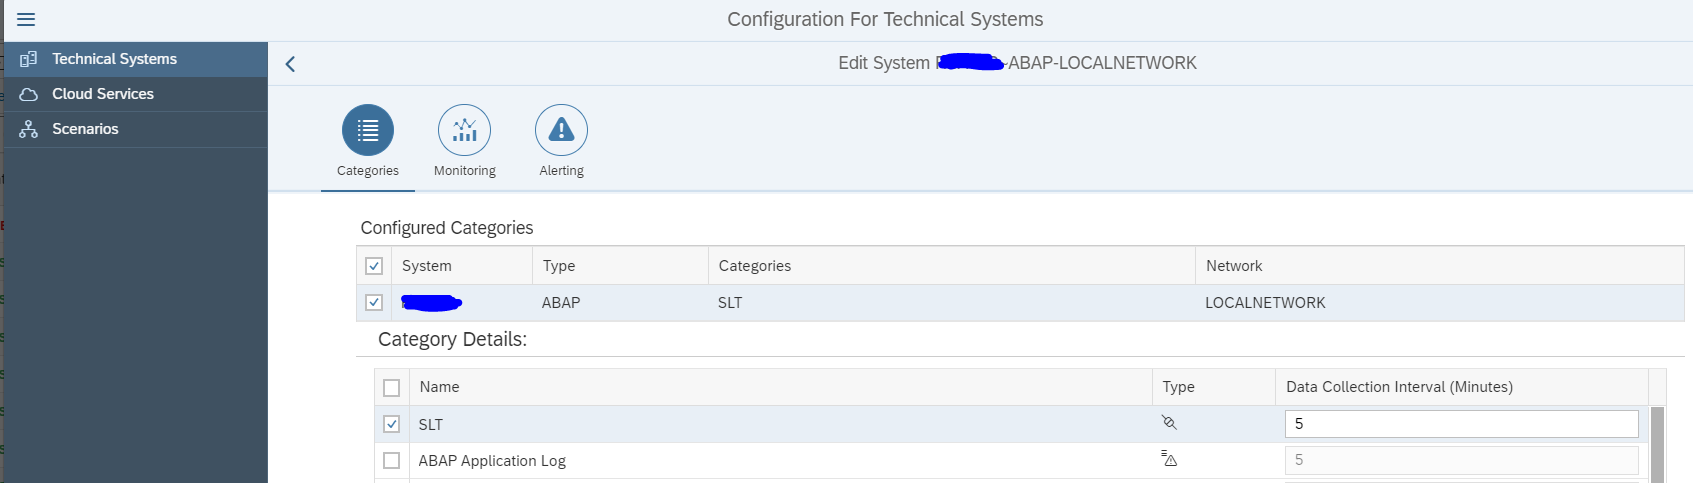
On the configuration add the SLT system:
Select SLT as specific scenario:
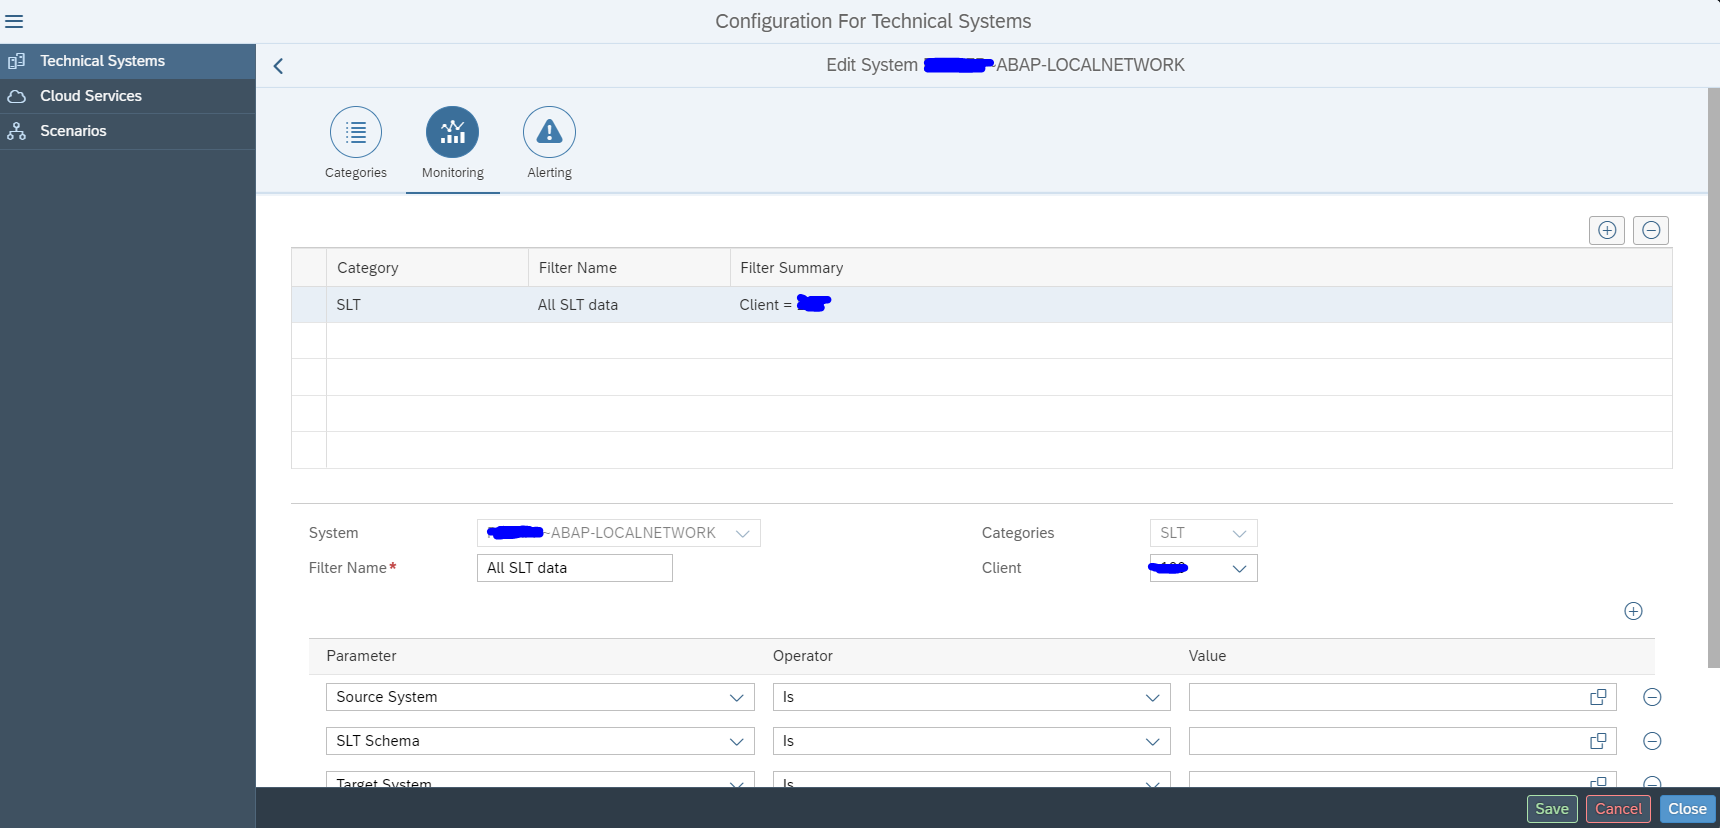
On the Monitoring part you can filter on a specific source system and/or SLT schema:
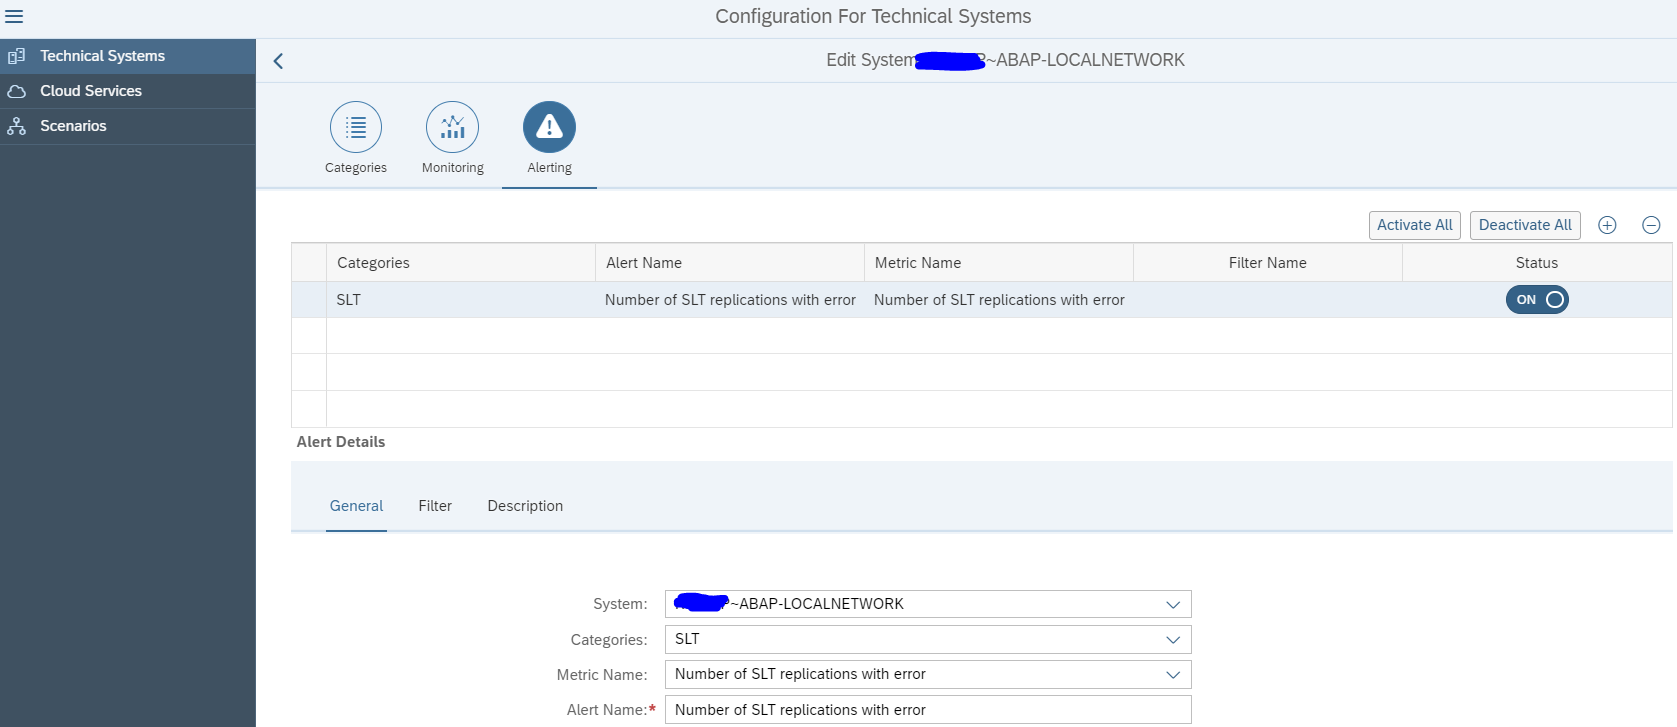
On the 3rd tab you can set the Alerting in cases of errors:
Now save and activate. The monitoring is active now.
Next step is to use this system in a model for your scenario:
Using the SLT integration monitor
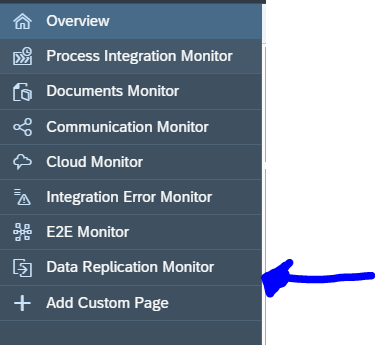
If you open the FIORI tile and you have selected your scenario, you still need to perform an extra click to go to the SLT monitor:
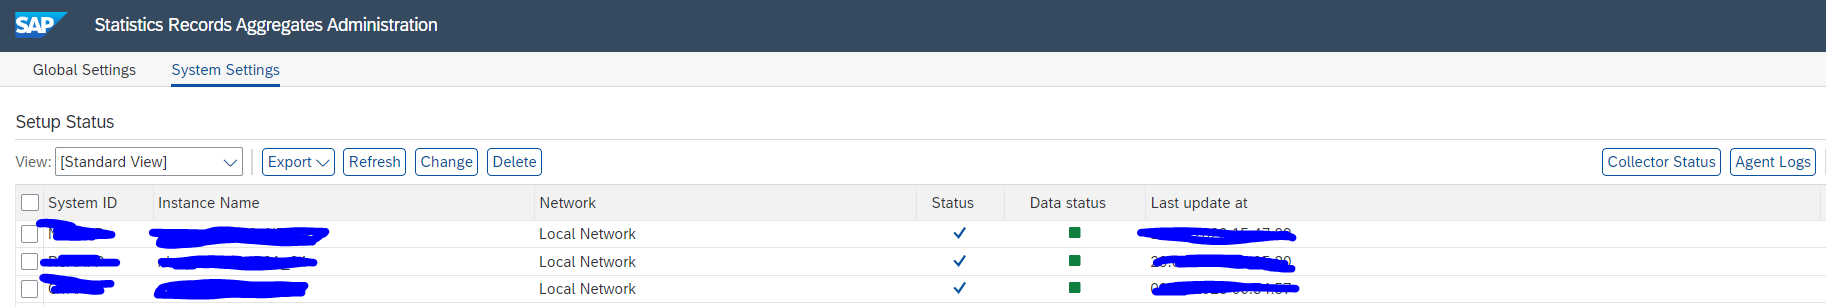
First you get overview of your system(s):
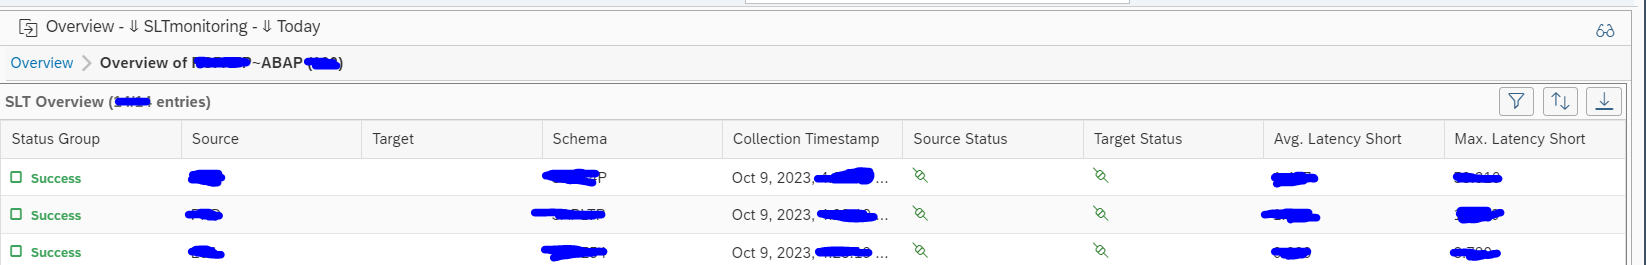
You need to click on the blue numbers to drill down:
This gives overview of errors, source connection status and target connection status.
You cannot drill down further on this tile. If you see an error, you need to go to your SLT server and start transaction LTRO to see all detailed error and start fixing from there. Transaction LTRO can have errors shown that are not visible in transaction LTRC. Focused Run uses LTRO data.
This blog will focus on monitoring of standalone web dispatchers. Standalone web dispatchers are used to load balance web traffic towards ABAP and/or JAVA systems. Common use case is to have web dispatcher for a large Netweaver Gateway FIORI installation.
Monitoring productive cloud web dispatchers
Monitoring of web dispatchers focuses on availability and connectivity/performance.
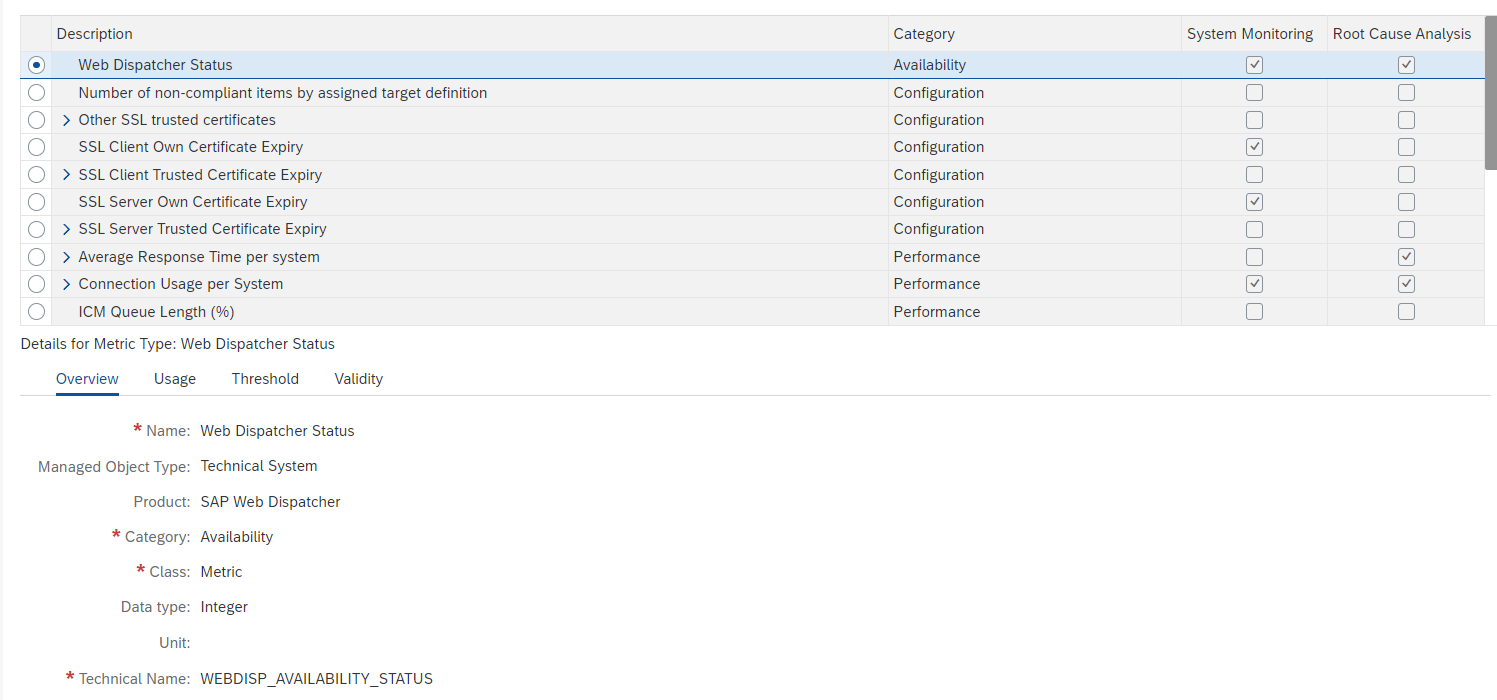
The web dispatcher template contains most needed elements out of the box:
Issues with performance are often caused by limitations set in the web dispatcher configuration. Keep these settings active.
You might want to add specific custom metric to monitor the most important URL for your web dispatcher. Read more in this specific blog.
Next to this setup the normal host monitoring to make sure the file system and CPU of the web dispatcher are not filling up and causing availability issues for the web dispatcher function.
Monitoring non-productive web dispatcher systems
For monitoring non-productive web dispatcher systems, it is normally sufficient to restrict to host and availability monitoring.
This might be taking the most time in larger organizations. SAP will allow 1 Cloud ALM per customer. But the customer might have multiple SAP systems managed by multiple SAP competence centers. In this case, you need to align who will call off the Cloud ALM system.
Identity provider choice
You can use Cloud ALM with integration to your own corporate identity provider or use the SAP IAS (Identity Authentication Service).
Content servers are often used to store attachment and data archiving files. They are technical systems with usually no direct access for end user. End users normally fetch and store data form content server via an ABAP or JAVA application.
The main part of content server monitoring is availability.
ABAP connection to content server monitoring
In some cases both your ABAP stack and content server are up and running, but communication between them is failing on application level. This leads to not working system for end users. Root causes can be firewall issues, certificate issues, or somebody altered settings.
To test the ABAP system connection to content server a custom ABAP program is needed. See this blog. You can schedule the program in batch and set up a new custom metric to capture the system log entry written by the program.
System host template
For system host the regular CPU, memory, disc template is sufficient. Finetune the thresholds to your comfort level.
Database template
Important items of the database template:
Database availability
Database health checks
Backup
In most installations it is chosen to install Content Server with the SAP MaxDB database (similar to LiveCache).
This blog will explain the use of batch job monitoring in SAP Focused Run 4.0. If you are using older SAP Focused Run 3.0 version, read this blog. If you are on 3.0 and did not use batch job monitoring, then don’t. First upgrade to 4.0 to avoid conversion effort.
For setup of batch job monitoring in SAP Focused Run 4.0, read this blog.
New powerful functions in SAP Focused Run 4.0 on Analytics and Job trending are explained below.
Batch job monitoring
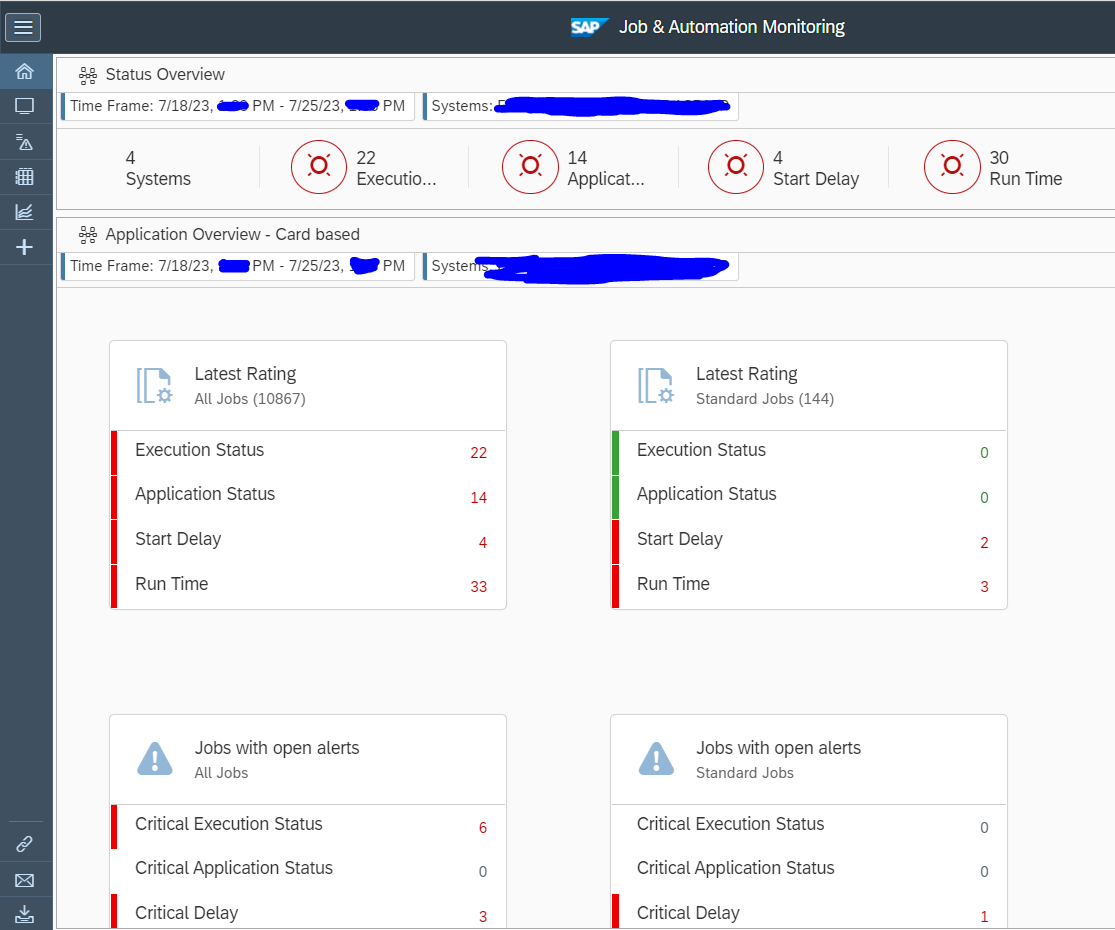
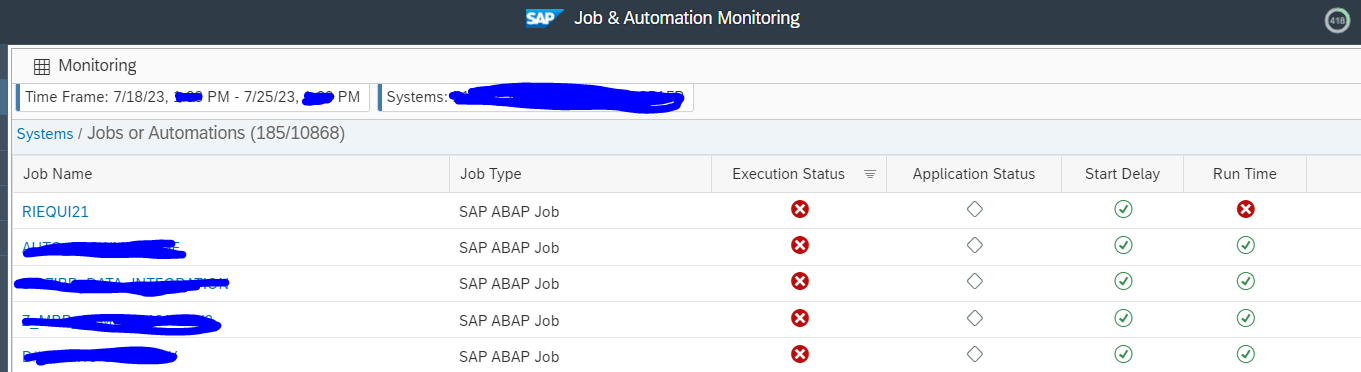
Batch job monitoring in SAP Focused Run is part of Job and Automation monitoring:
After opening the start screen and selecting the scope you get the total overview:
Click on the top round red errors to zoom in to the details (you can’t drill down on the cards below):
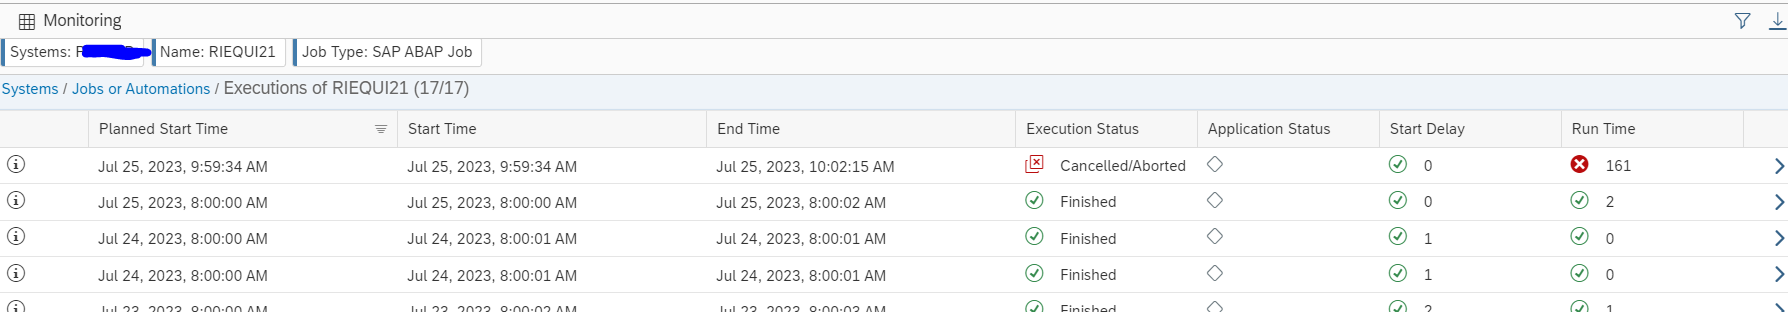
Click on the job to zoom in:
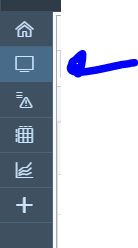
Systems overview
Click on the system monitoring button:
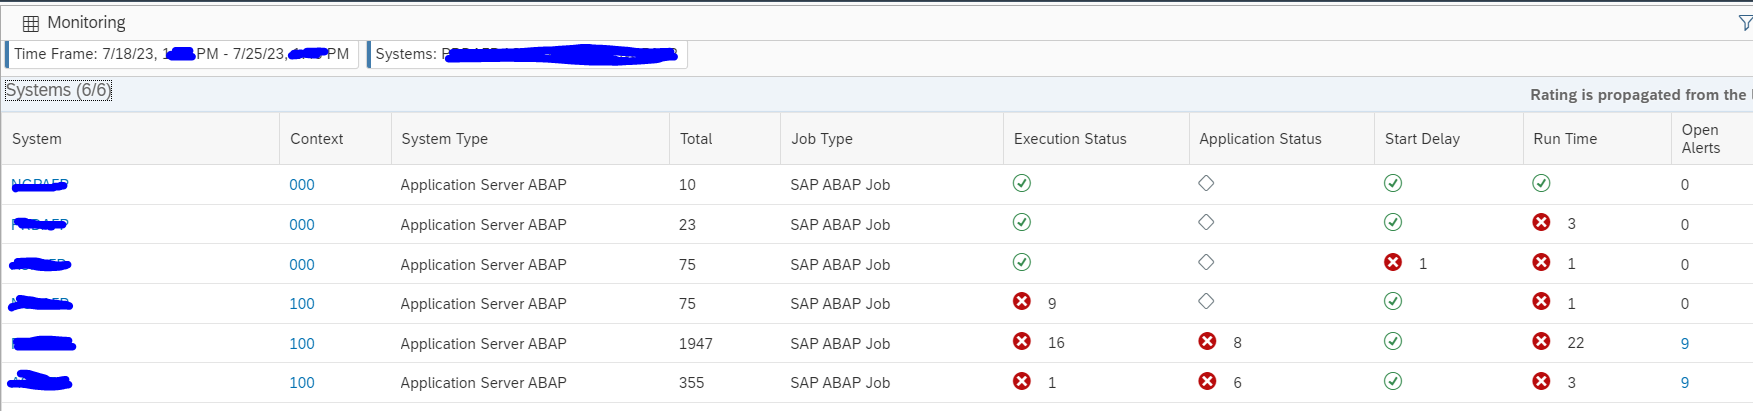
On the screen, zoom out on the overview by clicking the blue Systems text top left:
Now you get the overview per system:
Batch job analysis
Batch job analysis is a powerful function. Select it in the menu:
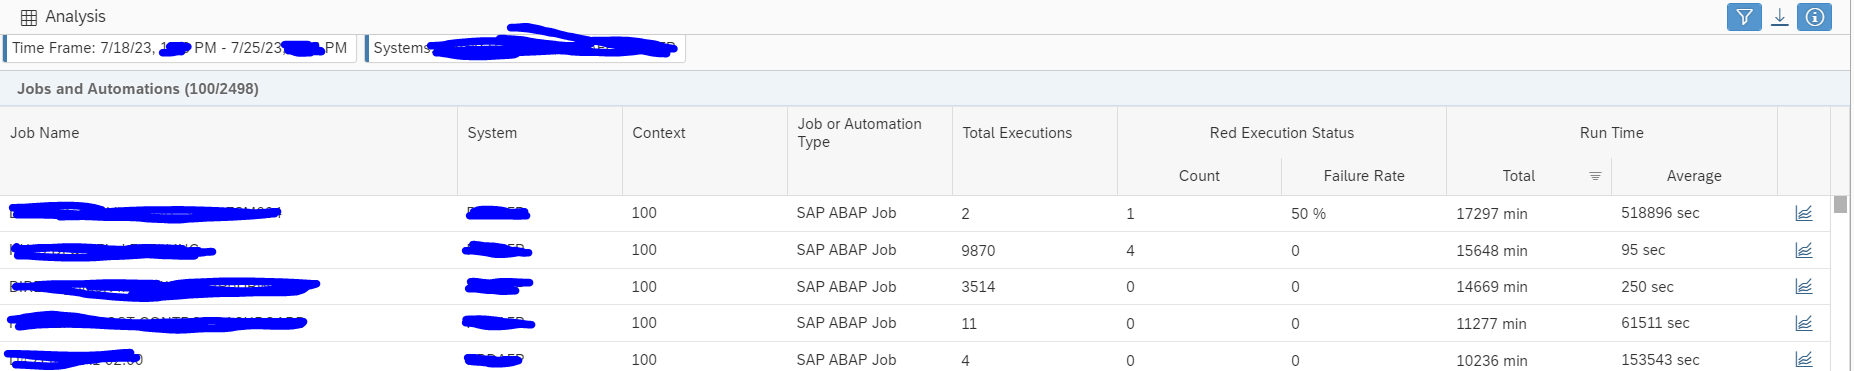
Result screen shows 1 week data by default:
The default sorting is on total run time.
Useful sortings:
Total run time: find the jobs that run long in your system in total. These most likely will also be the ones that cause high load, or business is waiting long for to finish to give results.
Average run time: find the jobs that take on average long time to run. By optimizing the code or batch job variant, the run time can be improved.
Failure rate: find the jobs that fail with a high %. Get the issues known and then address them.
Total executions: some jobs might simply be planned too frequently. Reduce the run frequency.
By clicking on the job trend icon at the end of the line you jump to the trend function.
Job trend function
From the analysis screen or by selecting the Trend graph button you reach the job trend function:
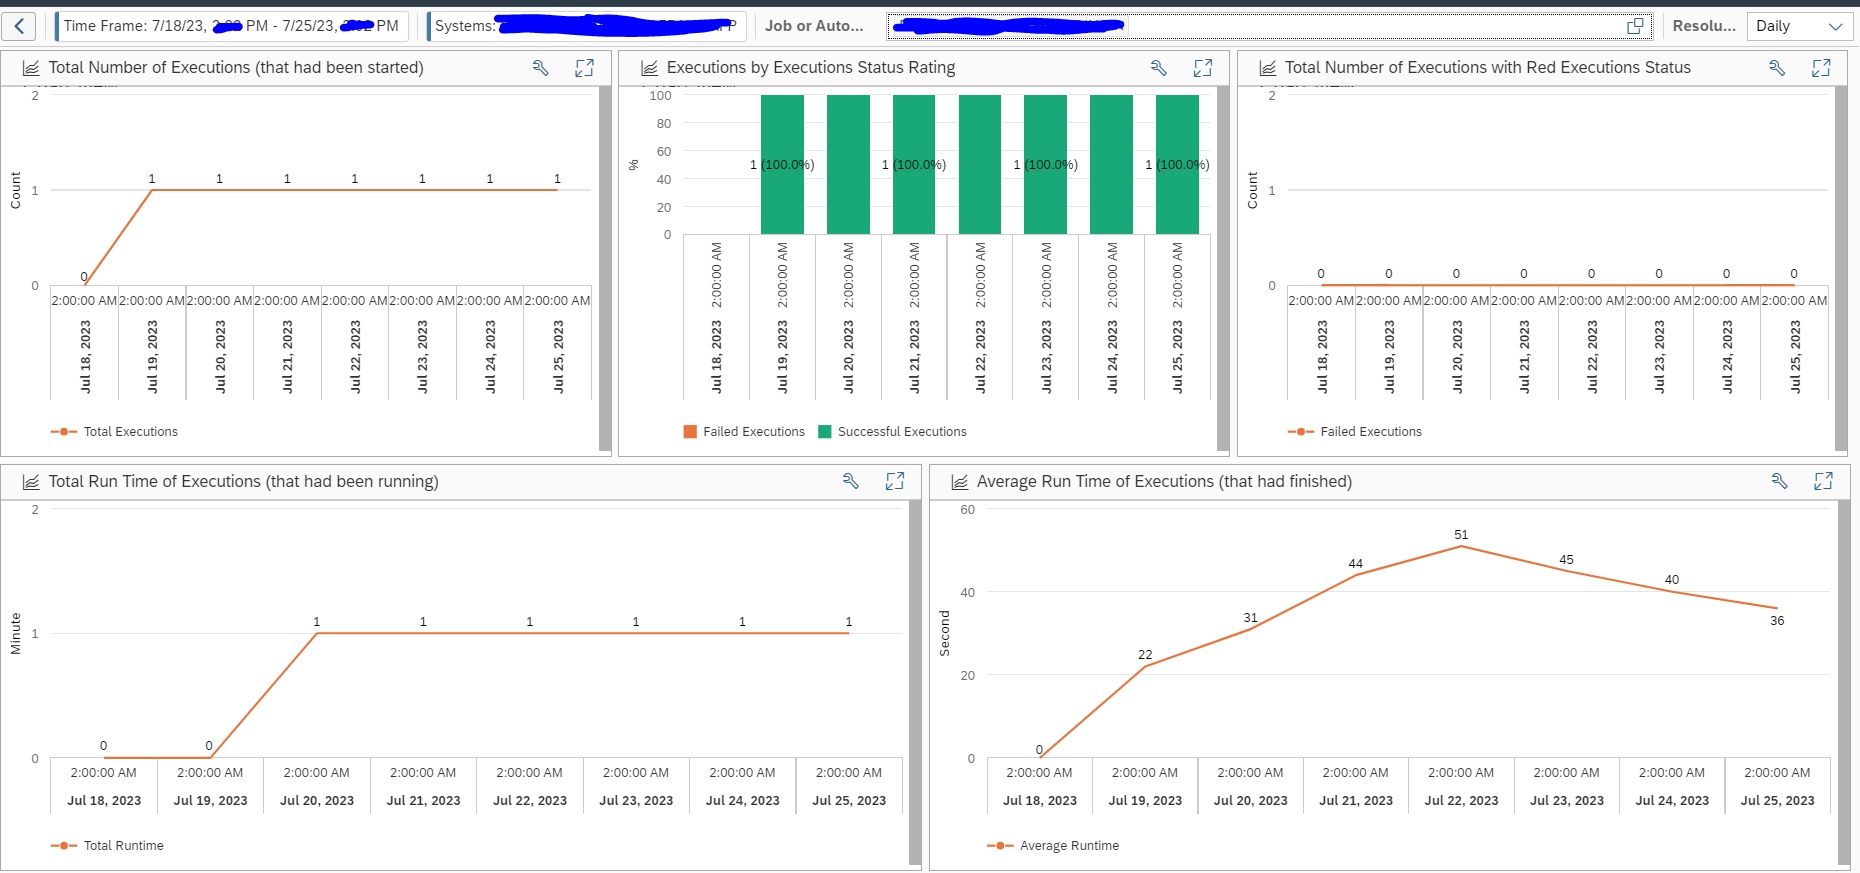
Select the job and it will show the trend for last week:
You can see if execution went fine, or not, and bottom right see average time the job took to complete.
In Focused Run 4.0 the batch job monitoring was revised. If you are using older version of Focused Run, read this blog on older batch job monitoring setup.
Batch job monitoring is now combined with other automation functions like process chain monitoring. Open this tile:
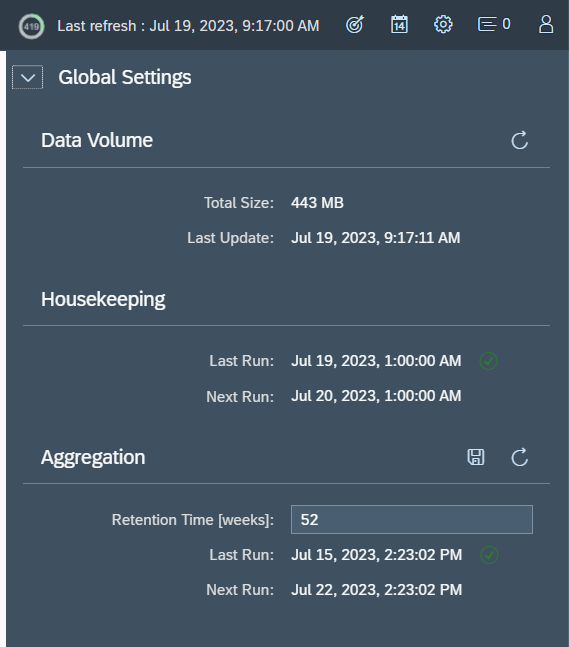
Global settings
For batch job monitoring settings, open the configuration and start with the global settings:
Here you can see the data volume used and set the retention time for how long aggregated data is kept.
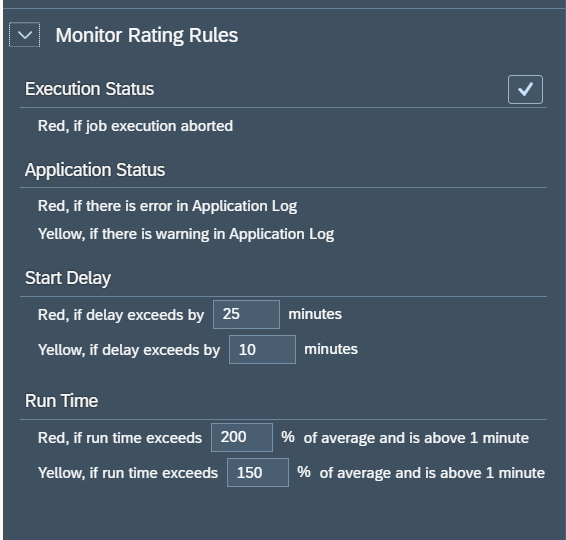
You can also set generic rating rules:
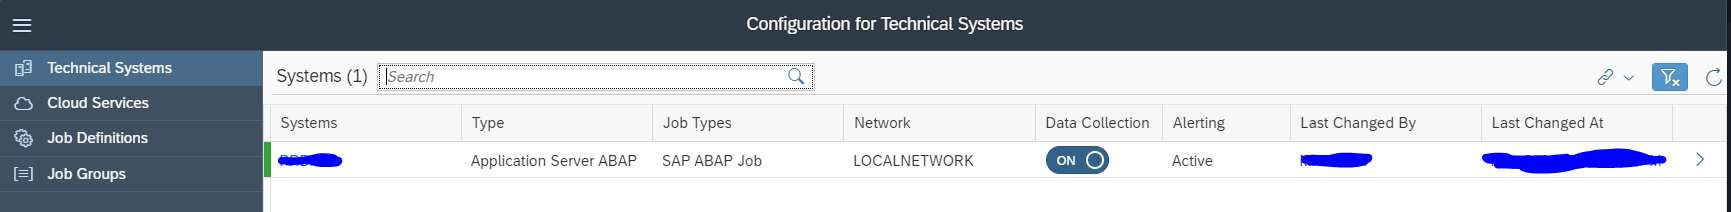
Activation per system
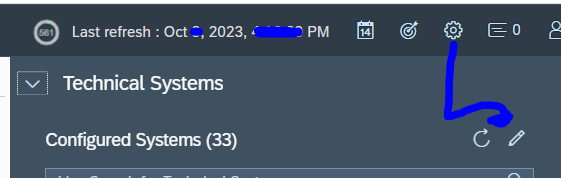
In the activation per system select the system and it will open the details:
First switch on the generic activation for each system.
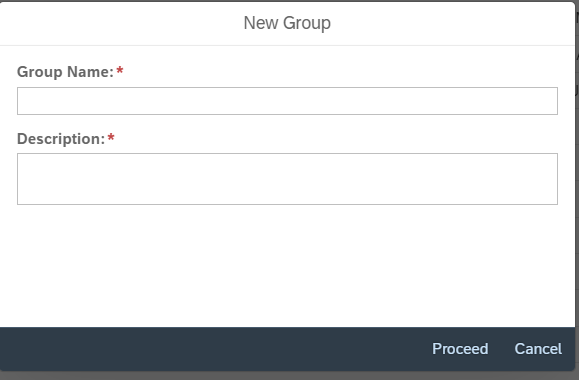
Activation of jobs to monitor
Now you can start creating a job group. First select left Job groups, then the Plus button top right:
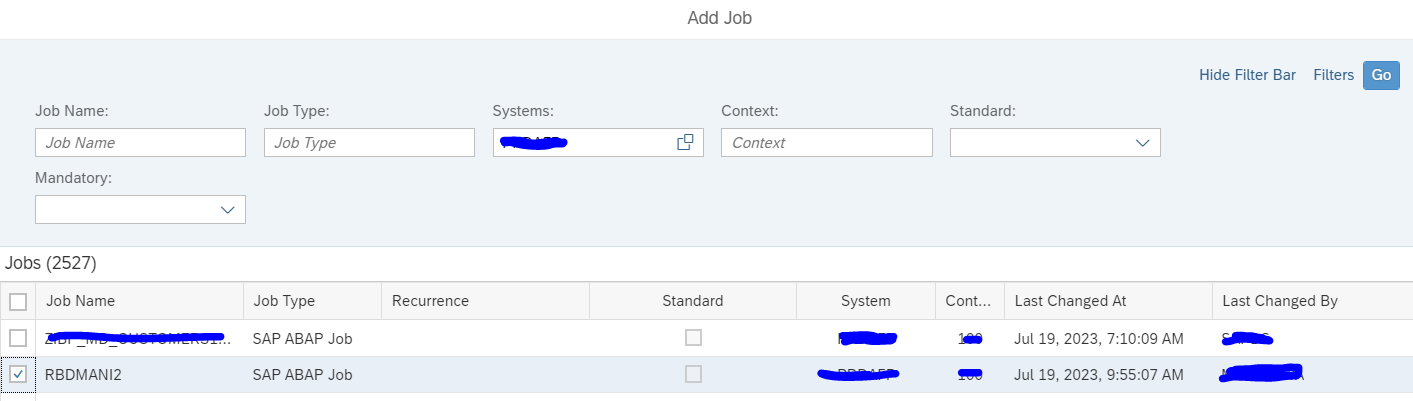
Add a job by clicking the plus button and search for the job:
Press Save to add the job to the monitoring.
Grouping logic
You can group jobs per logical block. For example you can group all basis jobs, all Finance jobs, etc. Or you can group jobs per system. Choice is up to you. Please read first the part on alerting. This might make you reconsider the grouping logic.
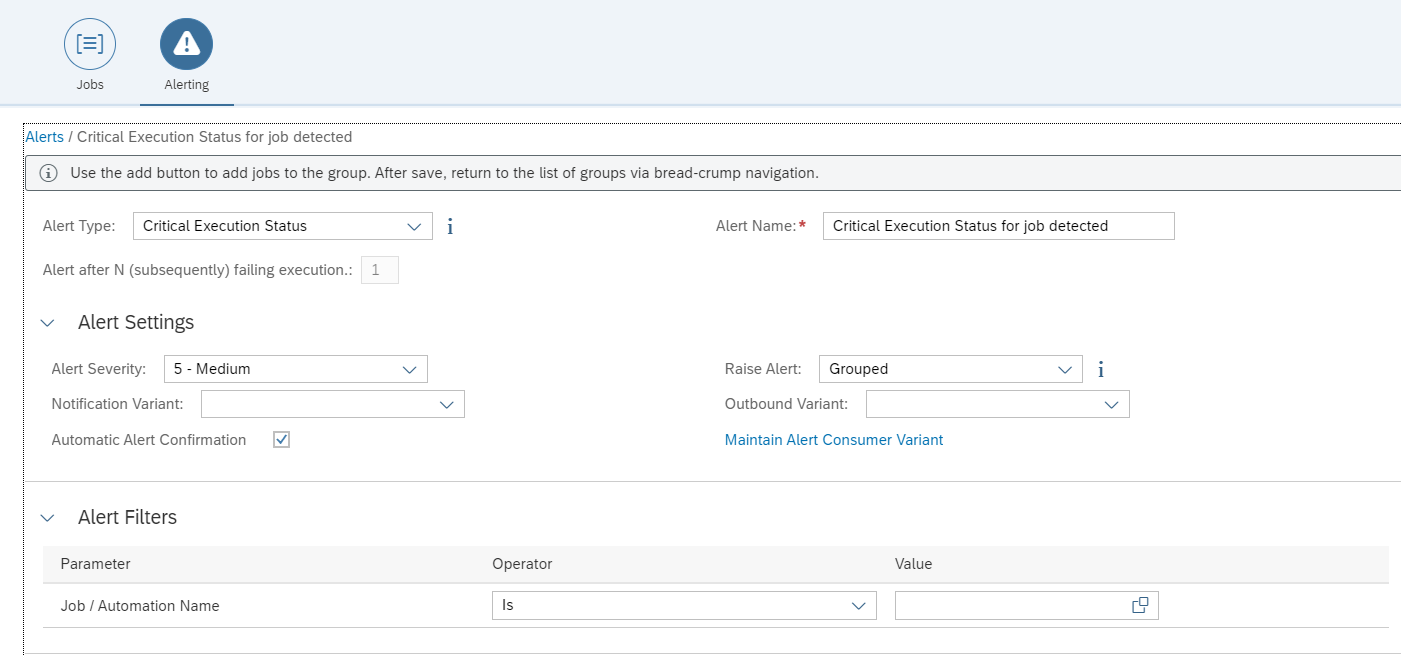
Adding alerting
The jobs added to the group are monitored. But alerting is a separate action.
Go to the Alerting part of the job group. And an alert. First select the Alert type (critical status, delay, runtime, missing a job). Assign a notification variant (who will get the alert mail), and decide on alert grouping or atomic alerts.
If you do not specify a filter it will apply for the complete group. You can also apply a filter here to select a sub group of the job group.
Based on the alerting you might want to reconsider the grouping.
SAP Cloud ALM and SAP Focused Run have a lot of overlapping capabilities.
The goal is not to push a tool, but to monitor, safeguard and secure SAP system running by customers. The tool is a means and not the goal.
What we will discuss:
High level positioning of Cloud ALM, Focused Run and Solution manager
Current status in 2023 for the tools
Possible considerations
This positioning blog is for the year 2023. Next year when new functions and insights are available the positioning and considerations can change.
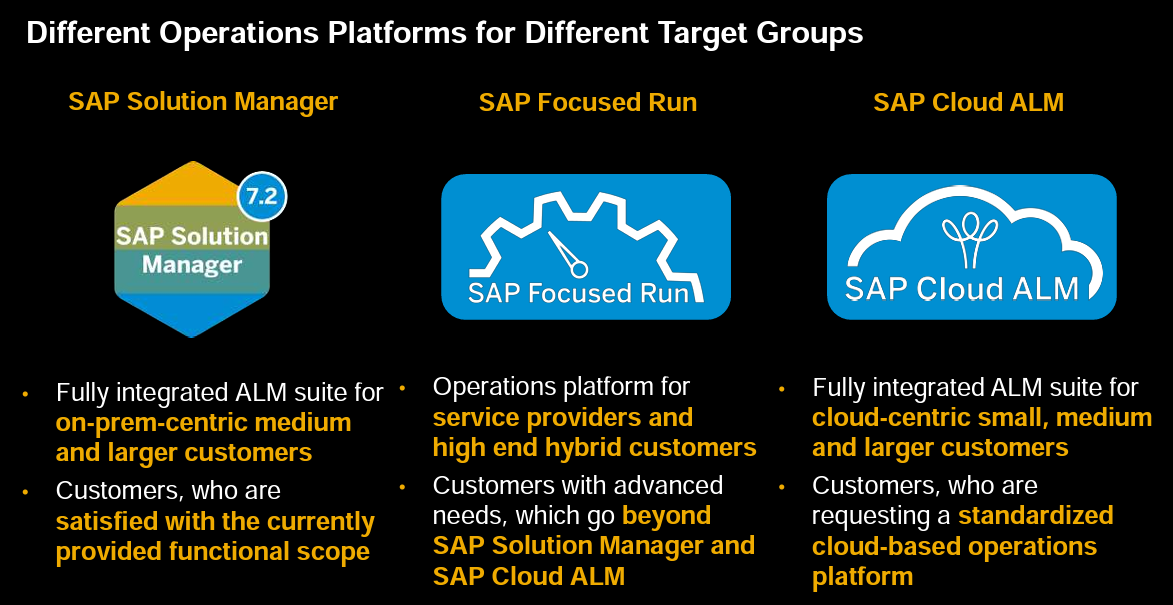
High level positioning of Cloud ALM, Focused Run and Solution manager
The below picture is the best one and is taken from the Focused Run overview presentation:
Positioning:
Solution manager: it works, but no new developments, supported until 31.12.2027
Focused Run: suitable for large customer and advanced needs
Cloud ALM: standardized setup
Cloud ALM vs Focused Run
Cloud ALM is a standardized SAP service. It has certain capabilities, but no extensions. Due to its standardized setup is can be made working very fast with a few clicks. The functions will work fast, but configuration options are limited to the use cases provided by SAP. Data volumes on Cloud ALM are not to be too high, since the UI’s are still designed for small and medium customers with lower amount of systems, alerts, etc.
Focused Run admins will be quick to adopt SAP Cloud ALM since there is a large similarity in concepts and UI.
Comparison table:
Dimension
Cloud ALM
Focused Run
Technical setup complexity
Low
Medium for ABAP, High for non-ABAP
Technical setup time
Low
Low to medium
Maintenance effort
Low
Medium
Upgrading to unlock new functions
No effort, SAP takes care
High effort to upgrade
Volume of data that can be handled
Low to medium
High to very high
Complexity of scenario’s that can be handled
Low
Low, medium, high
Extension possibilities
Very limited
Possible with API and custom code
Feature extensions
Fast, bi-weekly
Every half year major and minor features will be added
Current features
Limited, but growing fast
Extensive, don’t expect major extensions
Considerations
Currently running SAP solution manager
If you have functions running on SAP solution manager, first consideration is the move to SAP Cloud ALM. SAP solution manager hosts normally EWA, CHARM, documentation/implementation and/or monitoring functions. An SAP readiness check is available to check your move from SAP solution manager to Cloud ALM. Read this blog on the how.
Currently running SAP Focused Run
If you are currently running SAP Focused Run, you most likely will keep it the next few years. But still do keep track of the SAP Cloud ALM functions, and try them out.
SAP Cloud ALM might be a good solution to monitor less important systems with lower demand like sandboxes, development and test systems. These system typically don’t need intense monitoring, but mostly availability monitoring.
SAP Cloud ALM might be a good solution to monitor your SAP Cloud hosted and SAP BTP scenarios. Setup in Cloud ALM for these scenarios is far simpler than setting these up in SAP Focused Run.
SAP Focused Run will never be enabled for business process monitoring. That functionality is now available in SAP Solution manager and will only be available in the future in SAP Cloud ALM.
Monitoring solutions for running installations
If you have a running SAP installation and are looking for a good monitoring solution, then it is wise to check both SAP Cloud ALM and SAP Focused Run. Depending on your needs you can choose between both.
Check the road map of SAP Cloud ALM as well to see if missing gaps will be addressed in the upcoming year.
The business case for a monitoring solution is different per line of business. The main business case is roughly: “We will avoid or solve much faster Y major incidents per year. Each major incident costs is about xxx.xxx USD/EUR”.
New solutions
For new SAP solutions: first consider using SAP Cloud ALM. Only when expecting very high volume and very high monitoring requirements, set up SAP Focused Run.
Cloud ALM usage rights
Cloud ALM is in principle for free within the usage rights. The usage rights can be found on this link.
Important restrictions: 8 GB in size (in 2023) and only 1 Cloud ALM per customer.
Summary
SAP Cloud ALM functions are growing fast and are definitely worth using. SAP Cloud ALM is a highly standardized function. This makes it for SAP possible to deliver new functions fast and easy to integrate and easy to use. The highly standardized functions come with a setback that the solution cannot be extended to any particular need you might have.
This blog will focus on monitoring of Cloud Connector systems.
Monitoring productive cloud connector systems
The Cloud connector is used between on premise systems and Cloud solutions provided by SAP.
Monitoring of cloud connector focuses on availability and connectivity.
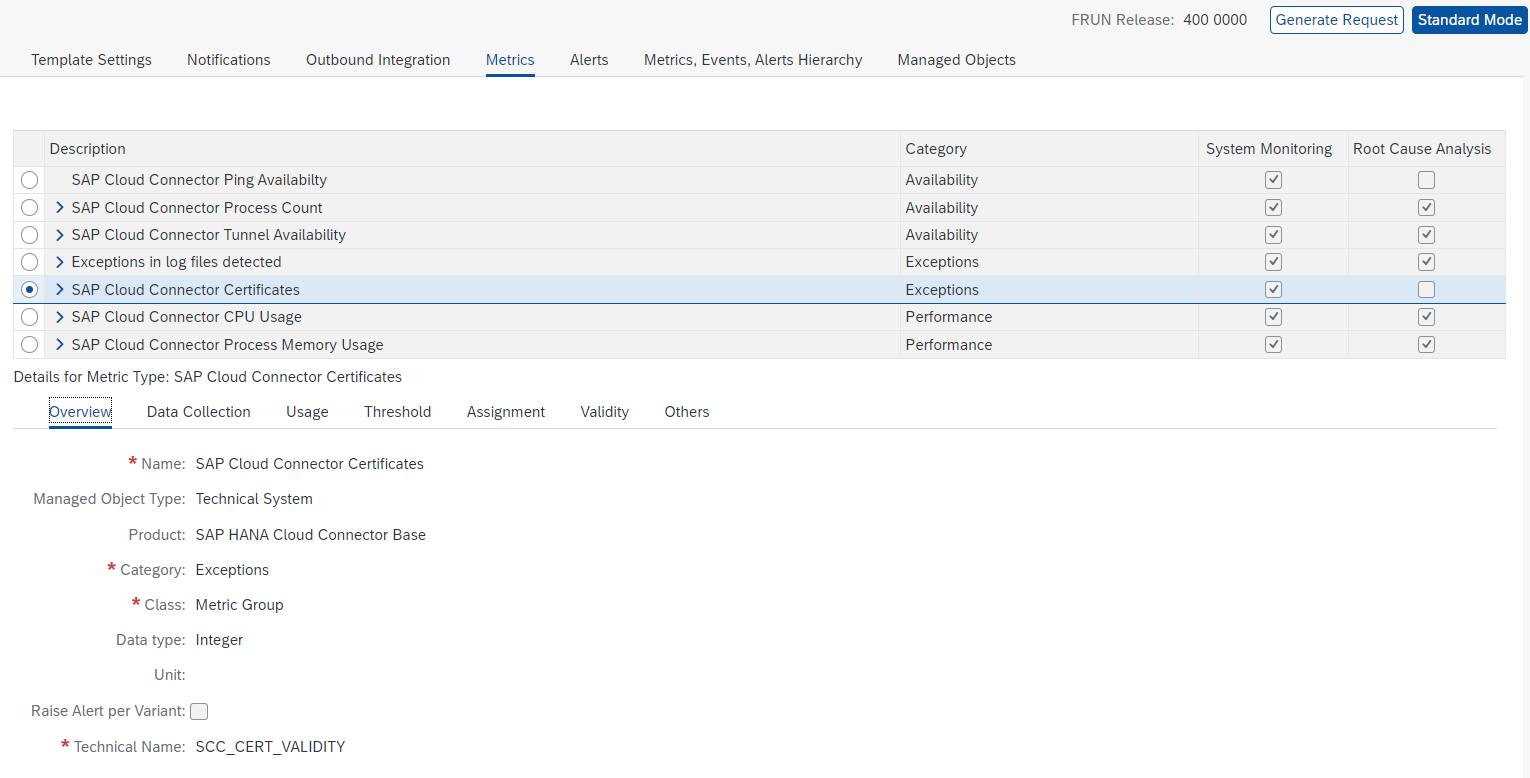
The cloud connector template contains all the needed elements out of the box:
If your landscape has only 1 cloud connector that is also used for non-productive systems, you might find a lot of issues in the non-productive system. Like expired certificates, channels not working, many logfile entries. If the cloud connector is very important for your business, it is best to split off the productive cloud connector from the non-productive usage.
This way you can apply sharp rule settings for production: even single issue will lead to alert. While on non-production the developers will be making a lot of issues as part of their developer process.
Monitoring non-productive cloud connector systems
In your landscape you might have a non-productive cloud connector that is used for testing purposes. In the non-productive cloud connectors you might apply a different template with less sensitive settings on certificates, logfiles and amount of tunnels that are failing.