This blog will give tips and tricks on the usability of System monitoring.
Questions that will be answered are:
- How to optimize the scope selection?
- How to use the tabular view?
- How to check a specific metric across multiple systems?
Optimizing scope selection
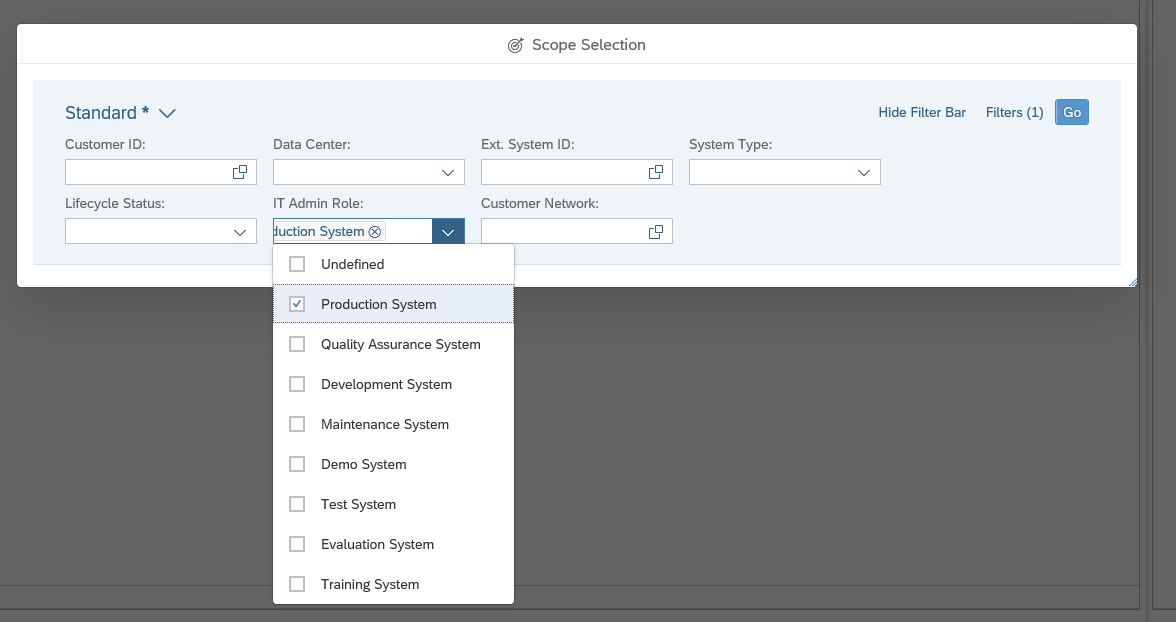
In the scope selection of systems, you can create a few variants to speed up your work.
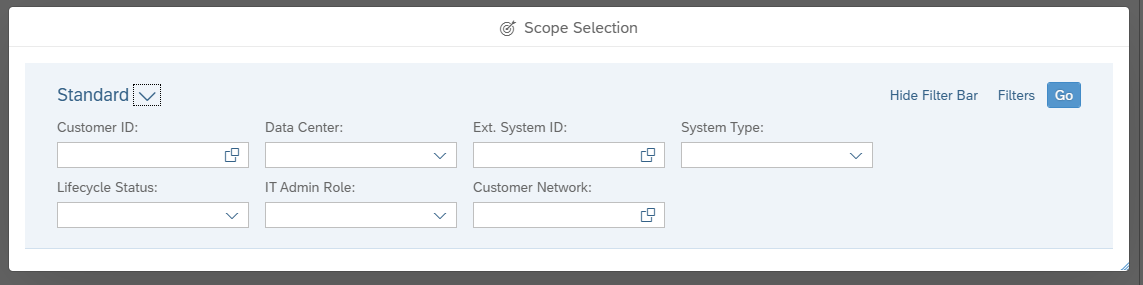
In this example we will setup a variant to quickly select all productive systems. In the scope selection block select the IT Admin Role for Productive System (setting the IT admin role is described in this blog):
Now select the down arrow next to Standard in the top left corner and select Save As:
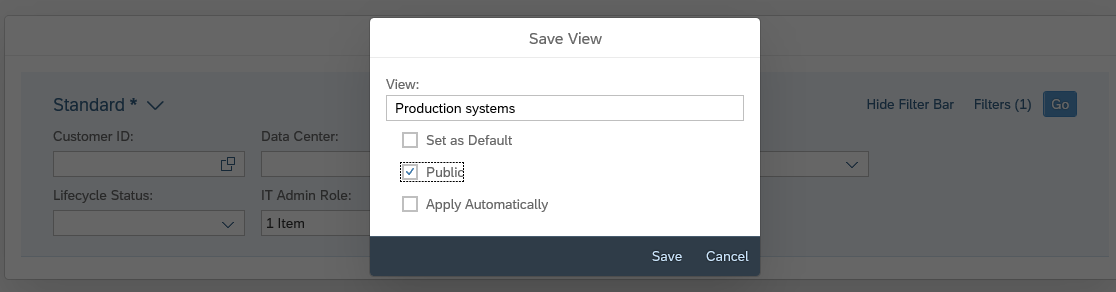
You can choose to set this variant as default. Setting it as public will make the variant available for all users. Selecting the Apply Automatically tickbox will apply this specific variant immediately. This might be preferable, or annoying. Just try it.
Upon pressing Save you will get a request for transport popup or save it as local request.
You can also create a similar view for non-production systems.
In the end you can always press the Manage button to change the variants and texts:
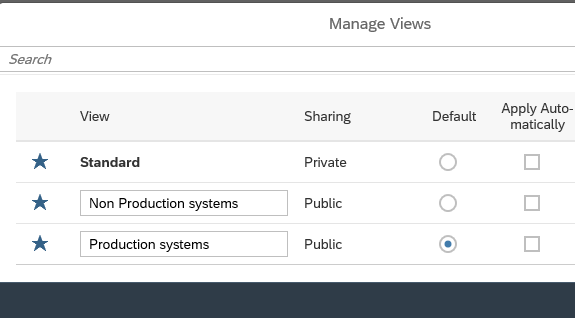
Now you can easily switch between scopes for production and non-production:

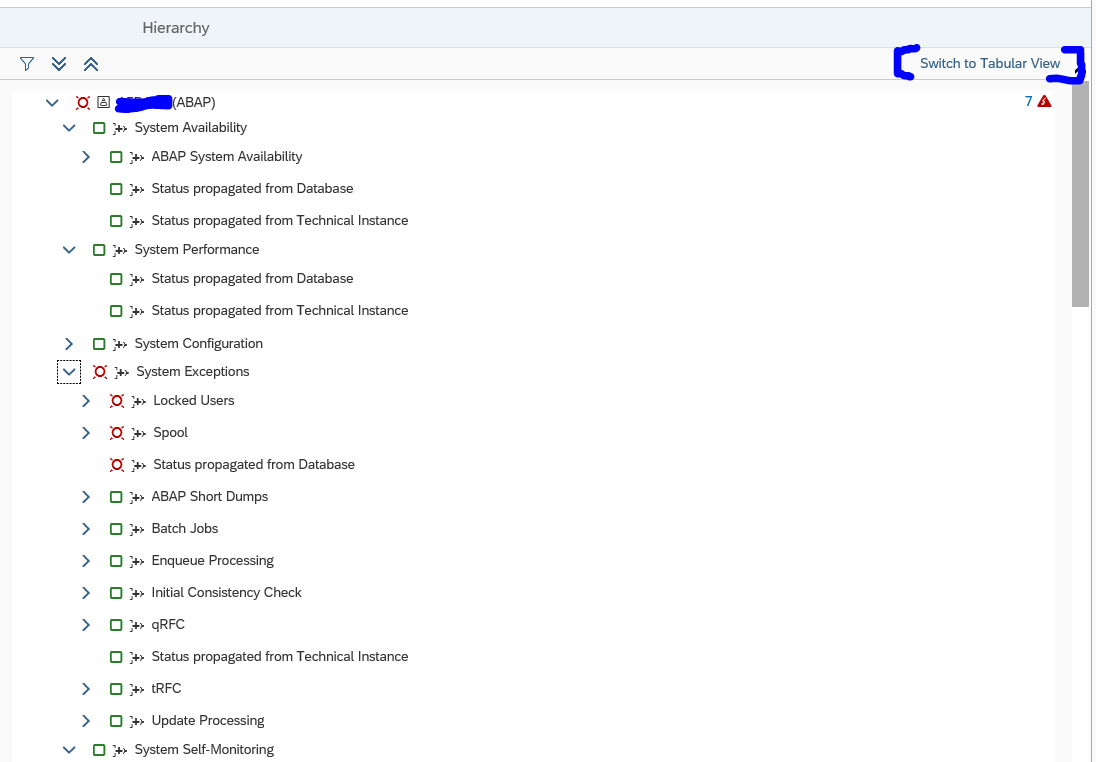
Using the tabular view
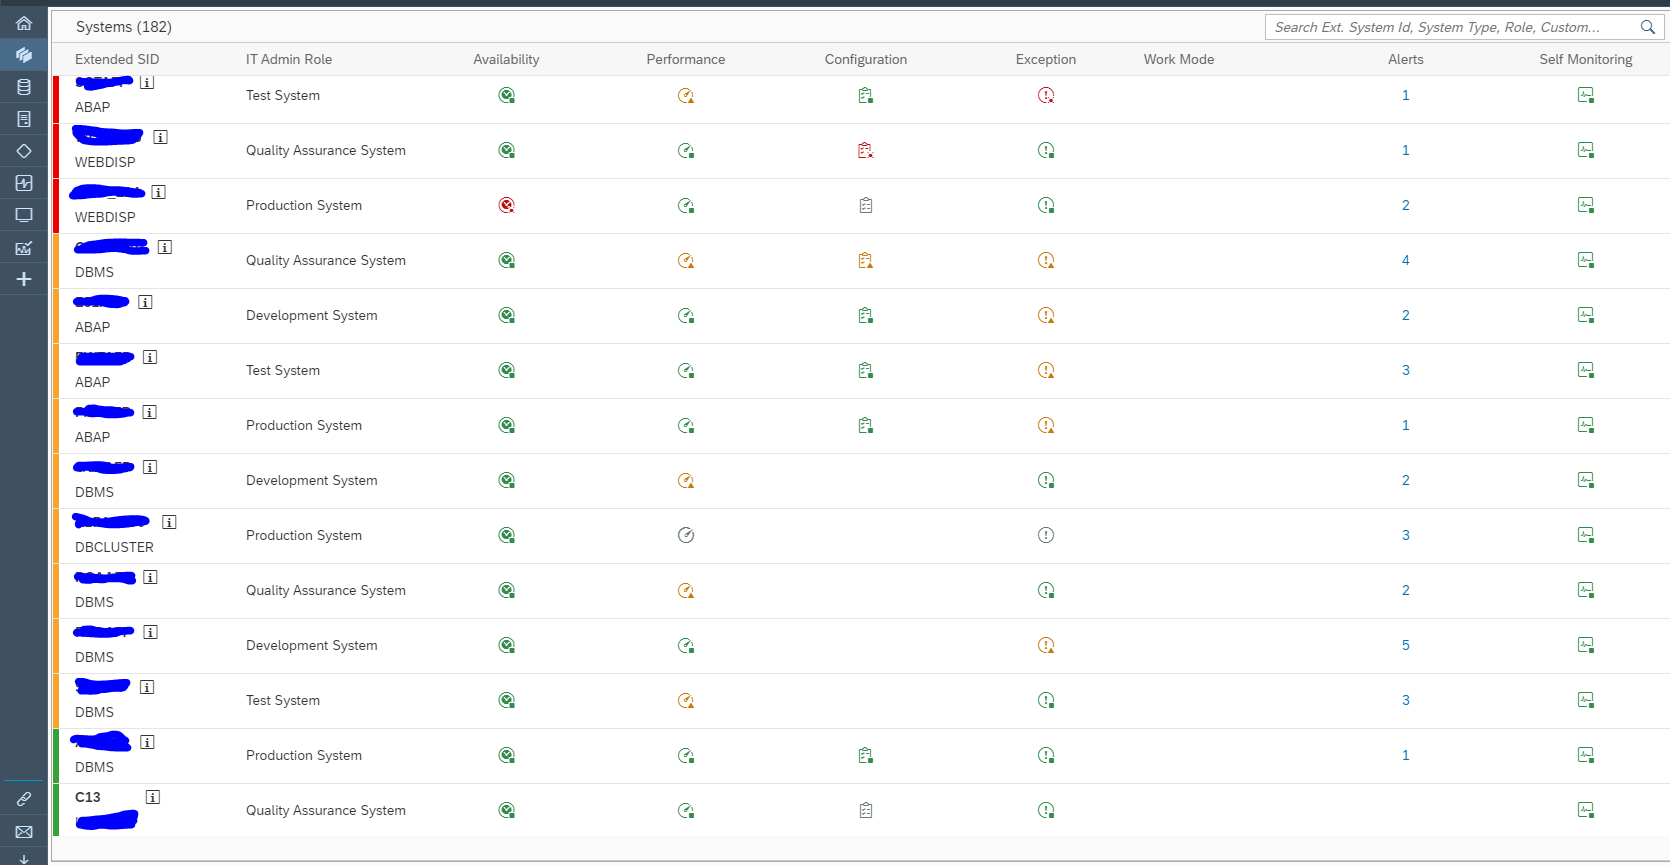
In stead of using the hierarchy view, you can also switch to the Tabular View:
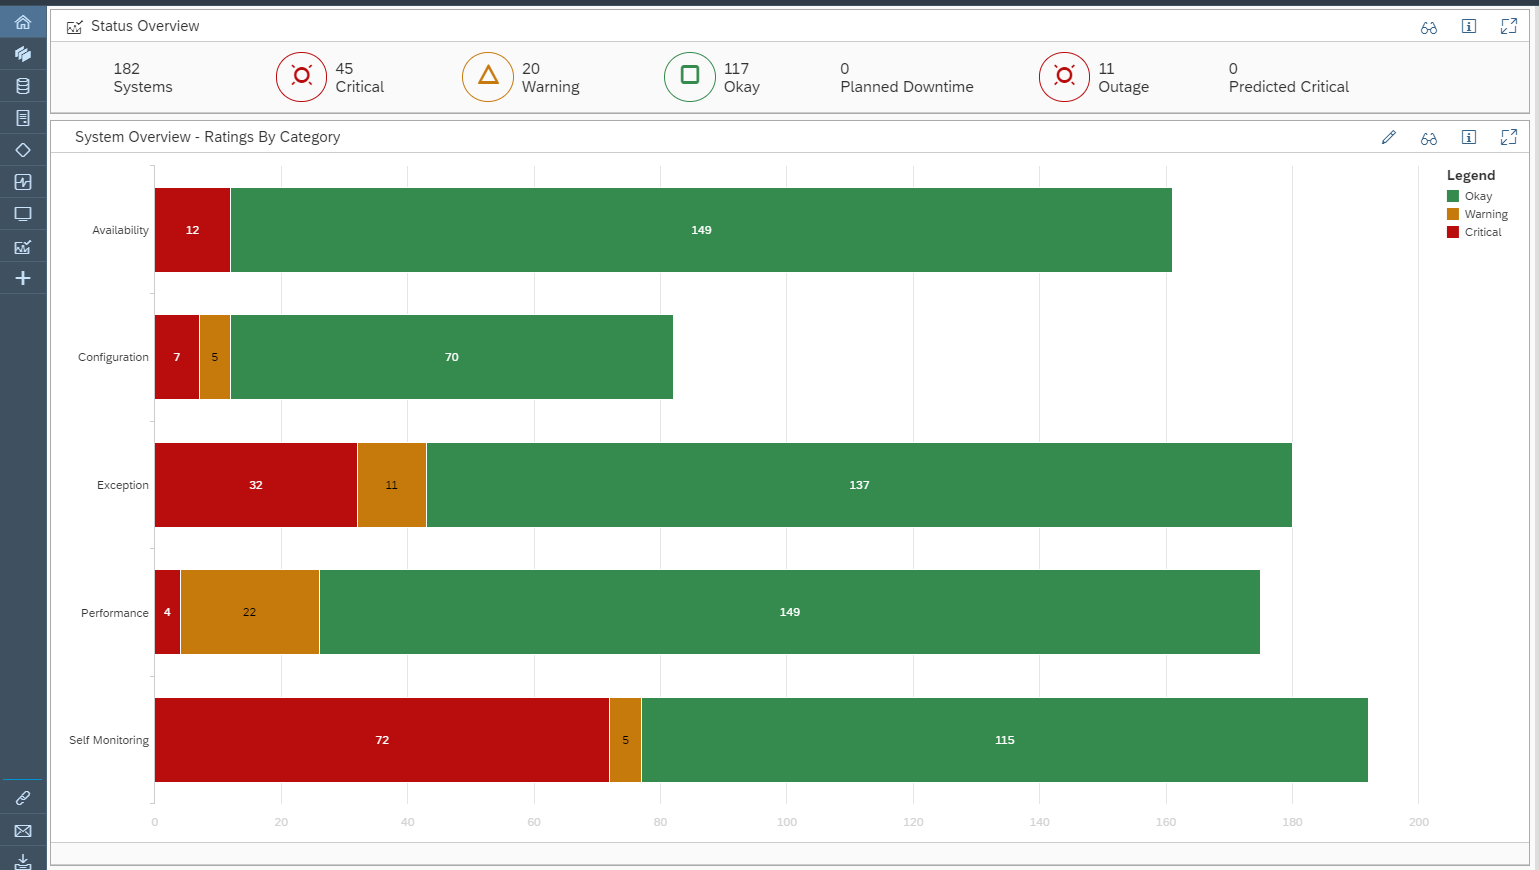
In this view you can for example sort the items on a column like the traffic light:
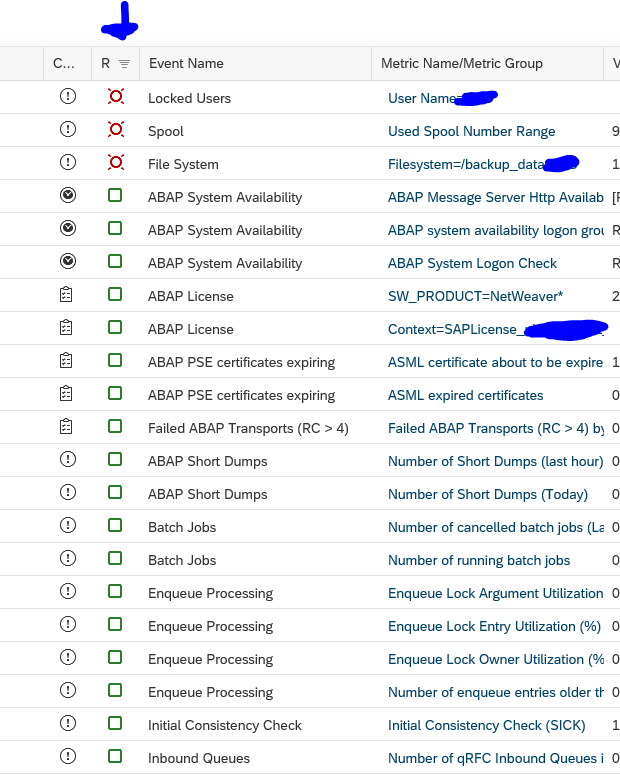
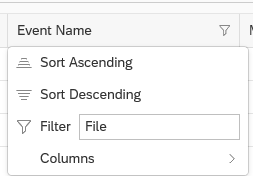
Or you can apply a text filter to search for a specific metric:
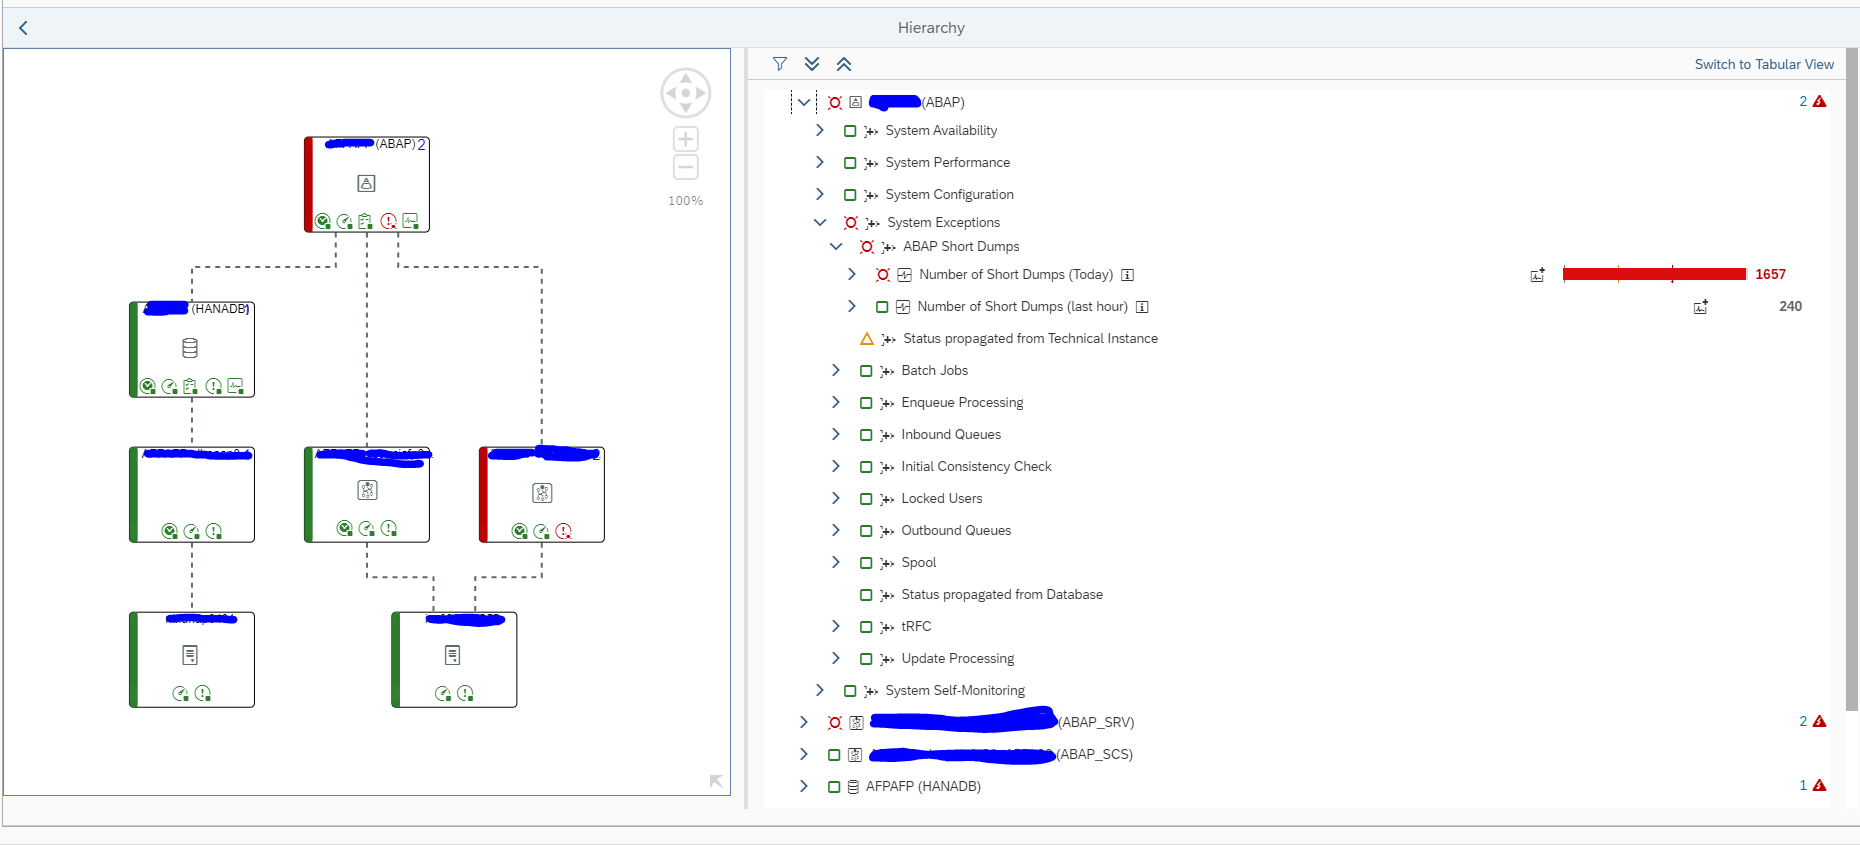
Checking a metric across multiple systems
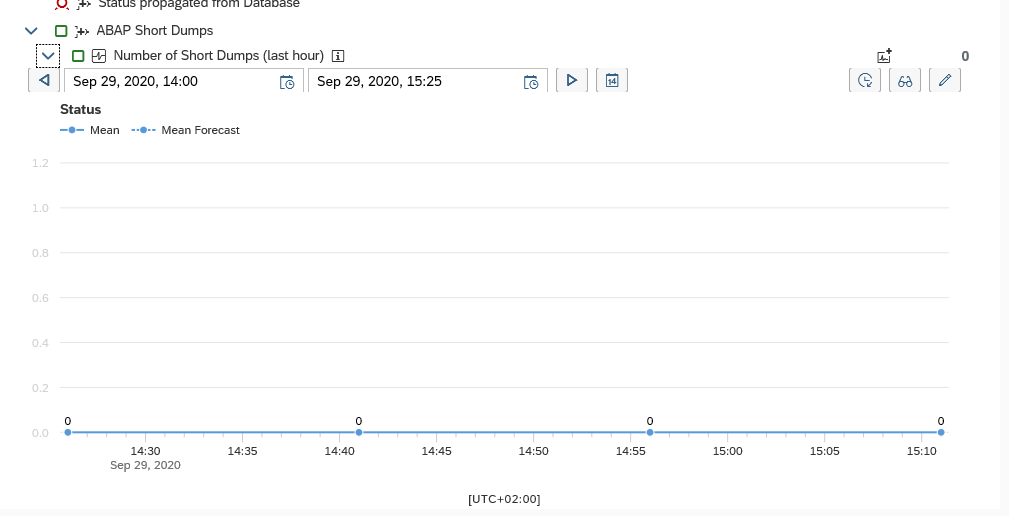
If you have an issue in one system, you might want to quickly validate if you have similar issue in different systems, or you simple want to compare with different systems. From the monitoring of a system select the metric.
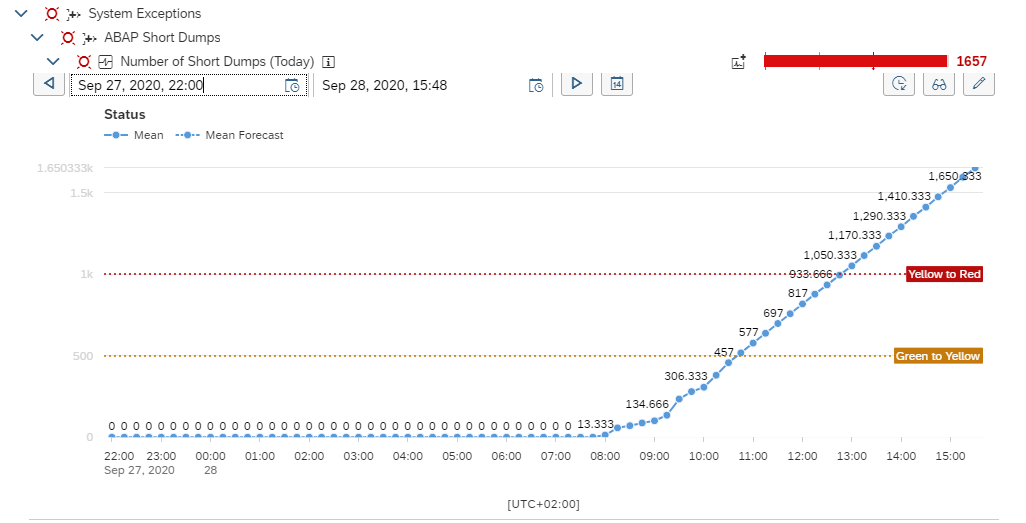
For this example we selected Short Dumps:
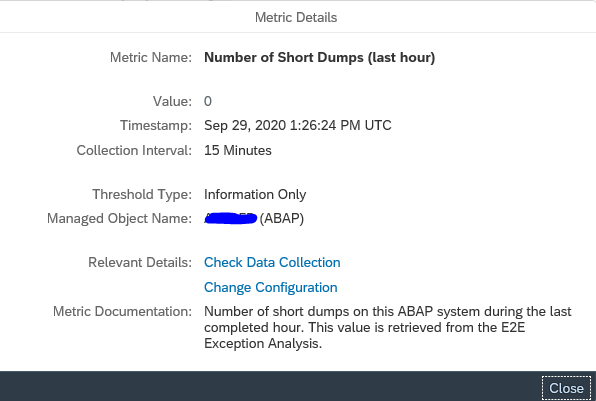
Select the i button to get the explanation text:
This gives the exact name:
Now goto the metric tool:

If you don’t see the correct metric, use the metric selection filter on the top right of the screen:
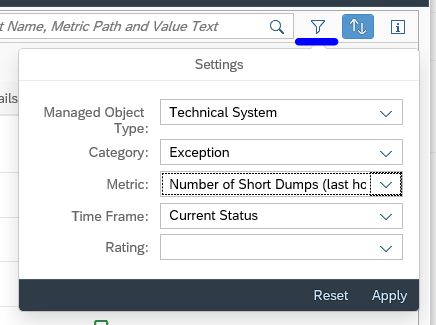
Press Apply, and you get the overview of this specific metric across all systems in your selected scope:

Storing metric data longer
Focused Run normally stores the data 28 days. If you need the data for specific metrics and systems longer, you can make use of the aggregation framework. Read the details in this blog.