This blog focuses specifically on SLT integration monitoring. Monitoring an SLT system itself is explained in this dedicated blog.
Set up SLT integration scenario
Start the integration and exception monitoring FIORI tile:
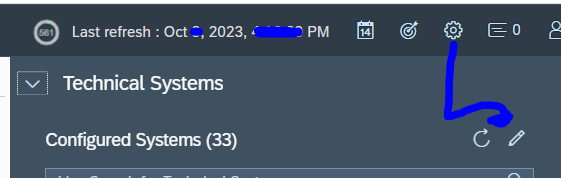
On the configuration add the SLT system:
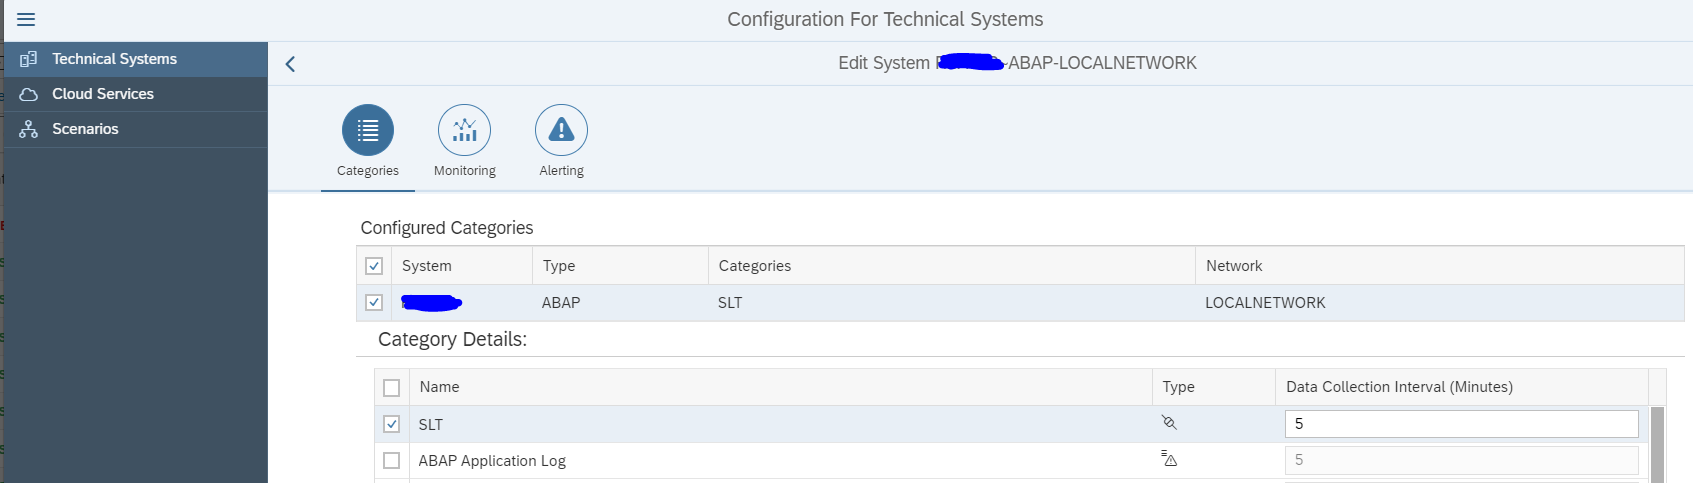
Select SLT as specific scenario:
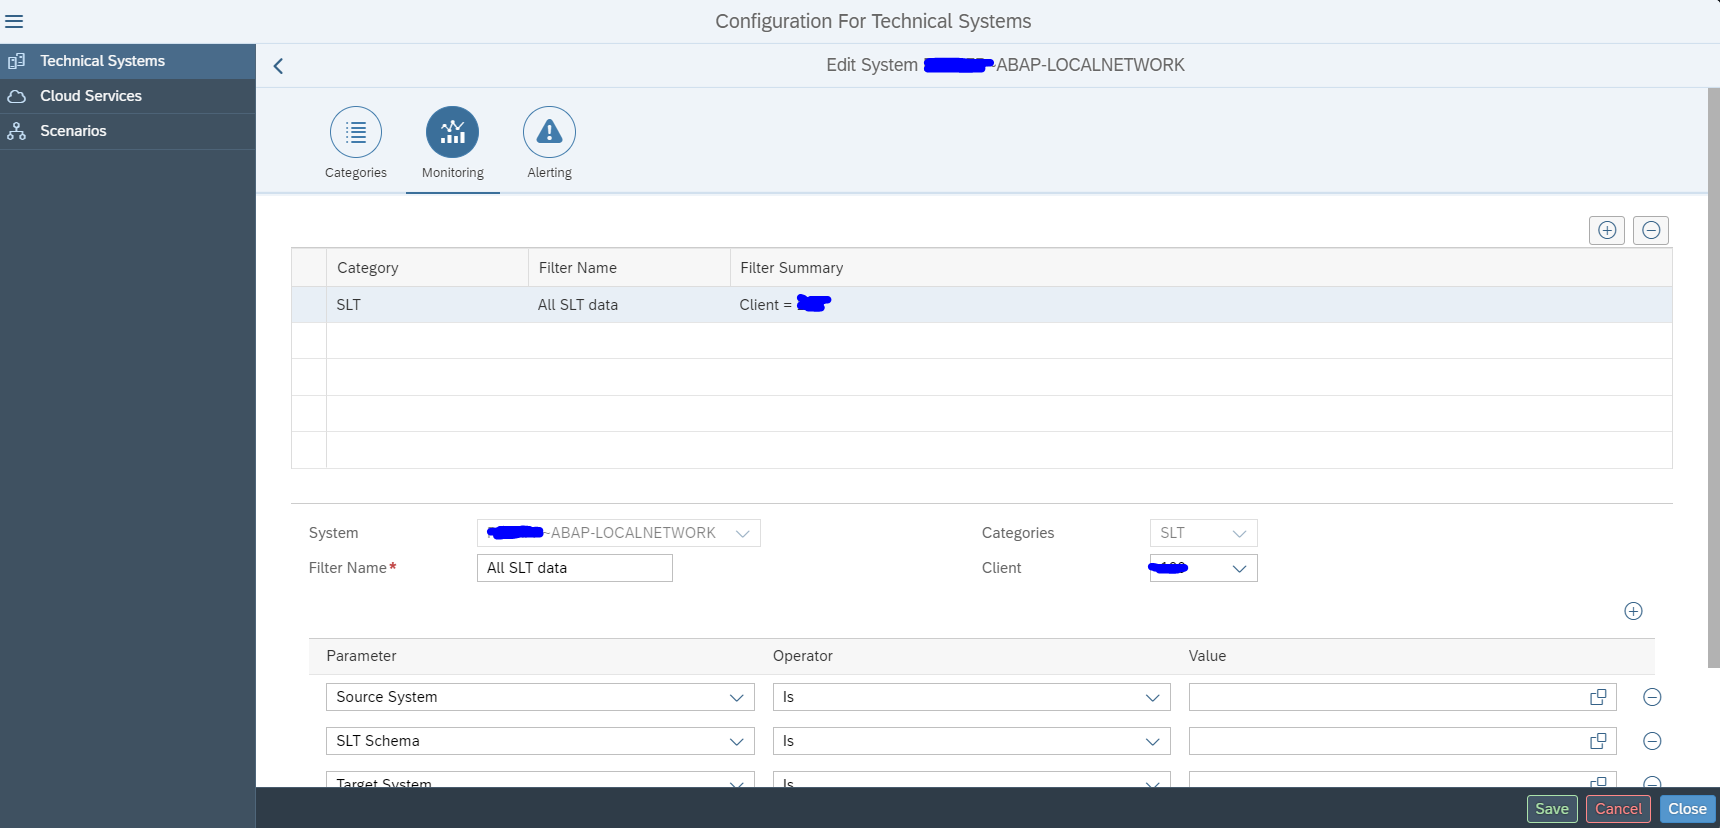
On the Monitoring part you can filter on a specific source system and/or SLT schema:
On the 3rd tab you can set the Alerting in cases of errors:
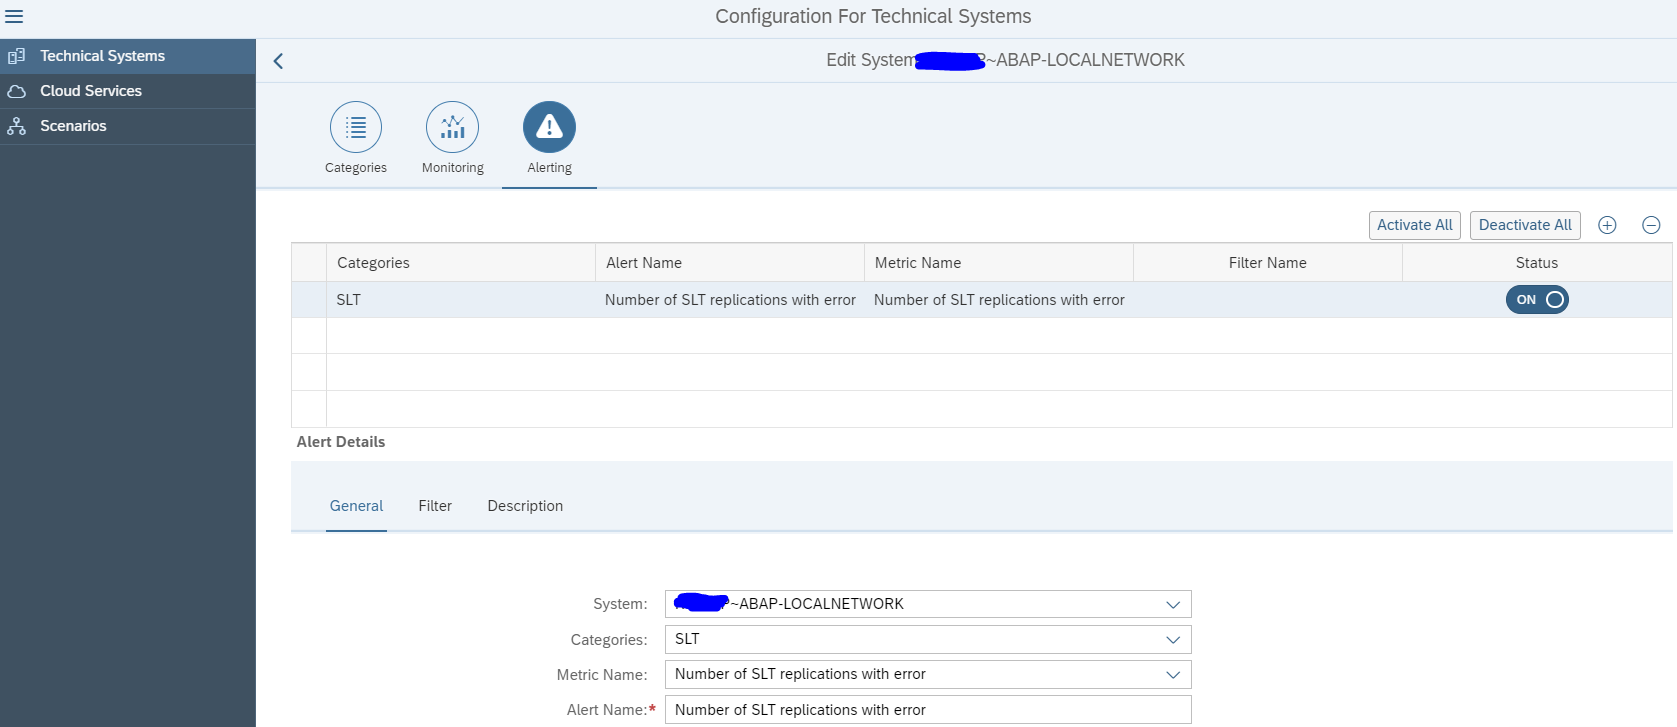
Now save and activate. The monitoring is active now.
Next step is to use this system in a model for your scenario:
Using the SLT integration monitor
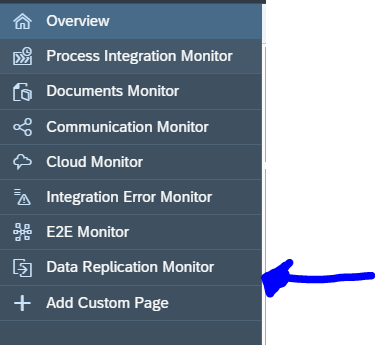
If you open the FIORI tile and you have selected your scenario, you still need to perform an extra click to go to the SLT monitor:
First you get overview of your system(s):
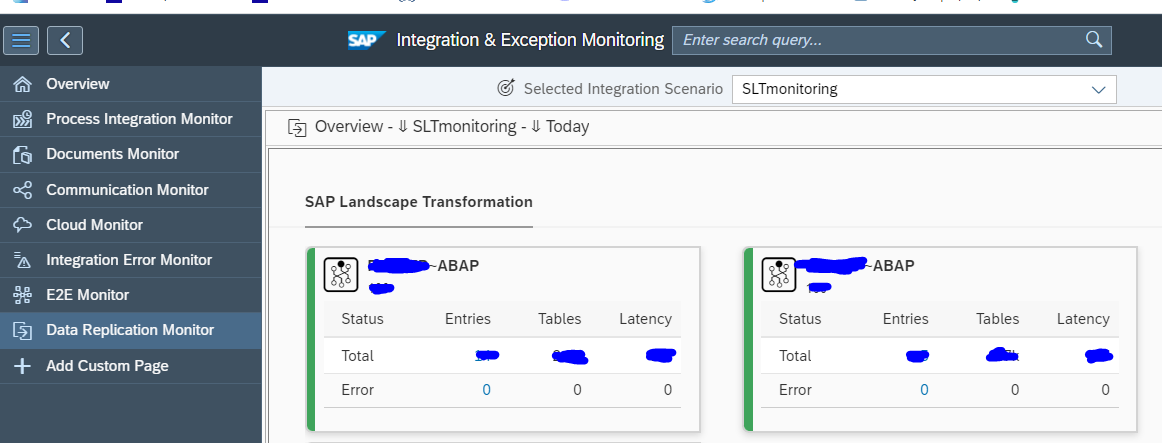
You need to click on the blue numbers to drill down:
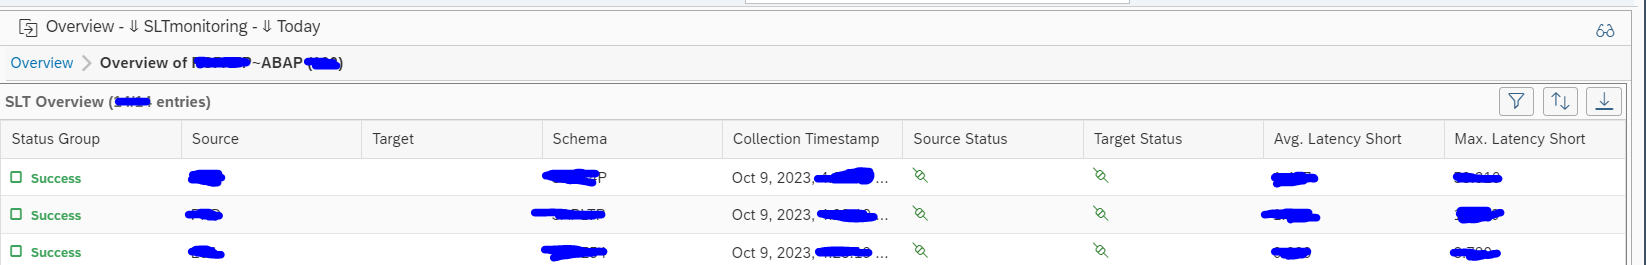
This gives overview of errors, source connection status and target connection status.
You cannot drill down further on this tile. If you see an error, you need to go to your SLT server and start transaction LTRO to see all detailed error and start fixing from there. Transaction LTRO can have errors shown that are not visible in transaction LTRC. Focused Run uses LTRO data.