Activating statistical records in Focused Run…

Focused Run has functions to fetch ST03N data from ABAP backend systems and use the data for analysis in SAP Focused Run System Analysis functions.

System analysis SSI activation

First step is to switch on the general functions for system analysis during SSI activation. Full help link from SAP can be found here.

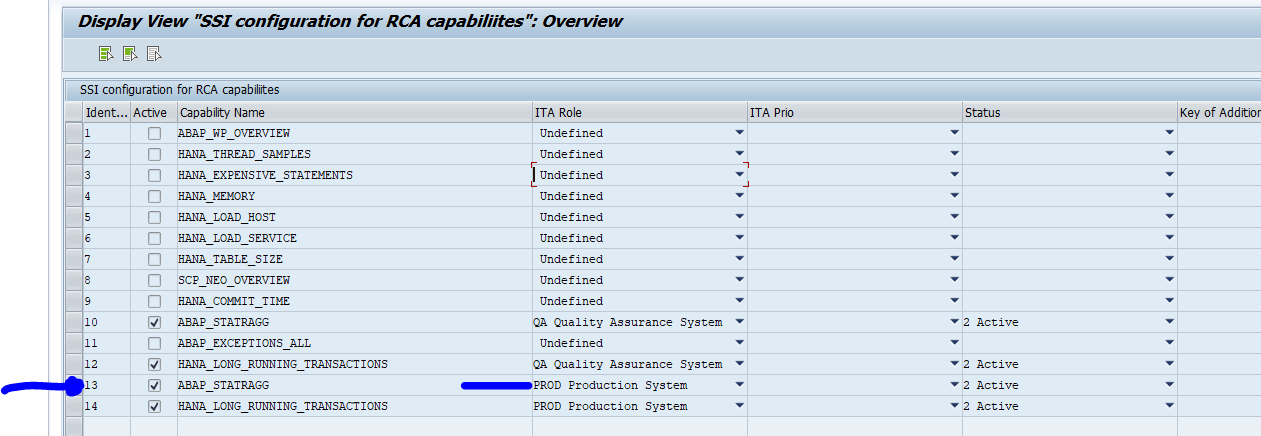
In Focused Run start SM30 for table RCA_SSI_CONF and add entry for activation:

Repeat SSI

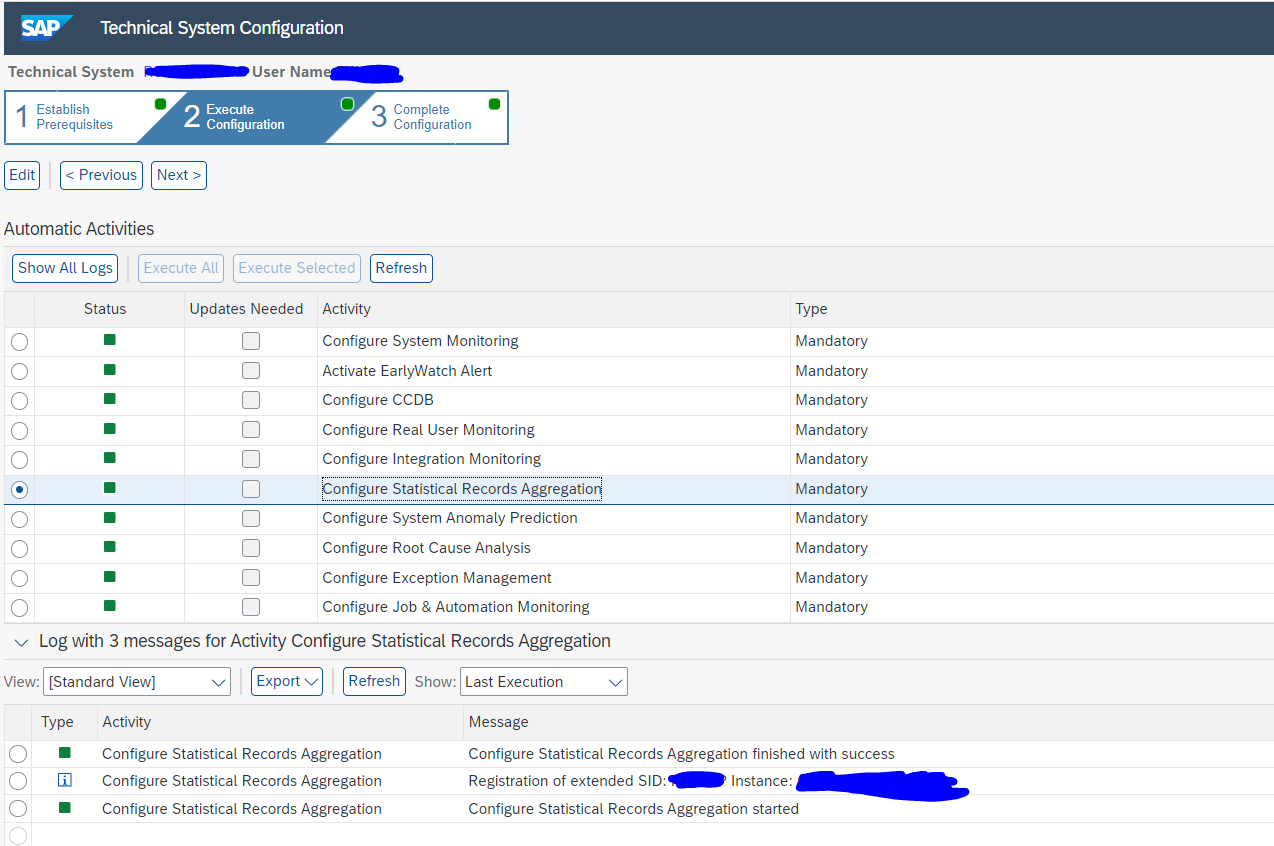
For the system that you want to have ST03N data collected, you need to repeat the SSI.

Check the detailed step in the SSI for the Statistical records aggregation:

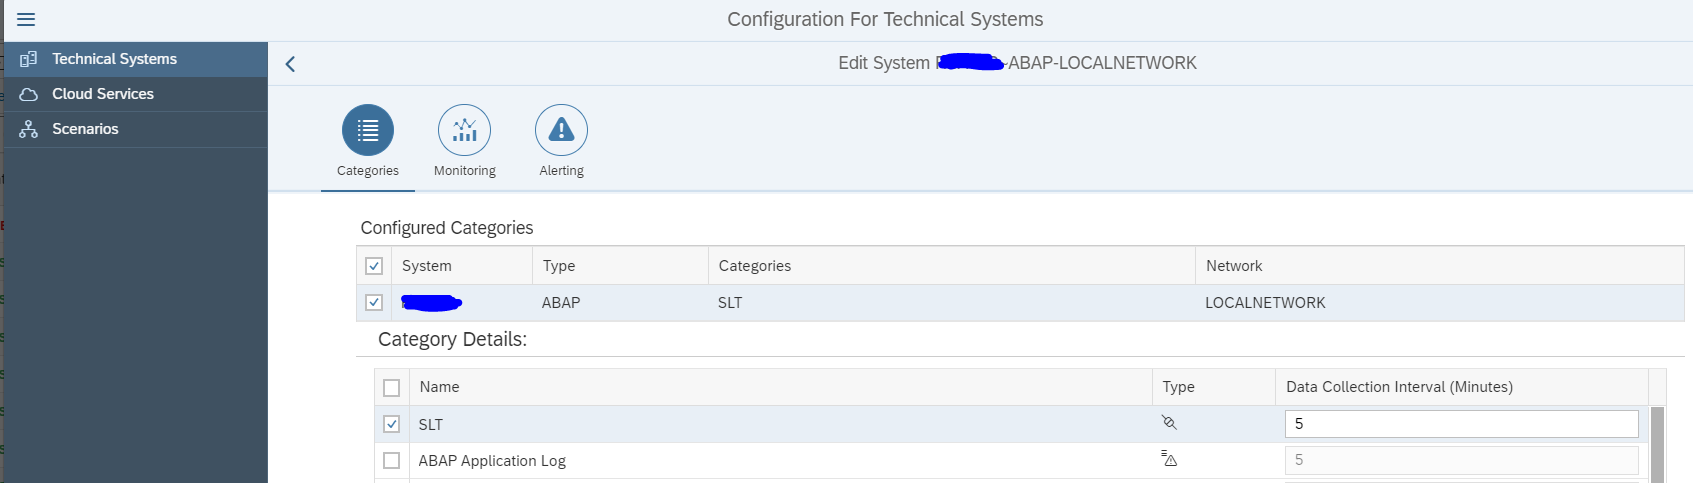
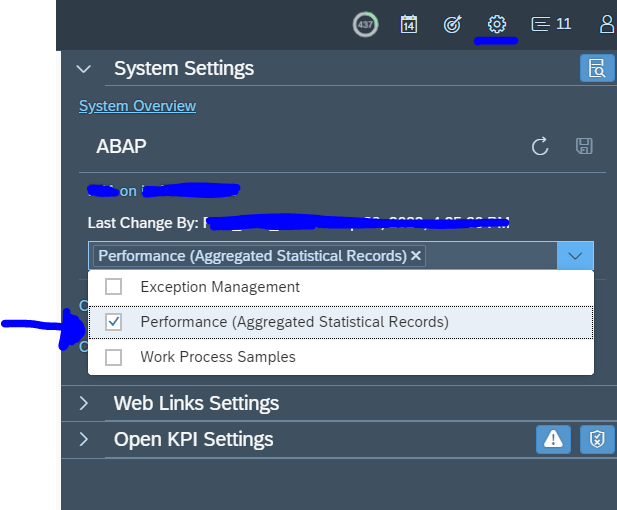
Activate per system in System Analysis

Next step is to activate it per system in System Analysis:

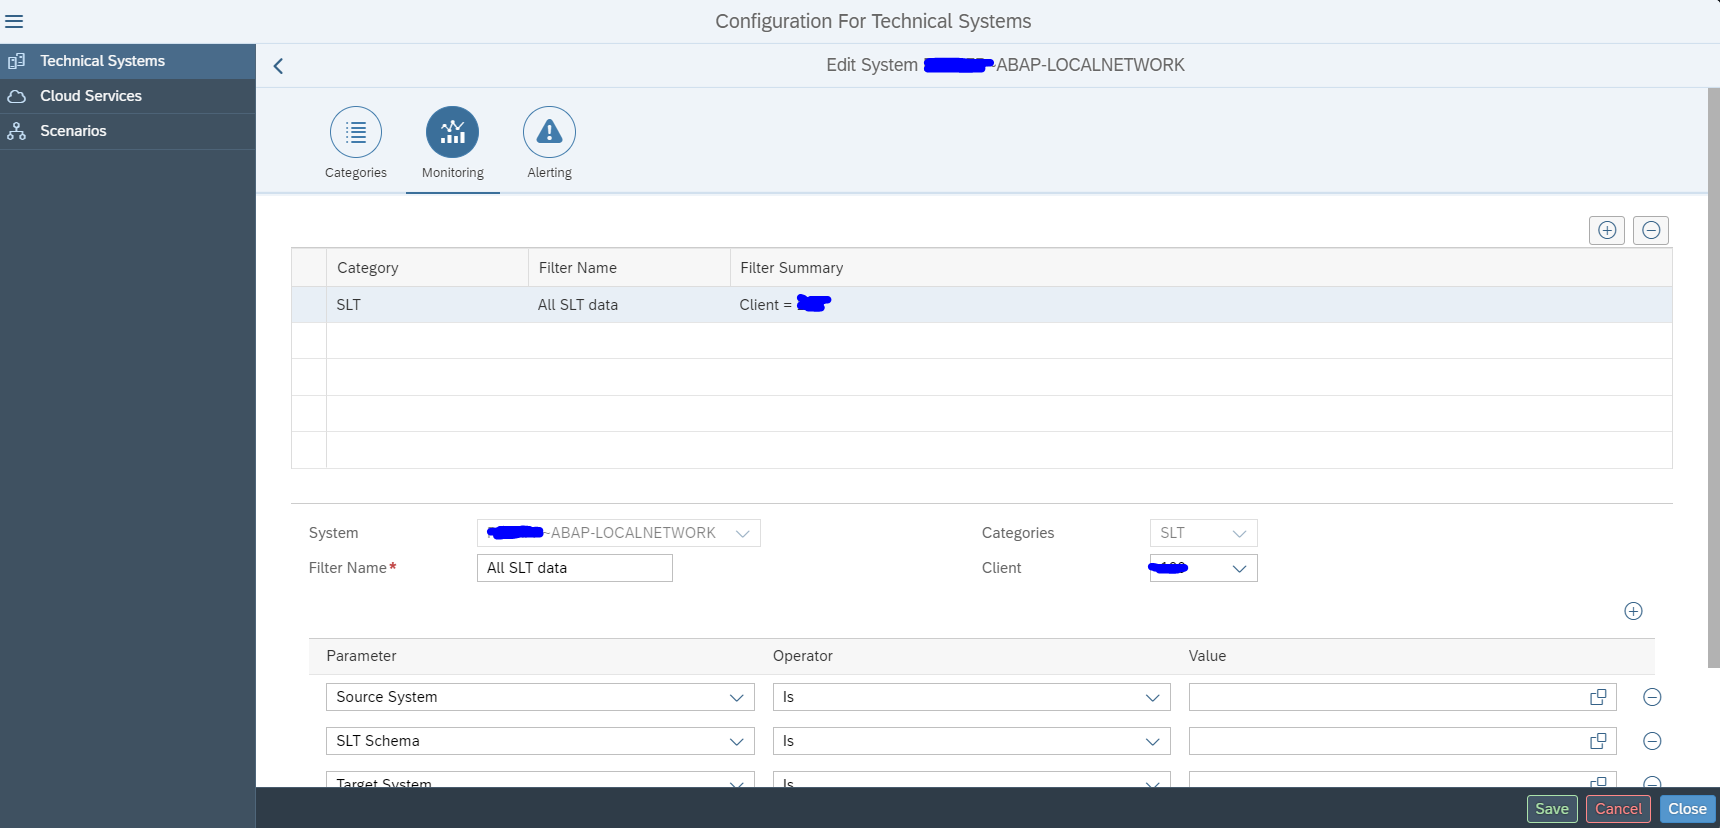
Go to the settings per system and make sure Performance (aggregated statistical records) is activated:

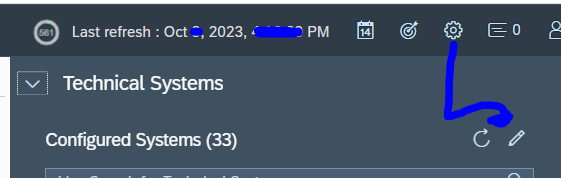
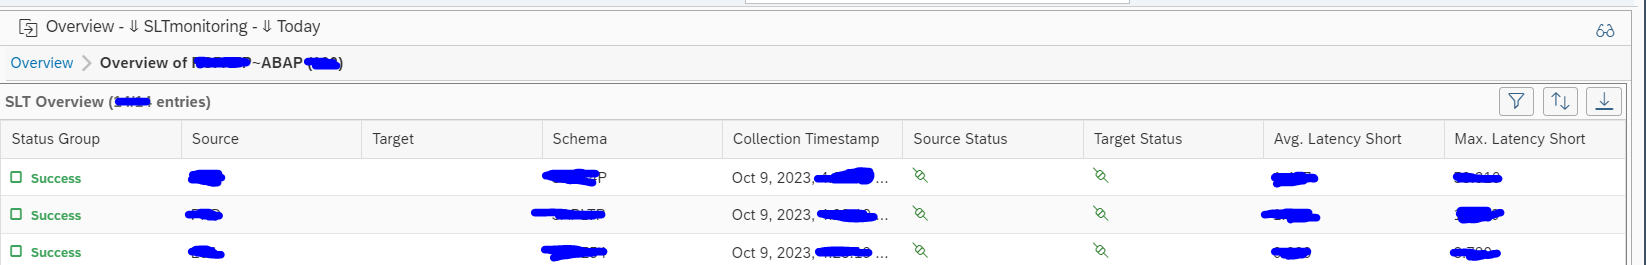
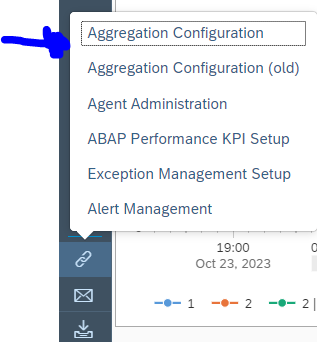
Overview of all systems

In System Analysis, go to the bottom left tool section to open the Aggregation Configuration tool:

The overview page opens:

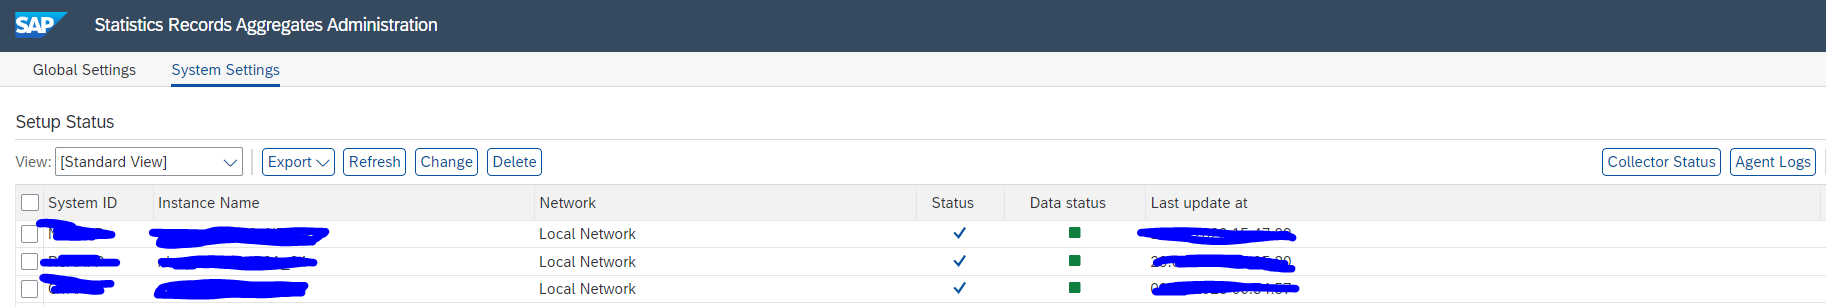
Now you can see both configuration and data collection is ok.

SLT integration monitoring…

This blog focuses specifically on SLT integration monitoring. Monitoring an SLT system itself is explained in this dedicated blog.

Set up SLT integration scenario

Start the integration and exception monitoring FIORI tile:

On the configuration add the SLT system:

Select SLT as specific scenario:

On the Monitoring part you can filter on a specific source system and/or SLT schema:

On the 3rd tab you can set the Alerting in cases of errors:

Now save and activate. The monitoring is active now.

Next step is to use this system in a model for your scenario:

Using the SLT integration monitor

If you open the FIORI tile and you have selected your scenario, you still need to perform an extra click to go to the SLT monitor:

First you get overview of your system(s):

You need to click on the blue numbers to drill down:

This gives overview of errors, source connection status and target connection status.

You cannot drill down further on this tile. If you see an error, you need to go to your SLT server and start transaction LTRO to see all detailed error and start fixing from there. Transaction LTRO can have errors shown that are not visible in transaction LTRC. Focused Run uses LTRO data.

Monitoring web dispatchers…

This blog will focus on monitoring of standalone web dispatchers. Standalone web dispatchers are used to load balance web traffic towards ABAP and/or JAVA systems. Common use case is to have web dispatcher for a large Netweaver Gateway FIORI installation.

Monitoring productive cloud web dispatchers

Monitoring of web dispatchers focuses on availability and connectivity/performance.

The web dispatcher template contains most needed elements out of the box:

Issues with performance are often caused by limitations set in the web dispatcher configuration. Keep these settings active.

You might want to add specific custom metric to monitor the most important URL for your web dispatcher. Read more in this specific blog.

Next to this setup the normal host monitoring to make sure the file system and CPU of the web dispatcher are not filling up and causing availability issues for the web dispatcher function.

Monitoring non-productive web dispatcher systems

For monitoring non-productive web dispatcher systems, it is normally sufficient to restrict to host and availability monitoring.

Bug fix OSS notes

3373764 – Issue with Content Server on Web dispatcher templates