In case of data collection issues you will need to troubleshoot Simple Diagnostic agent logs .
In some cases you might need to get further details after you see an error message in the standard SDA logs in Agent Internals. In such cases you will need to enable application specific logging. E.g. activate debug logging in order to analyze issues with a specific application or component of the SDA
For E.g.: You saw an error in agent internals like
2019-08-15 15:48:01,696 ERROR [MAI FRD 5] com.sap.solman.agent.mai.http.WebDispGetServerListCollector
com.sap.solman.agent.mai.cim.EvaluationException: division by zero
at com.sap.solman.agent.mai.cim.ExpressionEvaluator.evaluate(ExpressionEvaluator.java:72)
In this case, you will want to put to debug this class: com.sap.solman.agent.mai
Following Application components of SDA for which logging can be enabled.
| Application / Component | Name (Column in Log Configuration Dialog) |
| JCo | com.sap.solman.agent.conn.jco |
| MAI | com.sap.solman.agent.mai |
| SDA Core | com.sap.solman.agent.core |
| SSL | com.sap.solman.agent.core |
| SLDR | com.sap.solman.agent.sldr |
To enable logging you can follow the following steps.
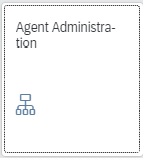
Step 1 : Open Agent Administration in Focused Run Launchpad.
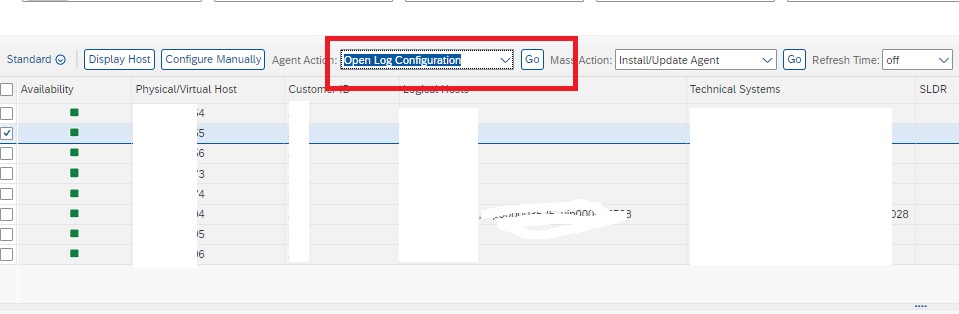
Step 2: Select the agent/host for which you want to enable logs in Debug, on the option Agent Action select “Open Log Configuration” and click on Go.
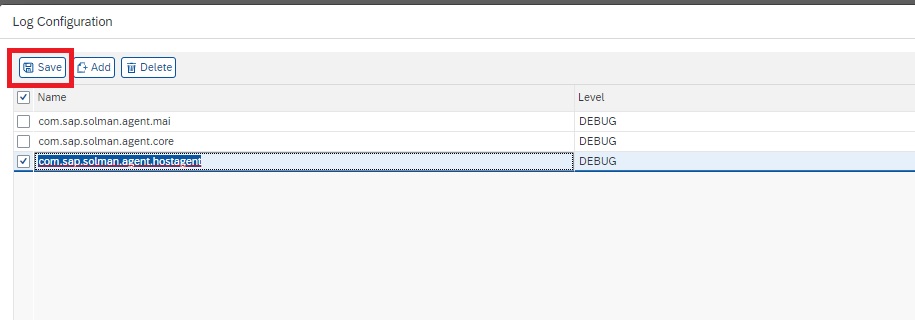
In the next dialog screen enter the application classes for which you want to enable debug as shown below. After entering the classes click on Save.
In the next execution, the Agent logs will present more details.
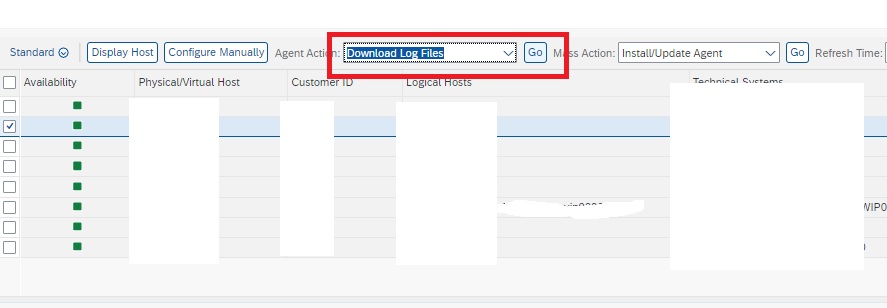
You can collect the log files by selecting the Option Download Log File and then click on Go. It will download all SDA logs in a zip file to your desktop/laptop.
Note: Do not forget to remove the log configurations after downloading the logfiles.
Reference SAP Note 2696231 – How to set the Simple Diagnostic Agent to debug.