The generic interface monitoring setup in SAP Focused Run is explained in this blog. This blog will zoom into monitoring of ODATA gateway connections.
We assume in this use case that end users are using the ODATA in FIORI apps. In case ODATA is consumed by external applications like Tibco, Mulesoft, Mendix, etc., you have to replace USER with the corresponding application.
Model end users in LMDB
Before we can start the scenario modelling, we first need to model the end users in LMDB as a Unspecific Standalone Application System), just like we did for TIBCO in this blog.
Name the ‘system’ USER:
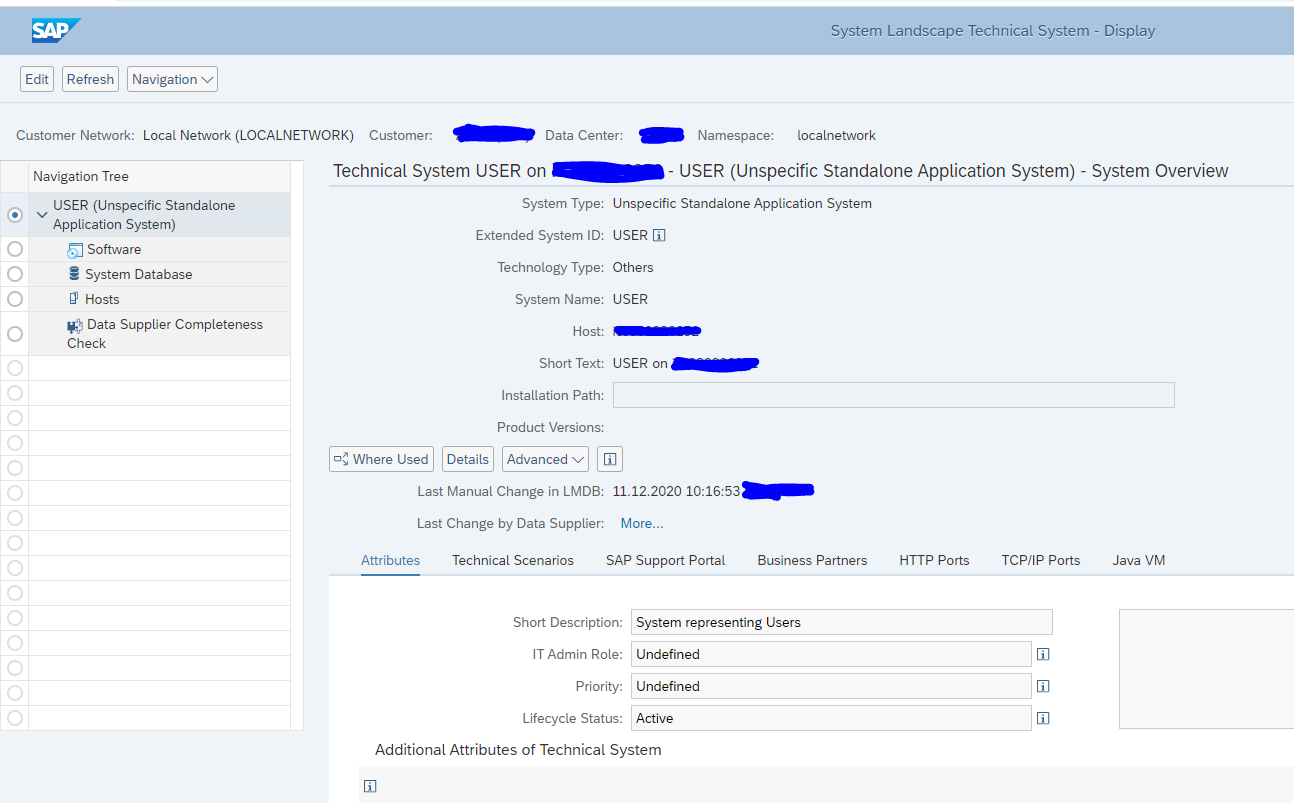
Make sure the status is Active.
Add this new system USER to the Technical System list in the Integration Monitoring setup.
The system will be display only.
Data collection and alerting setup
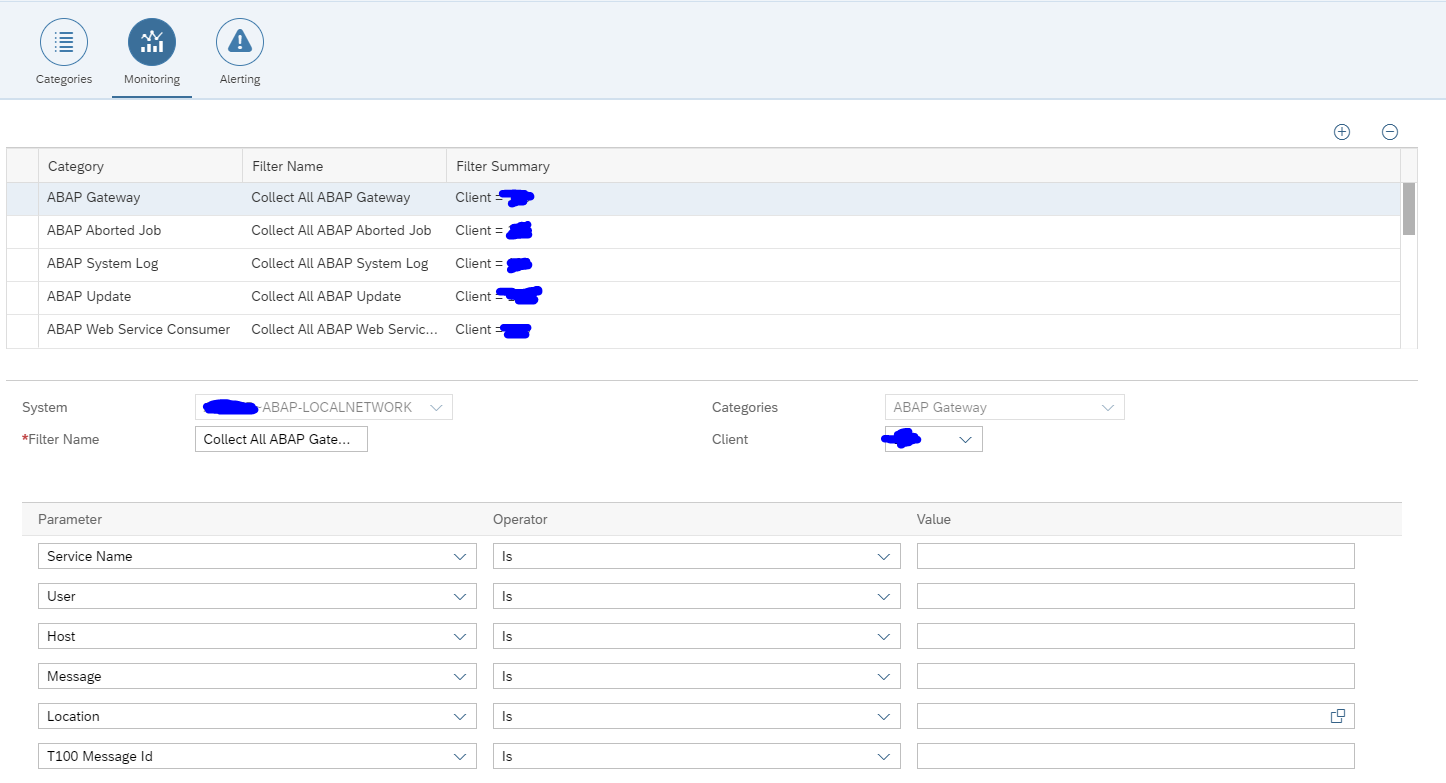
In the configuration for interface monitoring in the Technical System settings, goto the monitoring part and activate the data collection for Gateway Errors:

In the monitoring settings, you can filter on specific items if wanted, or leave everything blank to report on any error:
In the tab alerting setup the alerting:
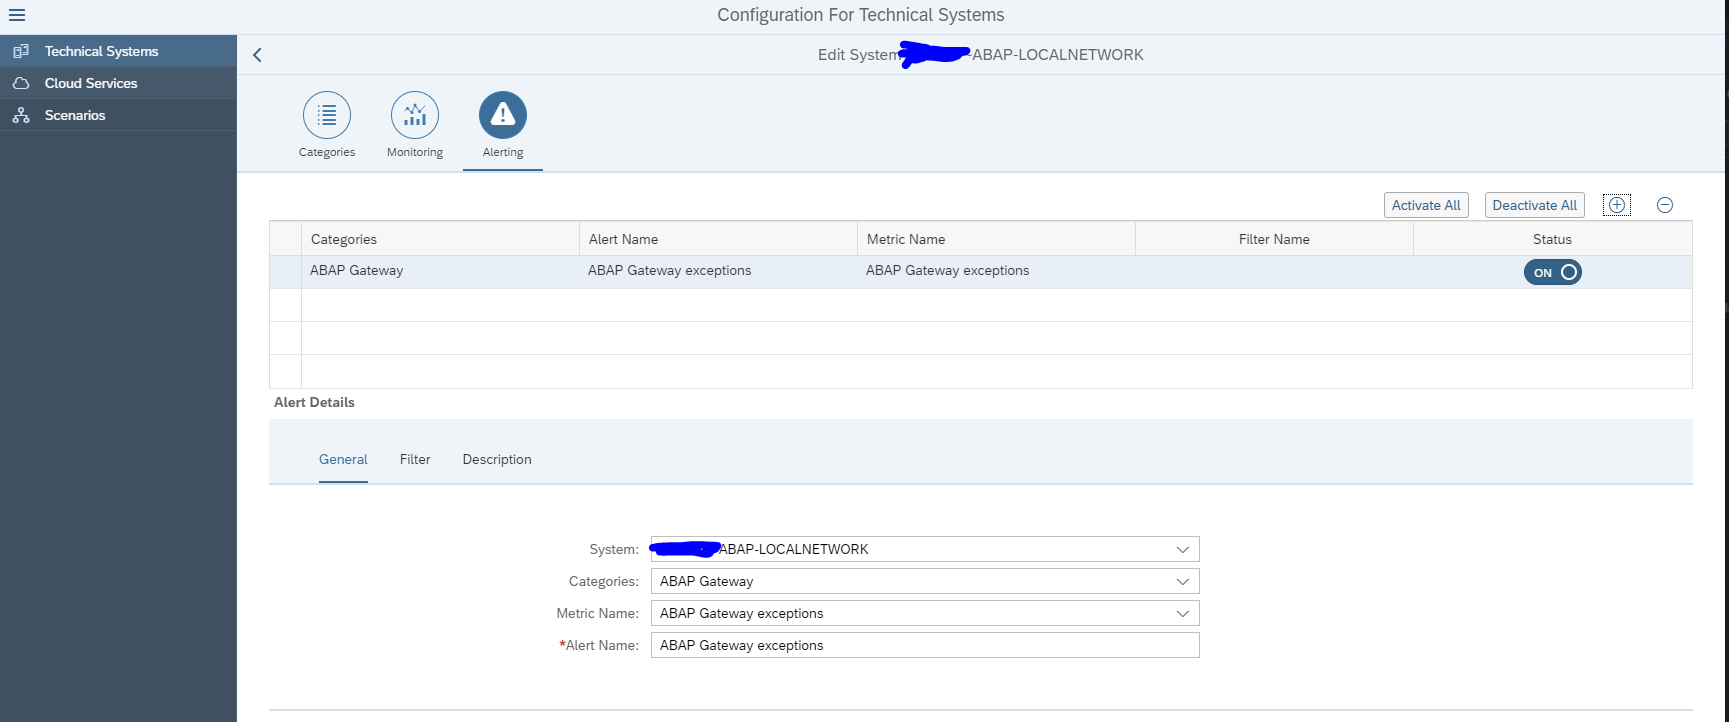
The filter for monitoring and alerting can be different. It cloud be you want to monitor all errors, but only activate specific important ones.
Save your monitoring data collection and alerting settings.
Graphical modelling
In the graphical modelling add the backend system and the system created for USER:
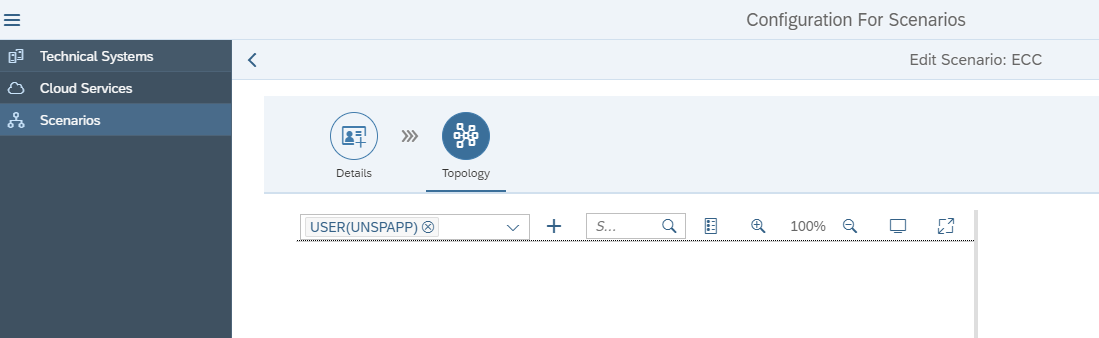
Now add the link starting with USER towards the backend system:

Save your changes.
Also here: first scroll down to see the OK button. Press first OK before pressing Save, or you might loose the data and have to re-enter it. This it bit annoying in the UI.
Monitoring usage
The end result in operations looks as follows:
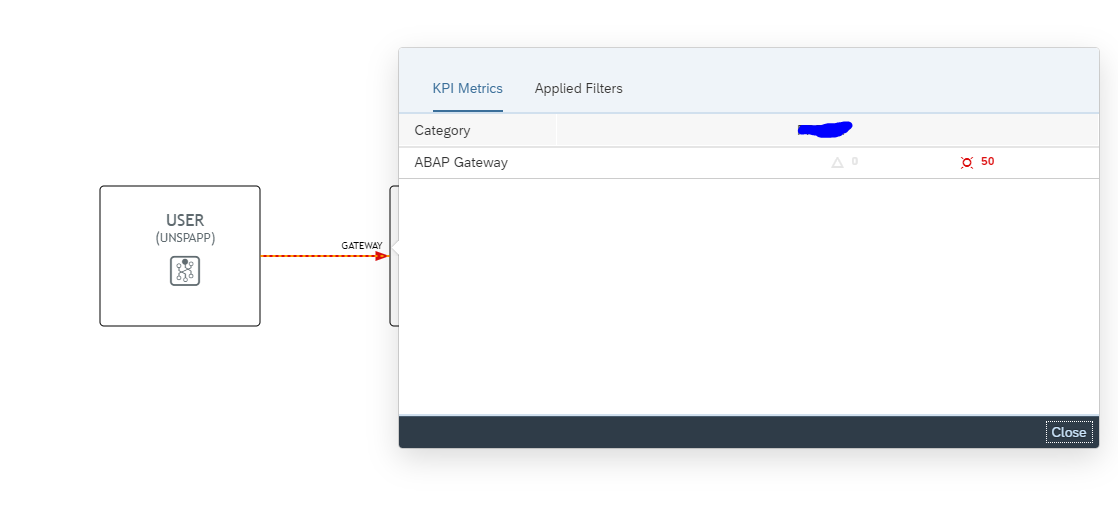
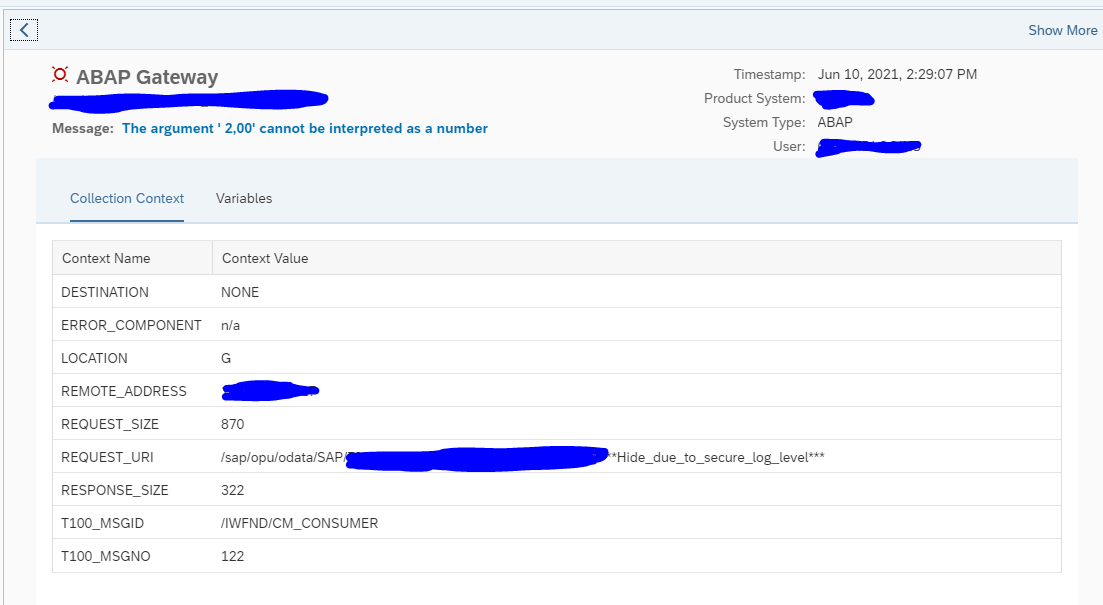
In the graphical overview click on the red line. The screen with the exceptions opens. Click on the red number to see the overview:
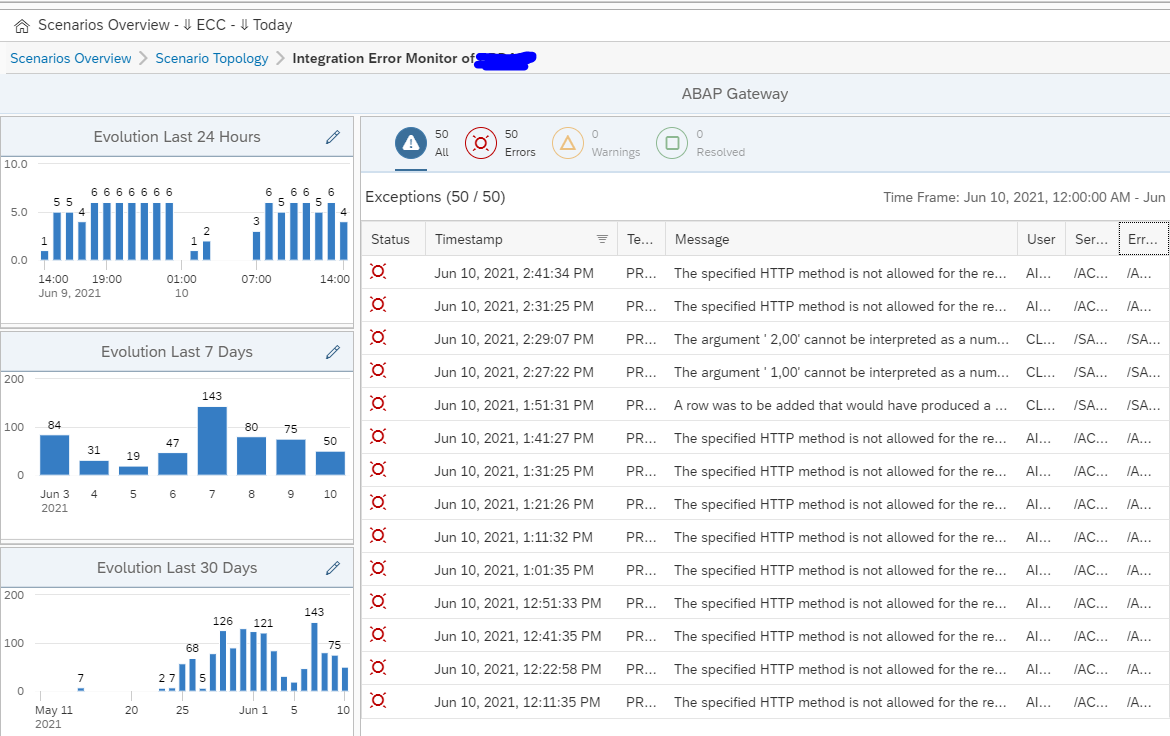
Here you can see the trends and zoom into the specific errors: