The technical configuration of the interface monitoring setup is explained in this blog. We will also explain how to model non-SAP systems that are interfaced to and from.
With Focused Run 3.0 a new dashboarding framework available called Operation Dashboard. This enhancement comes under the Advanced Analytics & Intelligence (AAI) functionality of Focused Run.
With Operation Dashboard you can configure a 3 level drilldown dashboard to track the current situation of monitoring and alerting in the areas of System Monitoring and Real User Monitoring.
Currently you can track metrics and alerts only from areas of System Monitoring and Real User Monitoring.
Views in Operations Dashboard
Operation Dashboard provides 3 types of view to provide a consolidated view of the current status of monitoring and alerting.
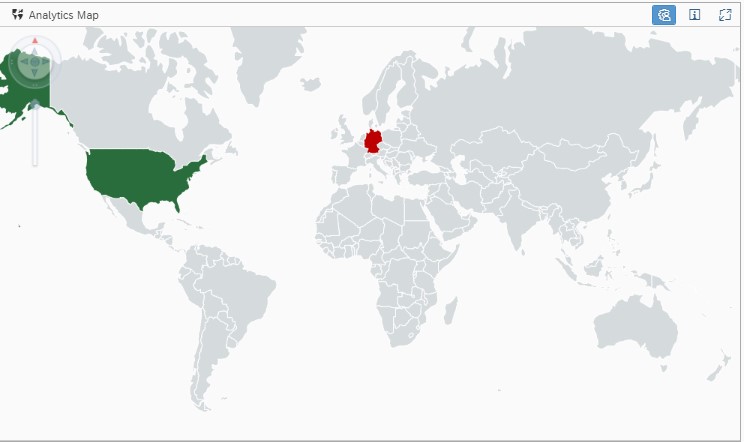
Analytics Map: Consolidate monitors to a specific region on the world map. The region is colour coded to the aggregated monitoring status of the monitors included. Aggregation uses worst case rule i.e The colour of the region is green only if all the involved monitors are in green.
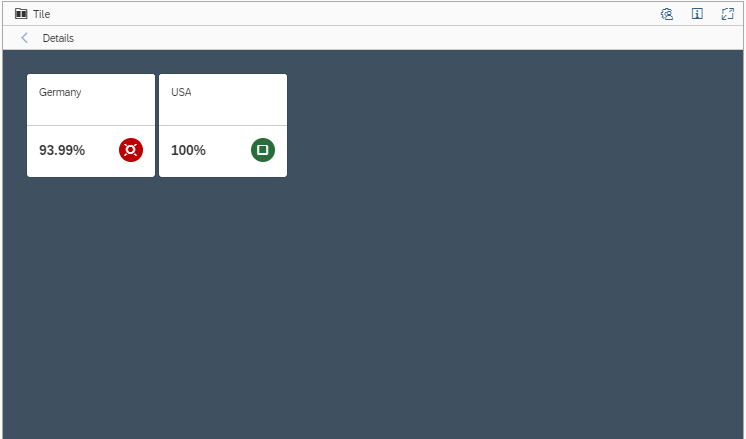
2. Tile View: Shows the consolidated monitoring status of a specific Scenario/System/Managed Object. Aggregation uses worst case rule.
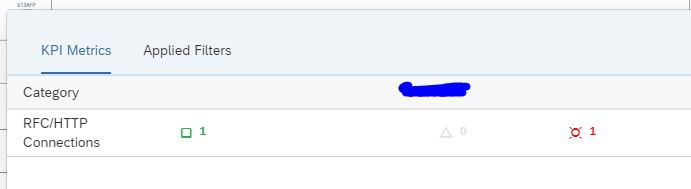
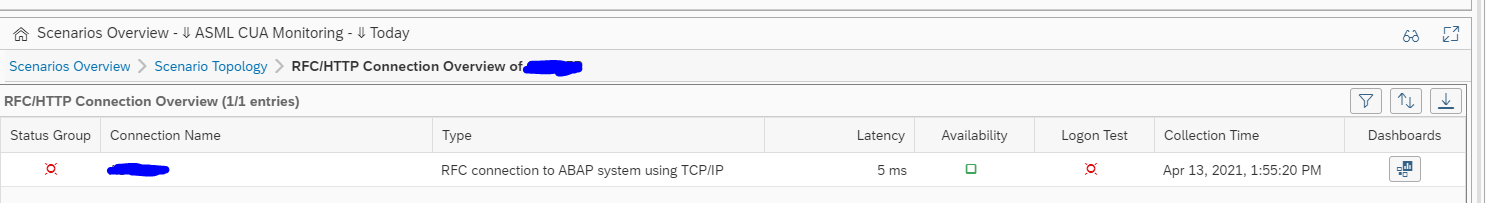
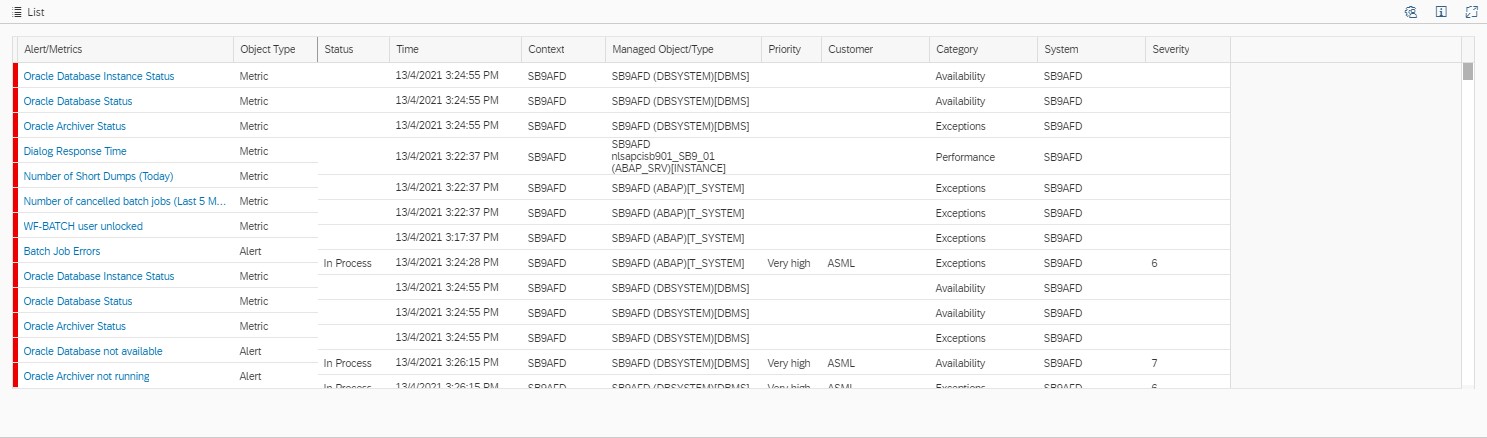
3. List Deatils View: Shows the list of involved monitors.
The above three views are linked automatically to eachother to enable the drill down functionality. That is, if you click on a perticular region which is rated in the world map view, you will get the correspoding systems/componenets for that region in the tiles view and the corresponding monitoring metrics in the list view.
Operation Dashboard Setup
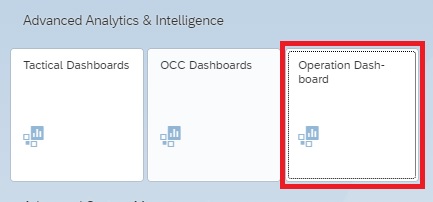
To access Operations Dashboards click on Operations Dasboard tile under Advanced Analytics & Intelligence section in the Focused Run Launchpad.
Step 1: Create a new Operation Dashboard
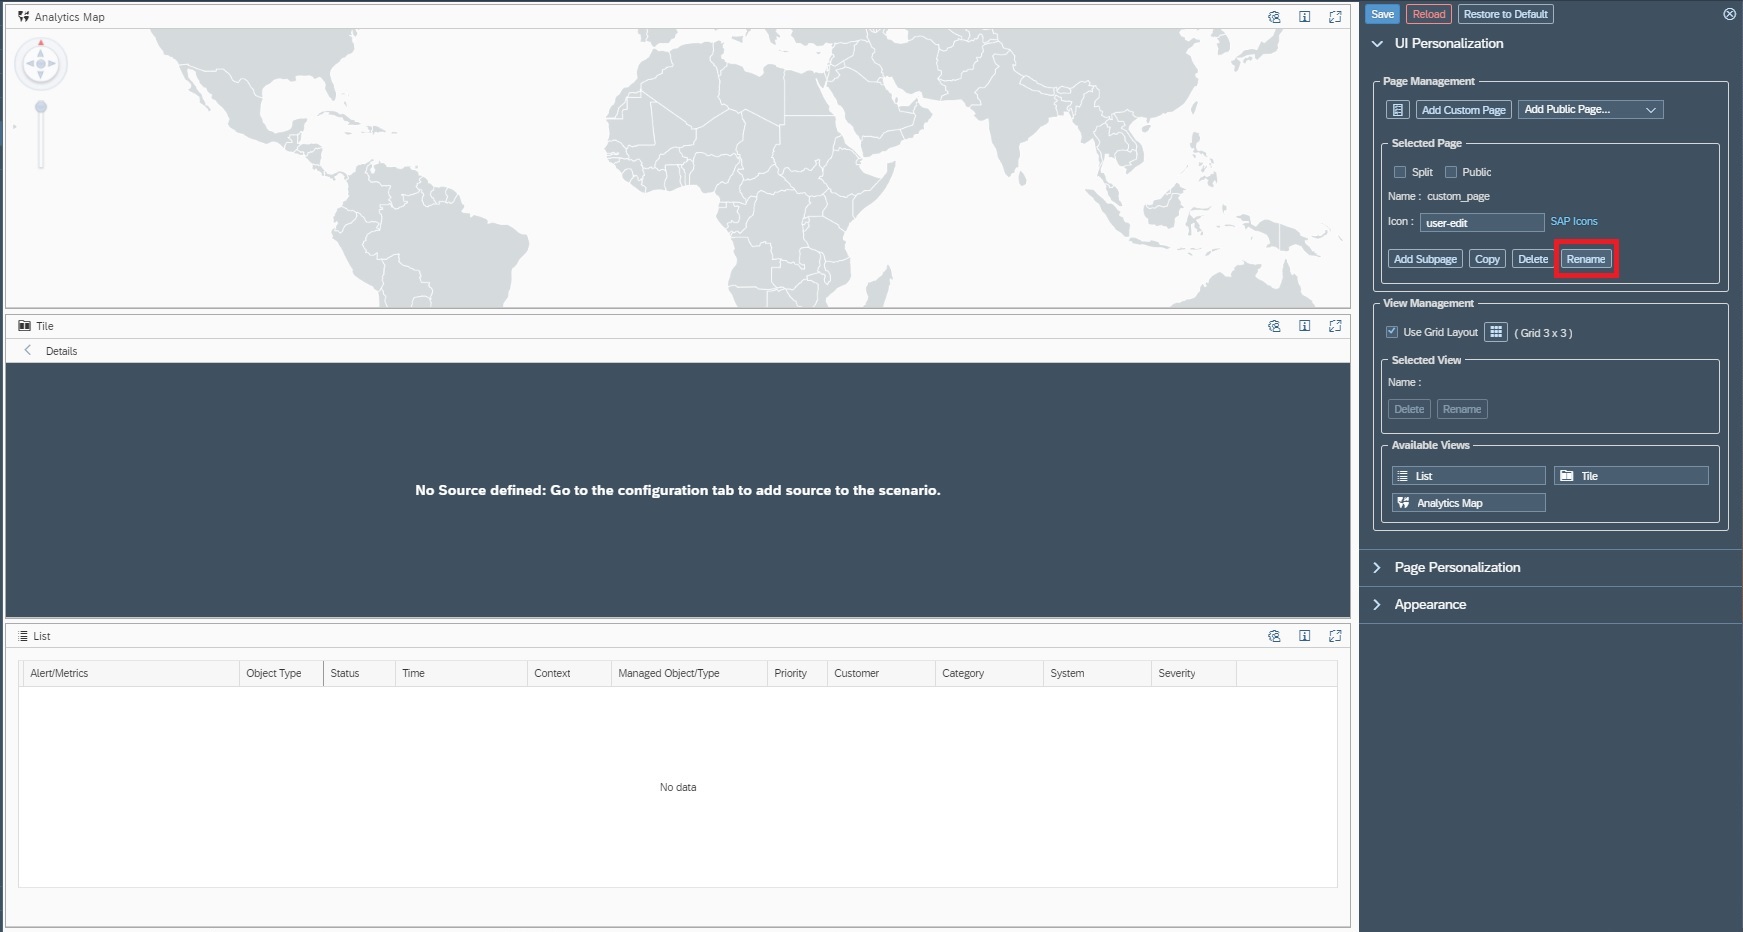
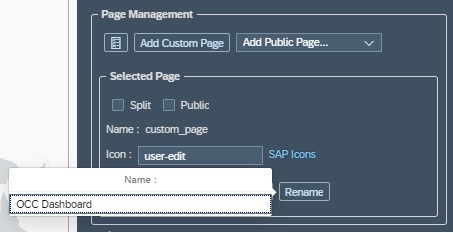
Create a new Operations Dashboard by clicking on Add Custom Page in the navigation pannel of Operations Dashboard app.
Step 2: Name your dashboard
When you create a new dashboard, the dashboard setup are will appear on the right hand side of your screen. Click on the rename button as shown below.
Step3: Configure layout
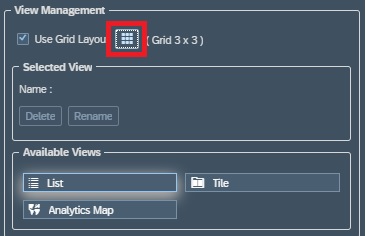
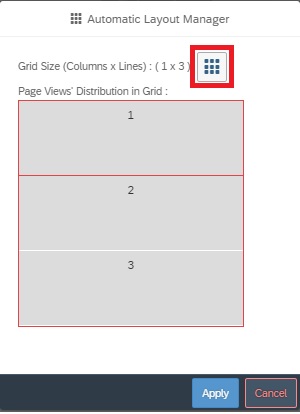
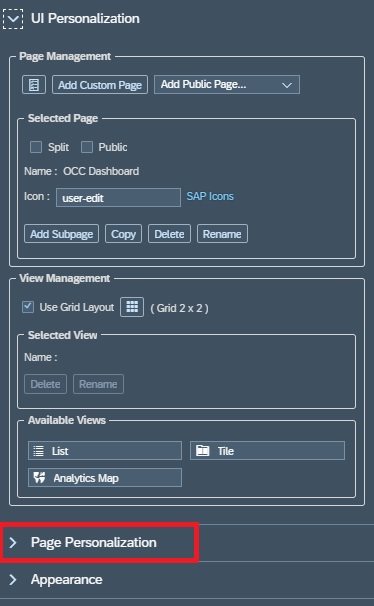
You can configure the layout of your dashboard in a Grid format. Each grid in the layout will hold a view of your dashboard. As we have 3 types of views you can form a layout of 3 grids. To configure the grid layout click on the Grid button in the setup area – View Management section
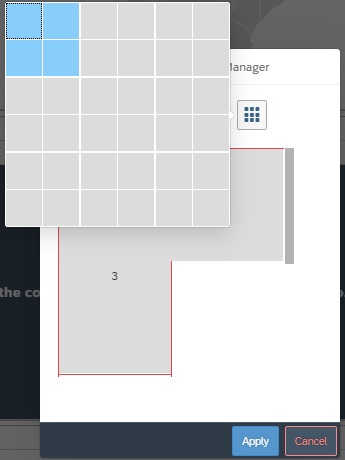
In the pop-up you can drag and drop to form a Grid layout
Step4: Select monitoring content
To customize your Operations Dashboard, you first need to select the monitoring content as the source of data from either of System Monitoring or Real User Monitoring or both. For this navigate to Page Personalization area.
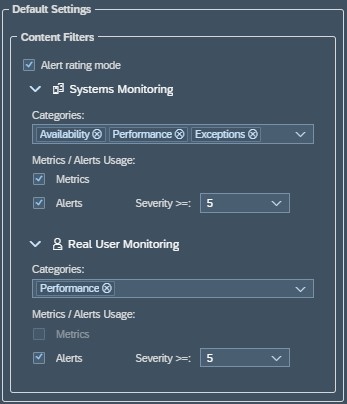
In the Default Settings area you can
Select or deselect monitoring area (System Monitoring/ Real User Monitoring)
Select or deselect metric or alerts
Select or deselect category (Availability/Exception/Performance)
Alert Severity ( Alerts of same or more severity are included in the scope of the dashboard)
Step 5: Create scenarios
In Order to link systems/ components to a particular region in the world map you need to create scenarios and link them to specific regions in the world map.
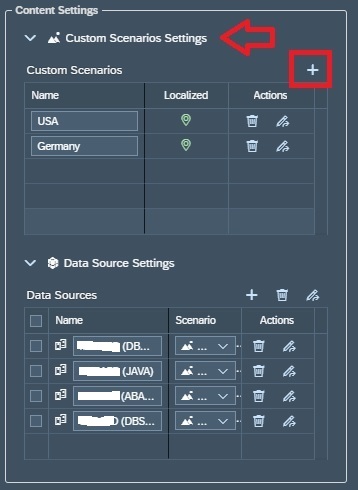
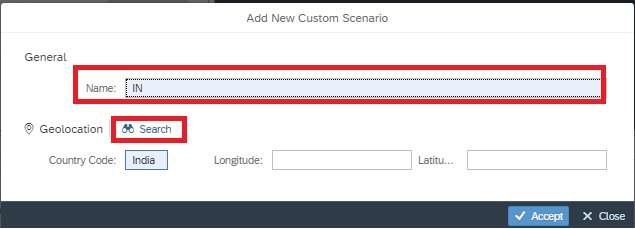
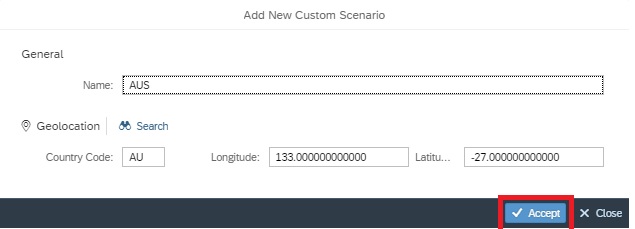
In this step you create named Scenarios or Regions to which you can later on tag your monitors. For this navigate to the Content Settings Area , Custom Scenarios Settings. To create a new scenario click on the + sign.
In the pop-up you can directly enter the country name or code or you can click on search to search for your respective country/region and it’s code.
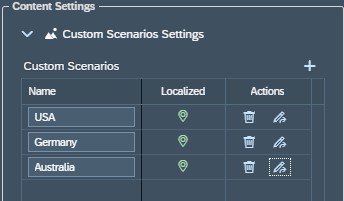
You can see the list of all scenarios you created in the Custom Scenarios section.
Step 6: Add monitors and tag monitors
In this step you add systems/components and tag them to specific scenarios you created in the previous step.
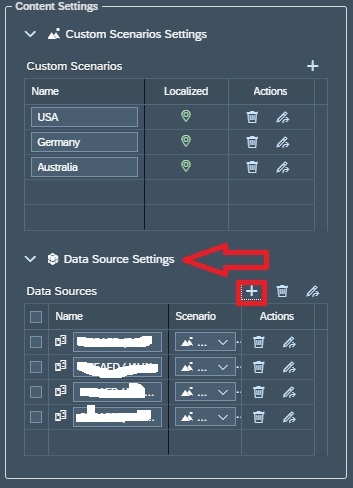
For this navigate to Content Settings area, Data Source Settings and click on the + sign.
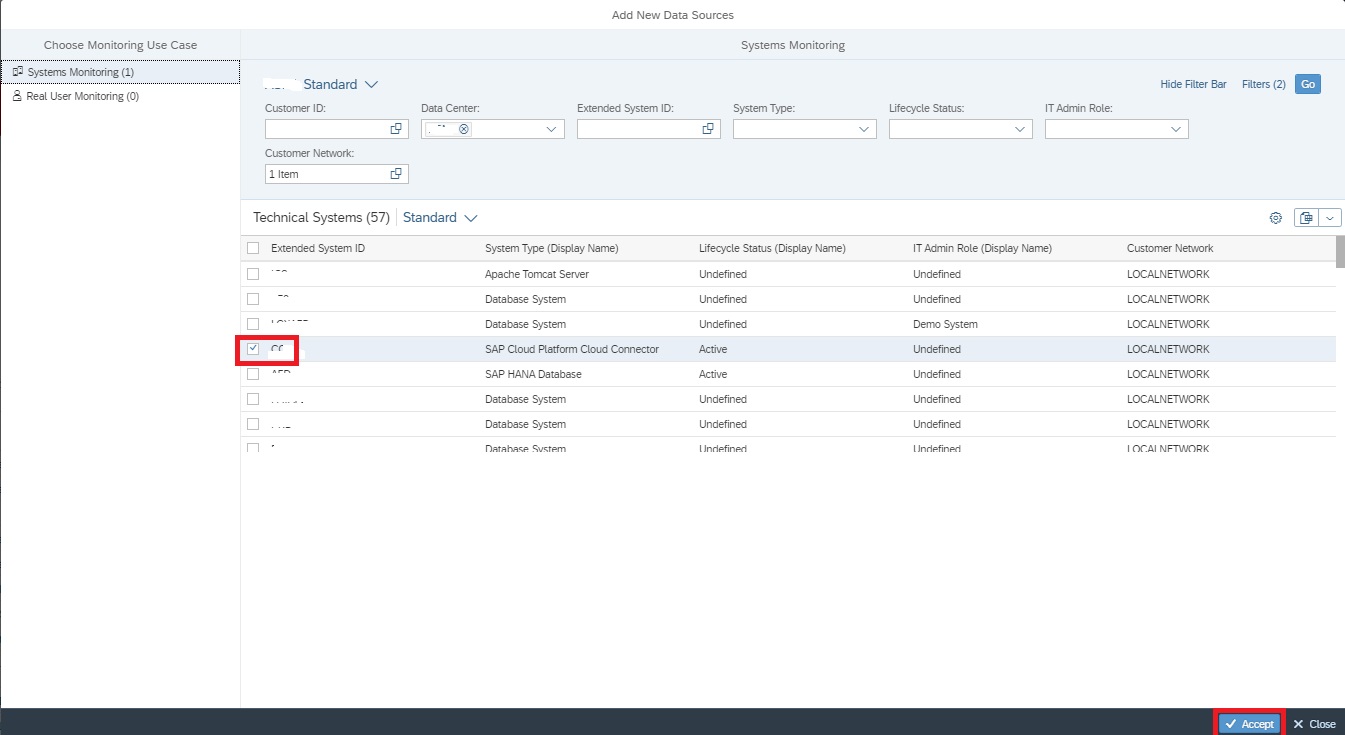
In the pop-up screen select the system/component you want to add and accept to continue.
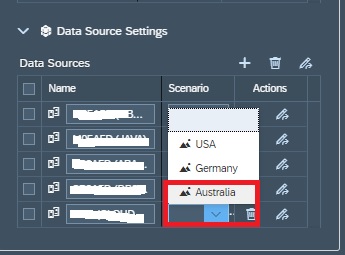
Now back in the Data Sources list select the scenario for the system/component you just added.
Now your Operations Dashboard is ready.
In View 1: World Map, the regions are coded as per the aggregated rating of all systems/componenets tagged to a specific scenario in the Data Sources settings in Step 6.
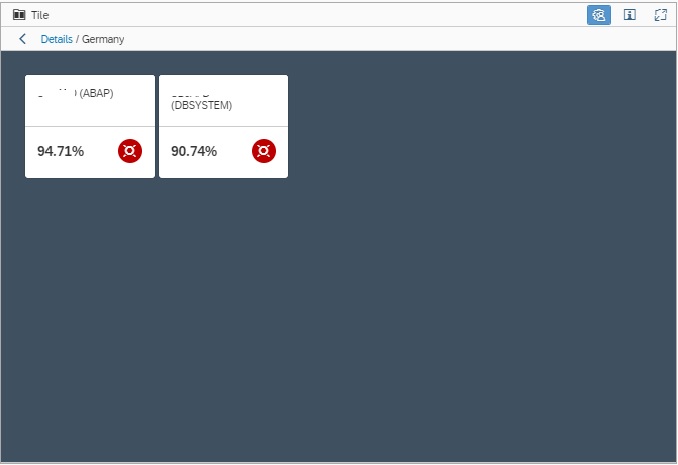
In View 2: Tiles View, by default shows the Region/scenarios aggregated rating in tiles. In this view you can drill down to aggregated rating for each system/Compoenent/monitor by simply clicking on the tile. (For instance below shows the Tile view of the systems in Germany shown in the image 2 of this blog.
3. In View 3: the List View, shows the monitors for all the system/componenet shown in Tiles view, that is, if you drill down in Tiles View, accordingly filtered monitors are shown in Tiles view.
When you are working with SAP Focused Run alert management, you might detect that some alerts are triggered too often. This will lead to work checking the alert and finding out it is more or less false alarm.
So a new threshold is needed, but what is a good threshold?
Questions that will be answered in this blog are:
Which tools can I use to perform fine tuning of alert thresholds?
Can I perform a forecast based on the data?
Can I perform a sensitivity analysis?
Which installation activities are required to enable the forecast and sensitivity functions?
Fine tuning alert threshold
In our example we will look at the Dialog Response Time metric. The current threshold for red alert is set to 5000 ms (5 seconds). The alert is triggered too often. But the question to answer now: what is a good threshold to set based on the historical data?
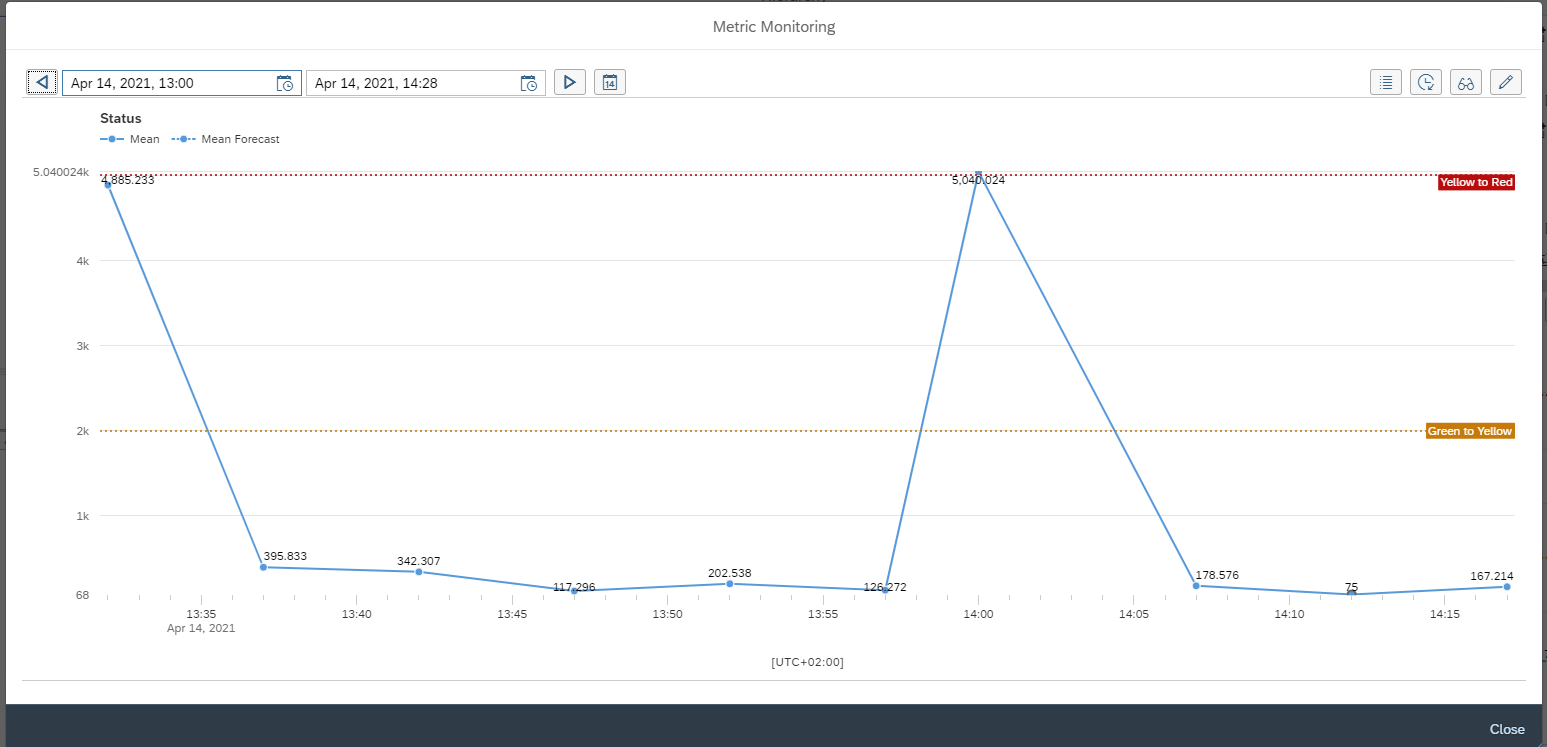
First click the Open metric in new window icon to enlarge the screen:
The enlarged screen now opens:
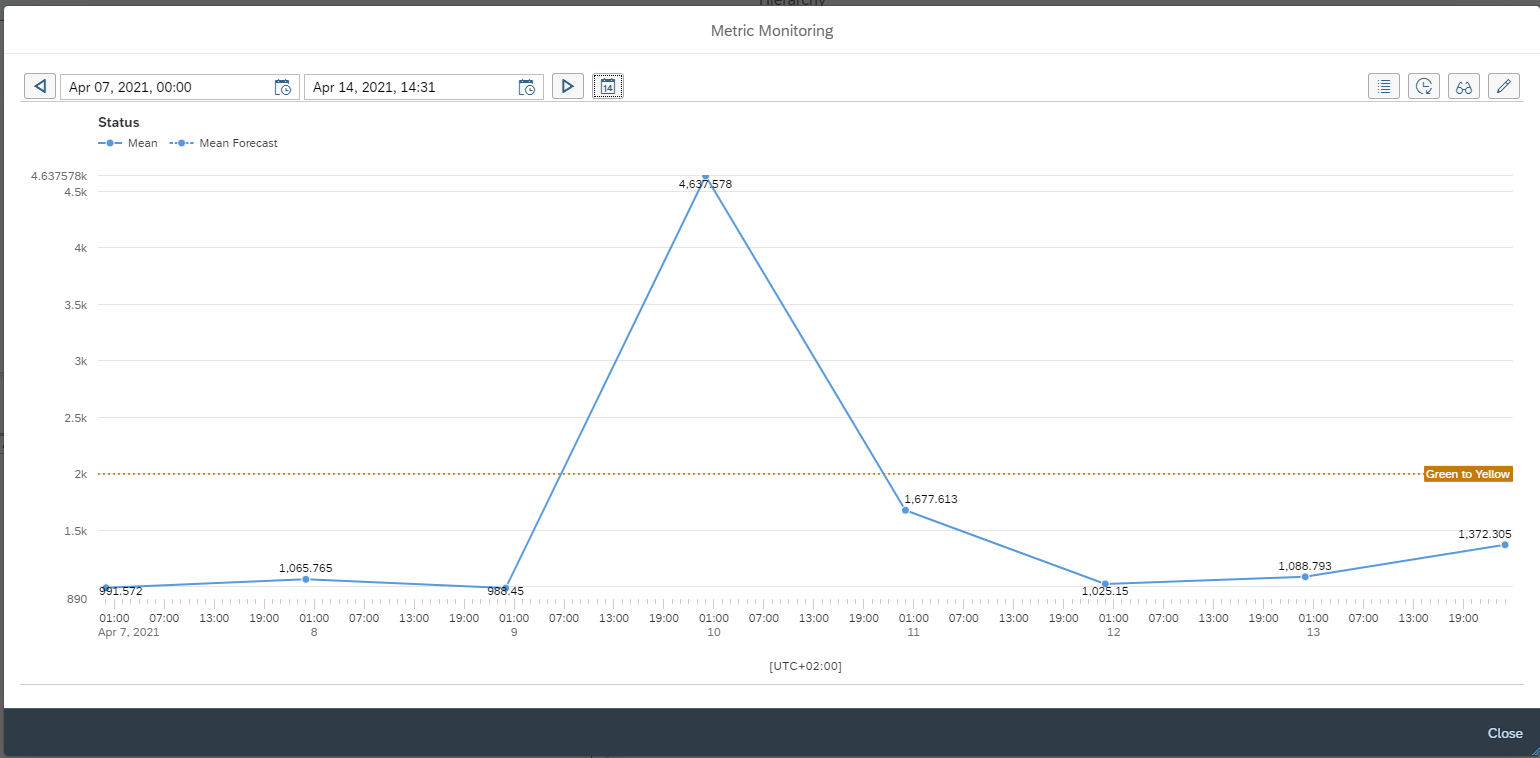
As you can see 2 times the red threshold was hit. We want to fine tune now. First select the calendar icon and select last 7 days to get full week overview:
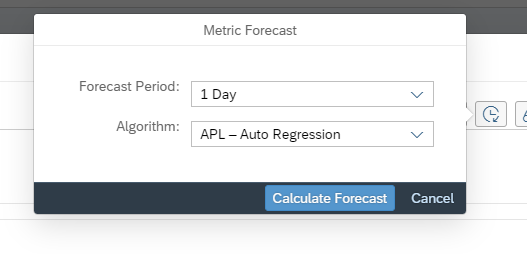
You can use the forecast button to let the system create a forecast:
The forecast will now show mean, mean low and mean high forecast:
In this specific use case the prediction is that the maximum is 3300 ms (3.3 seconds).
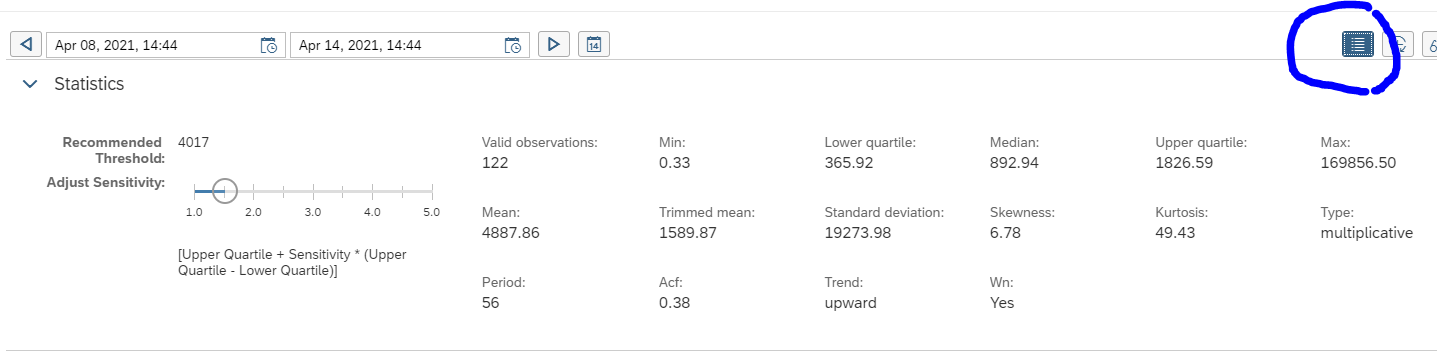
Now open the statistics button to see the statistics and the recommended threshold tool button:
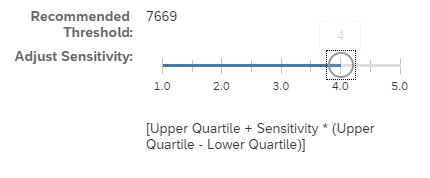
By changing the Sensitivity slider, the system will calculate different proposal for the alert threshold. In our case when we move sensitivity to 4 the new recommended threshold value is recalculated:
In this case it is 7669 ms.
So we now have collected following facts:
Current threshold of 5 seconds is reached too often
Average forecast based on history has a mean value of 3.3 seconds
Performing the sensitivity analysis the threshold recommendation is about 7.7 seconds
Based on this data the red threshold is best to increase from 5 to 8 seconds to get a good alert function. It will not reach too soon, hence limiting false alerts, but it will still alert in time in case poor performance happens.
Enabling forecast and sensitivity analysis
The forecast and sensitivity analysis function use the Application Function Library (AFL) and SAP HANA Automated Predictive Library (APL). These must be installed separately. The installation details and post steps for granting permissions are described in the Focused Run master guide in the section “Predictive Analytics Setup – Metric Forecasting”.
After the installation you must activate and assign PFCG role SAP_FRN_APP_PAS_DISP to be able to see the buttons.
There will be planned maintenance on SAP systems and the below databases, operating systems and the below infrastructure. During this planned maintenance, you don’t want any alerts and mails from SAP Focused Run, since the application is not available for a planned time.
Using the work mode management function you plan these maintenance events.
Questions that will be answered in this blog are:
How can I set up planned maintenance for systems monitored by SAP Focused Run to temporarily suppress the alerts during maintenance?
How can I see the current maintenance and planned upcoming maintenance?
Can I make a public page for the IT calendar?
Planning maintenance
Goto the IT calendar and workmode management tile:
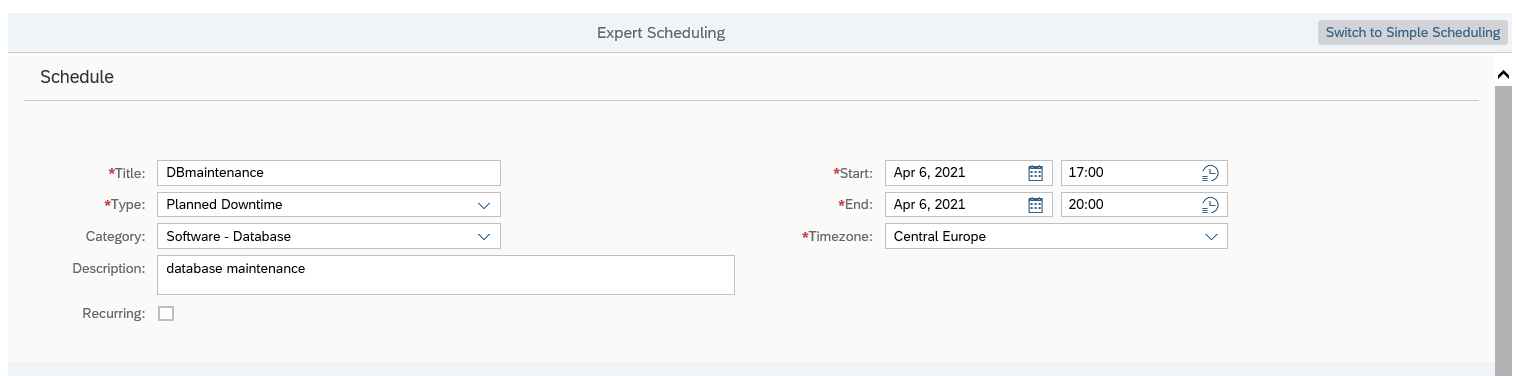
Select the system (or select multiple systems in one go) and create the work mode for maintenance, and immediately switch to Expert Mode:
With expert mode you can simply set start and stop date and time.
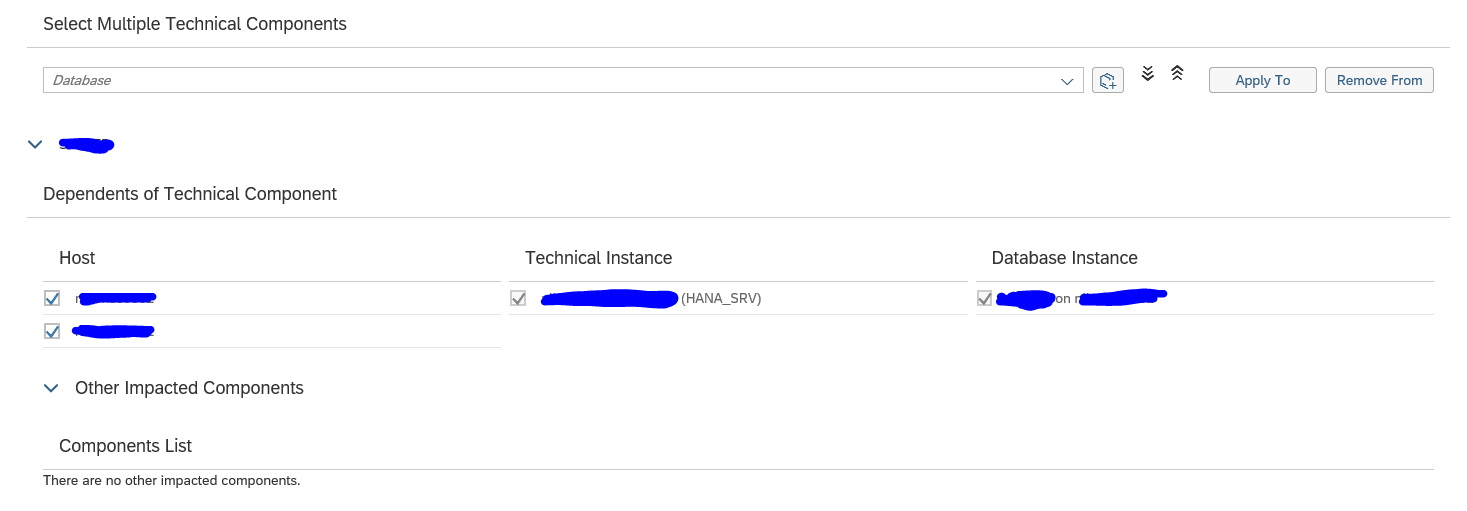
You also should check the scope (the system will make a proposal) and extend if needed:
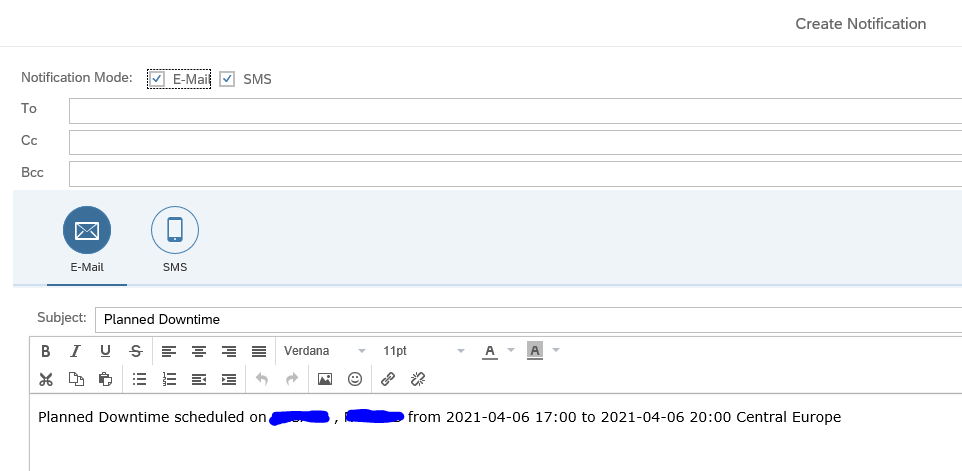
After saving, you can send notification via mail on the planned maintenance:
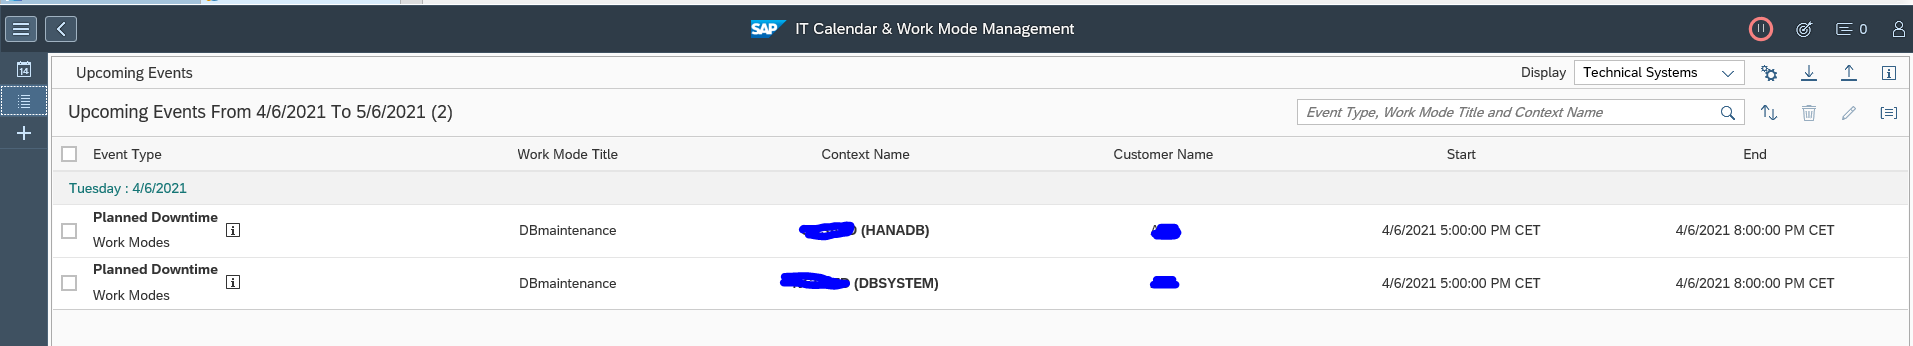
You can now see the planned maintenance in the calendar mode.
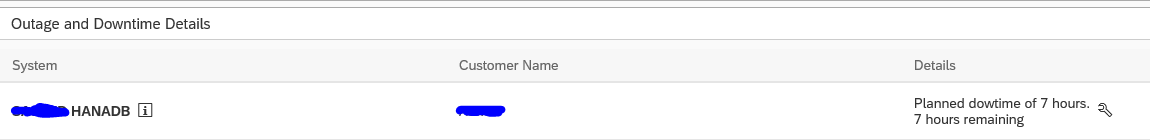
Overview of upcoming events
If you are in the calendar mode there can be a lot of systems. The overview screen for upcoming events will filter on the systems which have maintenance mode planned:
SAP Focused Run alert management function can send out mails to alert to mail addresses (see this blog).
SAP Focused Run can also call an outbound integration to a ITIL tool like ServiceNow. This can help to speed up incident creation.
It needs implementation on ABAP level. The ABAP coding is not explained in this blog, but in a dedicated detailed blog. This blog focuses on the usage and configuration on when to call the outbound integration.
Questions that will be answered in this blog are:
How does the high level integration between SAP Focused Run and ServiceNow look like?
Where can I find information on the to-be-implemented ABAP BADI?
How can I send an alert directly to ServiceNow from the Alert management detailed page?
How can I automate in template settings to send an alert via outbound integration towards ServiceNow?
Setting up the integration
For setting up the integration to ServiceNow the AEM third party consumer connection BADI must be implemented. The full manual for the BADI itself can be found on the SAP Focused Run Expert portal.
The documents describes the BADI in generic way.
To call ServiceNow you have to use one of the following 2 integration methods:
Call webservice: in this case you import the WSDL from ServiceNow and generate the proxy and execute the SOAMANAGER settings to logon to ServiceNow. You need ABAP code in the BADI to call the proxy. See this blog for generic use of setting up webservice consumption in ABAP stack. Available webservices for ServiceNow can be found on the ServiceNow page.
Call the ServiceNow midserver: in this case you call a REST interface. In this case you need to setup a HTTP RFC connection to the midserver. ABAP code in the BADI is needed to make the REST call. See this blog for generic use of REST call in ABAP stack. REST API references from ServiceNow can be found on the ServiceNow page.
In this blog we explain the ABAP code to put inside the BAPI. The below will explain the functionality part.
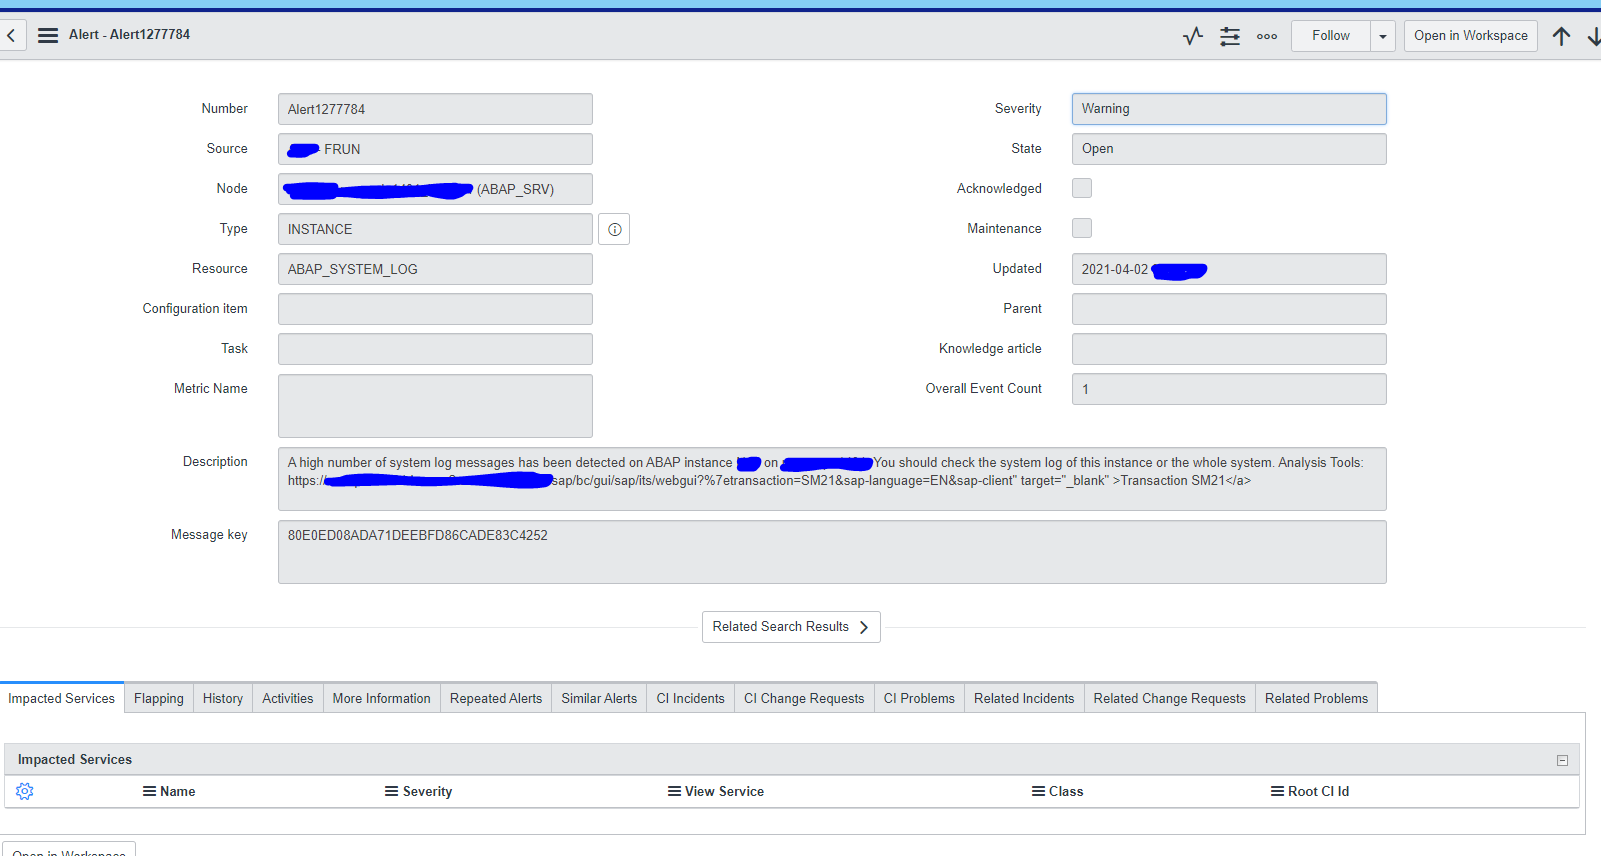
From alert trigger integration
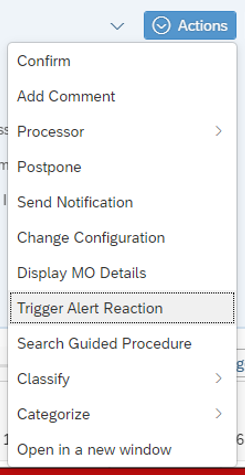
If you are inside an alert, you can trigger the alert reaction:
Then select the reaction to forward to ServiceNow:
Within few seconds the alert in ServiceNow is created:
Alert reaction automation in template settings
The alert reaction to ServiceNow can also be automated as Outbound Integration. If you are in template maintenance mode, switch to Expert mode.
In the alerts tab now configure the alert type for Forward to and Outbound Connector:
Assign the correct variant.
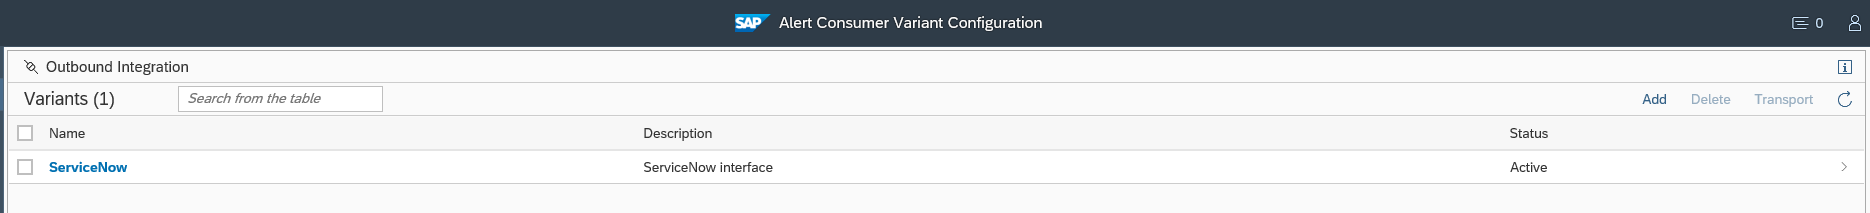
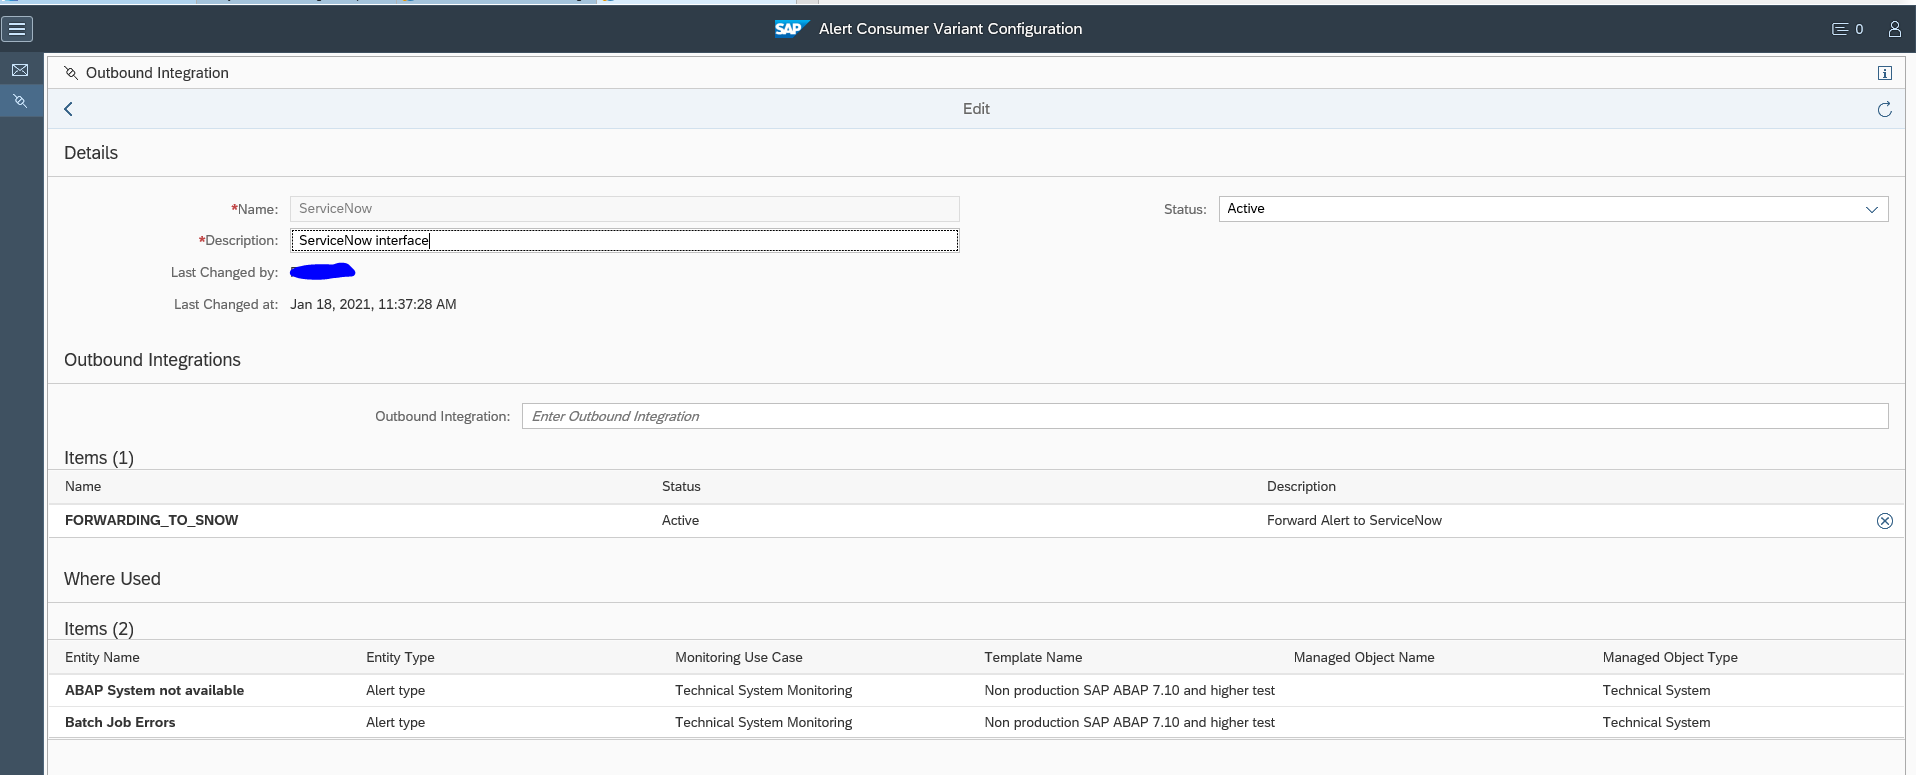
If you click on the variant you go to the variant configuration screen:
Then select the outbound integration name to see the details:
Important here is the where used list, which shows you from which templates and template elements the connector is called.
Whenever the alert is raised, also the outbound integration connector to ServiceNow is called.