Mass Agent Update in SAP Focused Run…

In SAP Focused Run, the Simple Diagnostic Agent (SDA) is installed/updated in managed system hosts via the agent admin app which we have explained in this blog. However with this approach you can update the agents for a single host or a selected list of hosts.

SAP Focused Run also provides a mass agent update app in the Focused Run launchpad using which you can update SDAs in all connected hosts of a particular data center on a single go. This is specifically useful for updating the SDA’s for all hosts after SAP releases a new version of SDA.

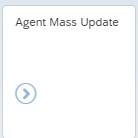
You can access the Agent Mass Update app in the Infrastructure Administration section of Focused Run Launchpad.

However before you use this app , you have to ensure that you have already uploaded the binaries as we have explained in this blog.

For updating the agent just open the app and select the Data Center for which you want to update the agents and click on Update agents to start the update.

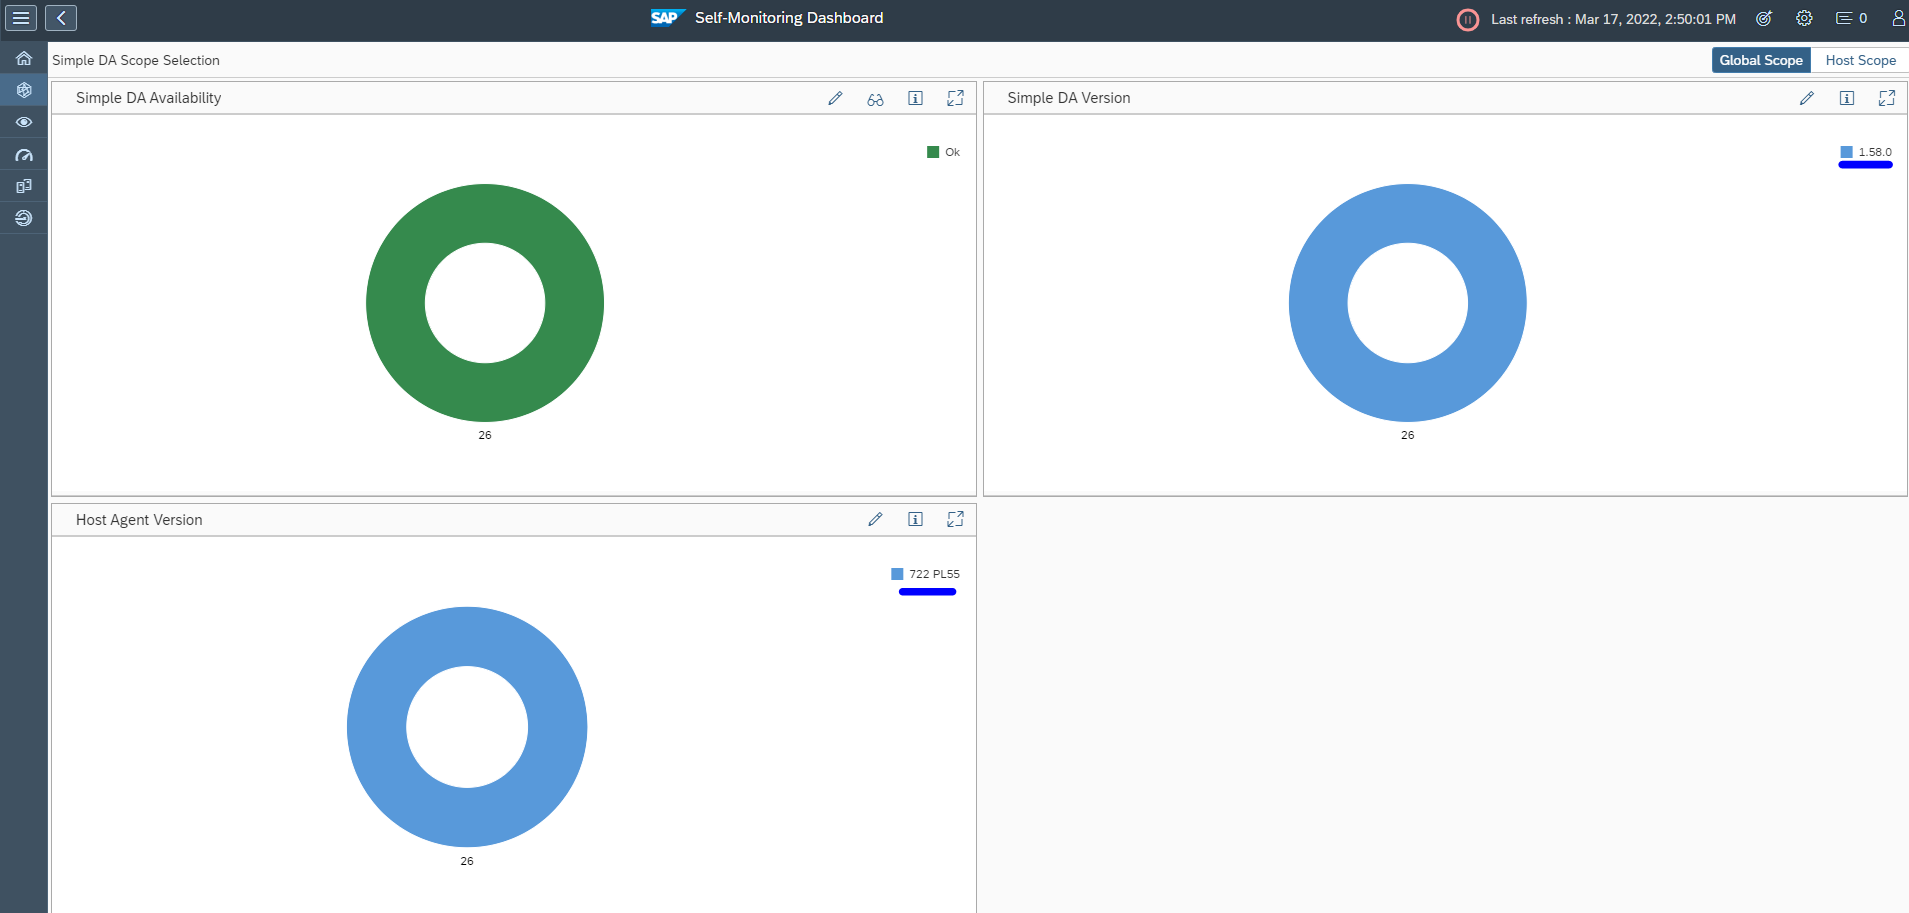
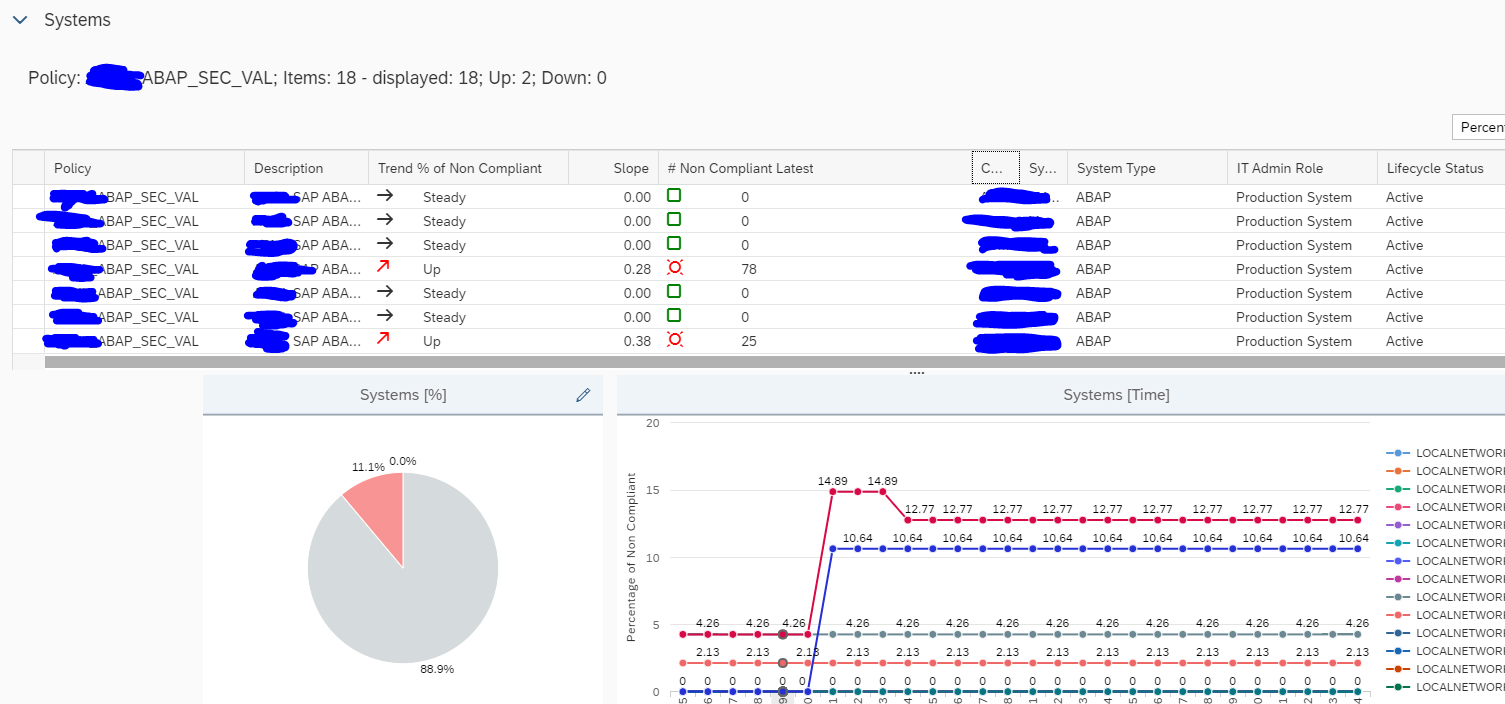
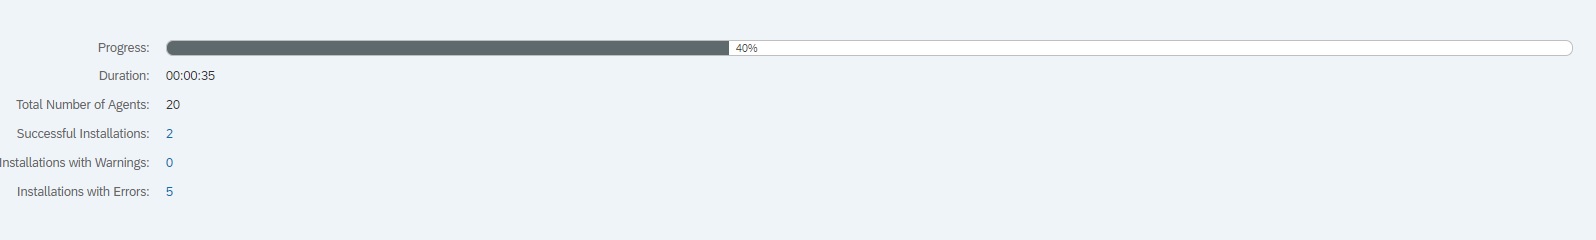
After you start the update, you can monitor the progress with the progress bar where it also lists how many agent installations were successful and how many have failed.

Note: SAP normally releases a new version of SDA every 2 to 3 months. You can download the latest version of SDA from here.

Hotnews note 3145987…

Unfortunately SAP had to release hotnews OSS note 3145987 – [CVE-2022-24396] Missing Authentication check in SAP Focused Run (Simple Diagnostics Agent 1.0). More background can be found in that note and in the Q&A note: 3148440 – Q&A for SAP Security Note 3145987.

What is the problem?

From the note “The Simple Diagnostics Agent 1.0 (up to version 1.57.*) does not perform any authentication checks for functionalities that can be accessed via localhost on http port 3005. Due to lack of authentication checks, an attacker could access administrative or other privileged functionalities and read, modify or delete sensitive information and configurations.”.

What to do to fix it?

The fix is two steps:

1. Update the host agent to version 7.22 PL55 or later as a prerequisite (see OSS note 3113553 – SAP Host Agent 7.22 PL55)

2. After step 1 update the SDA (simple diagnostics agent) to version 1.58.0 or later (see OSS note 3113553 – SAP Host Agent 7.22 PL55). You can do a mass deployment using the Agent Mass Update tile.

How to monitor the follow up?

Open the Self monitoring FIORI tile:

Click on the SDA icon on the left:

Check that all versions are ok:

Trend analysis for configuration and security analytics…

Since Focused Run 3.0 feature pack 2 a new FIORI tile is present: trend analysis for configuration and security analytics:

Prerequisites

For the policy to work, you first need to schedule it in the policy management tile. Select the policy and press the Configure button:

On the popup screen press the Edit button:

Set the scheduling frequency and save the data.

Use of the trend analysis

Opening the trend analysis tile starts with the overview screen:

You can change the timeframe of the analysis and scope with the normal icons top right.

Selecting a policy will open the trend graph below:

Below that graph are the details for the systems:

Organizational use of the trend analysis

The trend analysis can be used to quickly see for your important security policies how the situation is developing.

When strengthening the policies, you will see many non compliant systems initially. Often some sandboxes, or development systems are forgotten. The trend analytics will spot it, and you can act on it.

Identifying all grey metric in System Monitoring…

In SAP Focused Run there is no standard mechanism to identify and display all grey metrics in System Monitoring, a grey metric can cause critical situations not being captured and alerted in monitoring hence we need to monitor such grey metrics.

In this blog we explain how you can list all the grey metrics by directly reading from database tables that store the monitoring data.

Focused Run system monitoring metric aggregate data is stored in table AEM_METRIC_AGGR. We can filter on metric status = Grey to see the list of grey metrics.

Open the table in transaction SE16:

Increase the width and no of hits and click on execute

Now you have all the data that you can export to an excel sheet. For this select the following menu option.

Select file type as Text with Tabs.

Provide the path and filename to save the file and then click on Generate button.

Now open the .txt file in MS Excel.

In the Home tab select option for filtering as shown below

Now set the following filter for the column LAST_RAT

Now you will get the list of all grey metrics as shown below.

Note: The Context_ID value will give you the ID of the managed object, Metrtric_type_ID will give you the ID of the metric name and the Last_text will give you the return text of the last data collection which will give you the reason for grey metric.

In order to get the managed object name and metric type you can use the following in transaction MAI_TOOLS –> Metric Event Alert Details.

In the selection screen for Managed Object ID enter the Context ID from the excel and for Metric Type ID enter the same from the excel. Also select the checkboxes as shown below and execute.

Now you will get the info on the Template as well as the Metric name which is currently in grey.

SAP instructions

You can also check the instructions from SAP in OSS note 2859574 – How to list all current Grey Metrics in FRUN.

Alerting on important grey metrics

If a critical metric turns grey (meaning it can be good, or bad), you can set a specific alert when this happens. For example Oracle system in stalled mode might turn grey in stead of red. In this case grey is the same as red: system will not work.

For setup instructions: read this dedicated blog.