Using the Alert Management function…

The alert management function is a central alert inbox function for SAP Focused Run. All alerts from all tools are coming together in the alert inbox.

Questions that will be answered in this blog are:

  • How does the alert inbox work?
  • How can I get a good overview of all the alerts?
  • How can I mail an alert?
  • Which actions can I perform on an alert?
  • Can I set up my own alert dashboard?
  • Can I have Focused Run automatically confirm some of the alerts, when the system detects all is ok again?

Alert inbox

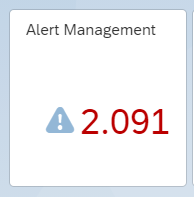
To open the Alert Inbox, click on the FIORI tile:

Don't let yourself be distracted by the high number. This is the total unfiltered amount of alerts. It will contain alerts from production and non-production systems. It will be important and non-important alerts.

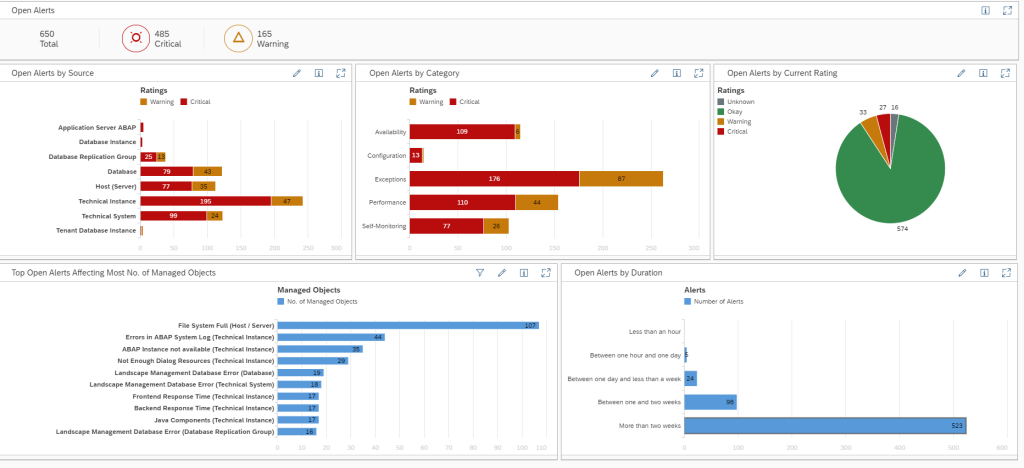
Now the open alert overview dashboard will open:

There is a lot of information on this screen.

Top left are the open alerts by source. This means the open alerts by application, instance, database. In the middle top are the open alerts by category (like availability, exceptions, etc). Top right is the open alerts by current rating. Bottom left is the top type of open alert by type of metric that is causing the alert. Bottom right is the distribution of open alerts by age.

Processing an alert

From the overview you can choose two ways to start:

  1. On the top right section click on the Critical alerts that are currently still open.
  2. On the left, select the open alert list icon:

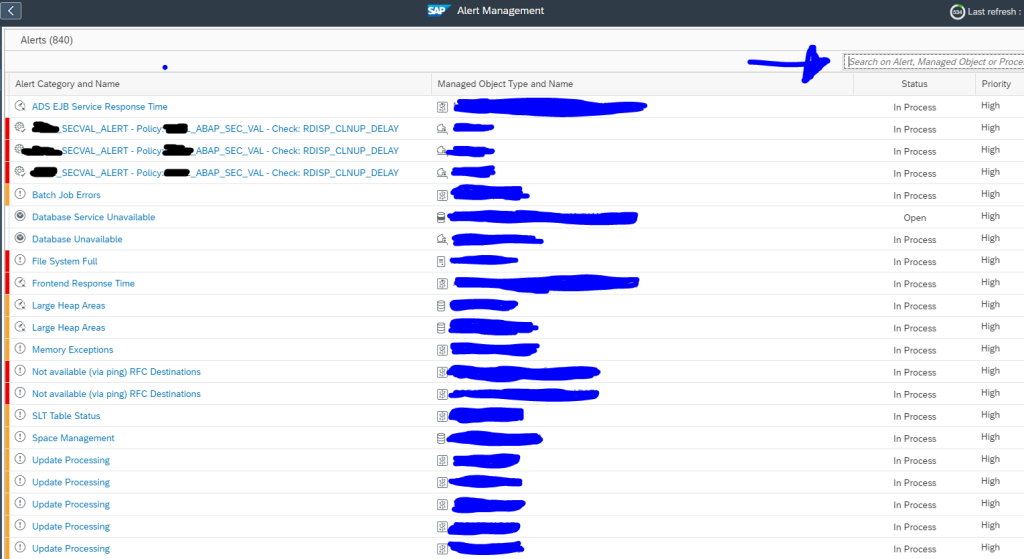
Both options will bring you to the list of open important alerts:

The sorting is done from Very High and then High, etc, already. The most important open current alerts are on top. This list can also be exported to Excel.

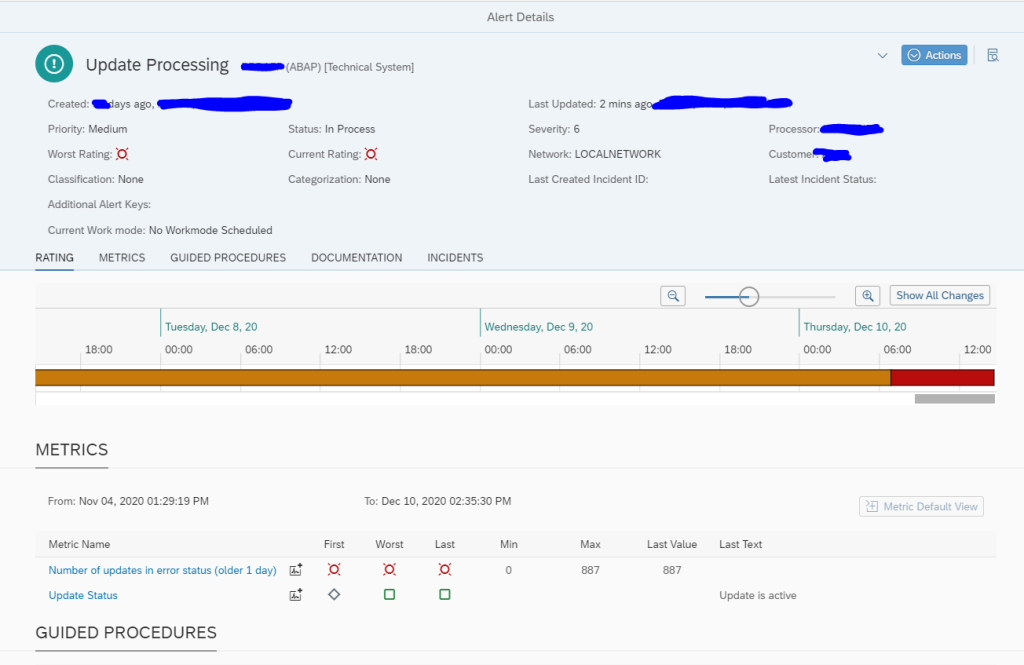
Clicking on an alert will open the details:

Here you can see the history and current status. It can be that the alert is till red, but it can also be that Focused Run detects that the current situation is now ok. It will still leave the alert open for you to analyse and confirm.

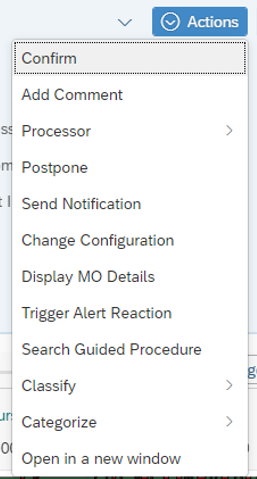
You can click on the Actions button to get the follow up action menu:

  • Confirm the alert will close the alert.
  • Add a comment: add text to the alert.
  • Add or change a processor: assign a user ID who should pick up the alert and is responsible for the alert.
  • Trigger an alert reaction (for example to SAP solution manager IT service desk or outbound integration to for example ServiceNow)
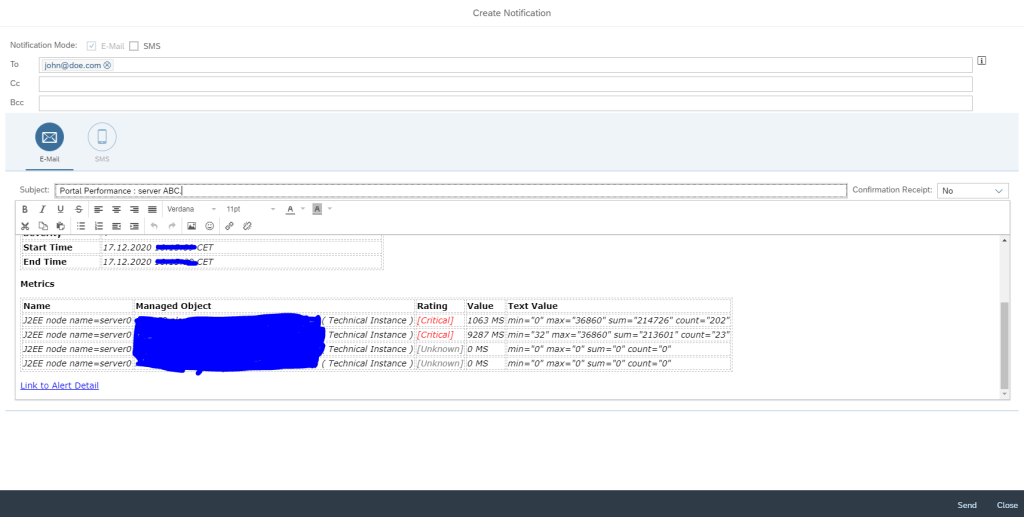
  • Send notification will give you the option to mail the alert:

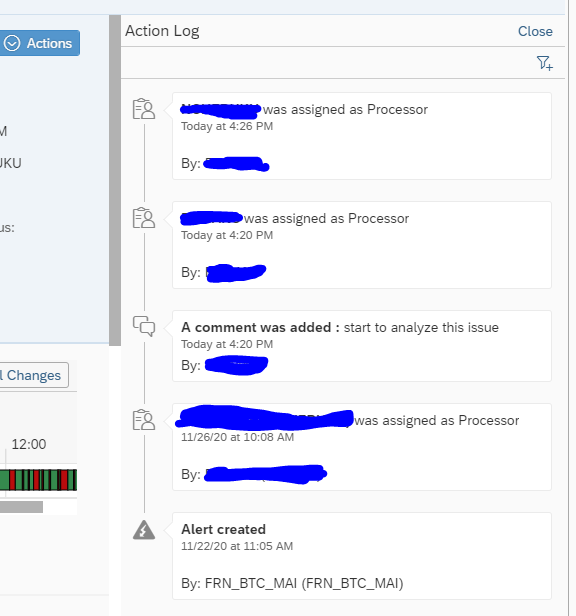
Using the action log button:

you can see the action log for the alert:

Automatic confirmation of alerts

For some type of alerts, you might want to activate the automatic confirmation. This automatic confirmation is set at template level. Read this blog on the details. If it is set, the alert will still be created. The alert will remain open until the system detects the issue is gone. If gone, the system will automatically close the alert.

Alert management search

With the looking glass left you goto the Alert search overview. Here you can search in any way you want on the alerts, including free text search:

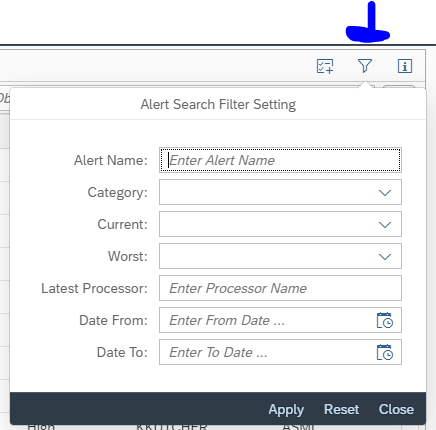
Top right you select extra specific filter criteria:

Alert reporting

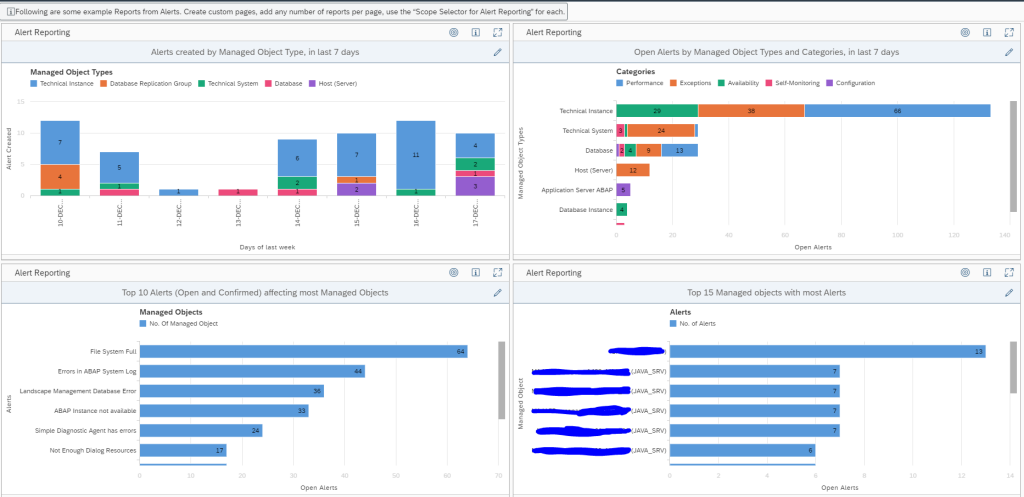
In the left you can select the option Alert Reporting where the default alert report will open:

Clicking on any colored bar will bring you to the detailed list. From the list you can filter down to the details.

Custom alert page

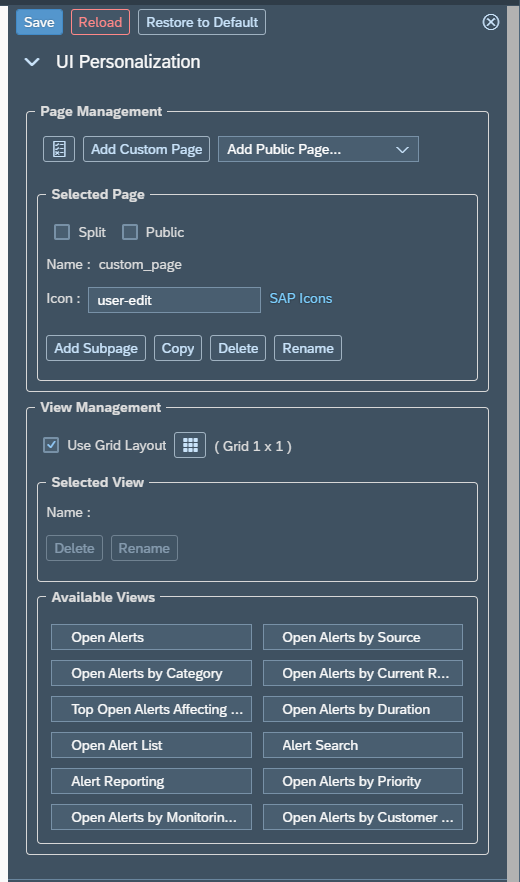
By clicking on the + icon on the left button bar, you can add your own alert page:

The UI is the same as for the tactical dashboards. Read more in that blog on how to configure the dashboard.
SAP Focused Run Rule Based Template Assignment…

Introduction

When we perform Simple System Integration (SSI) on a managed system , it automatically activates the SAP default monitoring template on the managed system. However, in most of the SAP Focused Run (FRUN) implementation scenarios, we create customer defined monitoring templates (Custom Templates), which we then manually assign/activate on the managed system.

Rule Based Template Assignment is a feature in FRUN by which we can define based on managed system category which custom monitoring template to be assigned and activated directly when we perform SSI on the managed system.

Defining Rule Based Template Assignment

For Rule Based Template Assignment navigate to the FIORI tile Individual Maintenance in the Advanced System Management section of FIORI launch-pad.

In the Individual Maintenance App navigate to the Rule Maintenance by clicking on the button as shown below.

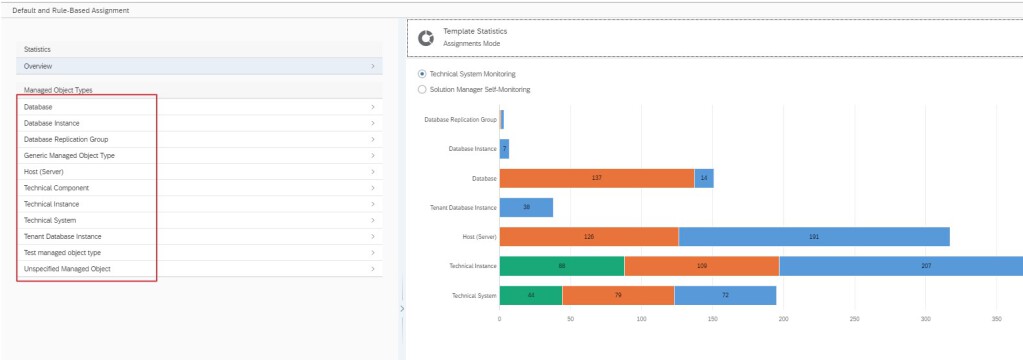
In the Rule Rule Based Assignment Screen, on the left hand side panel, select the specific Managed Object type for which you want to define the Rule Based Template Assignment.

In this blog we take the example of defining a Rule Based Template Assignment for managed system of type SAP ABAP BASIS 7.10 and higher and specify the custom template for System Level monitoring template. So we select Technical Systems upon which the right side panel now gives a list of all product types. In the right side panel we scroll down and select SAP ABAP BASIS 7.10 and higher.

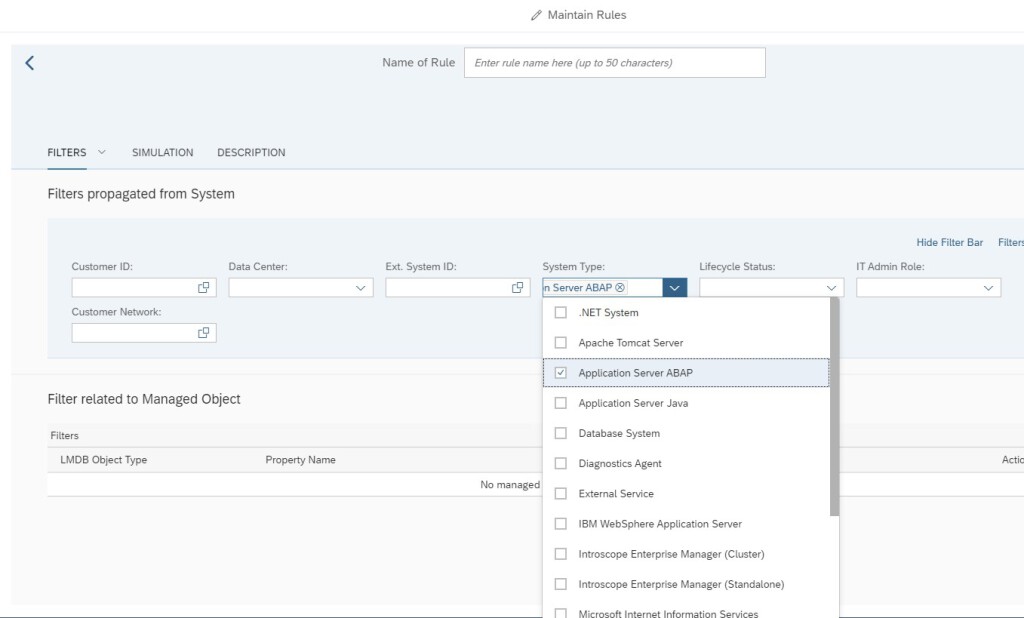
Now we need to define the Rule based on which the Custom Defined Template to be defined. In this blog we take the example that we have defined 2 custom templates one for Production Systems and one for Non Production Systems. So we will need to define rule to assign template based on filters System Type ABAP and IT Admin role defined in LMDB. For more information on this function read this blog.

In the subsequent screen select Maintain Rules.

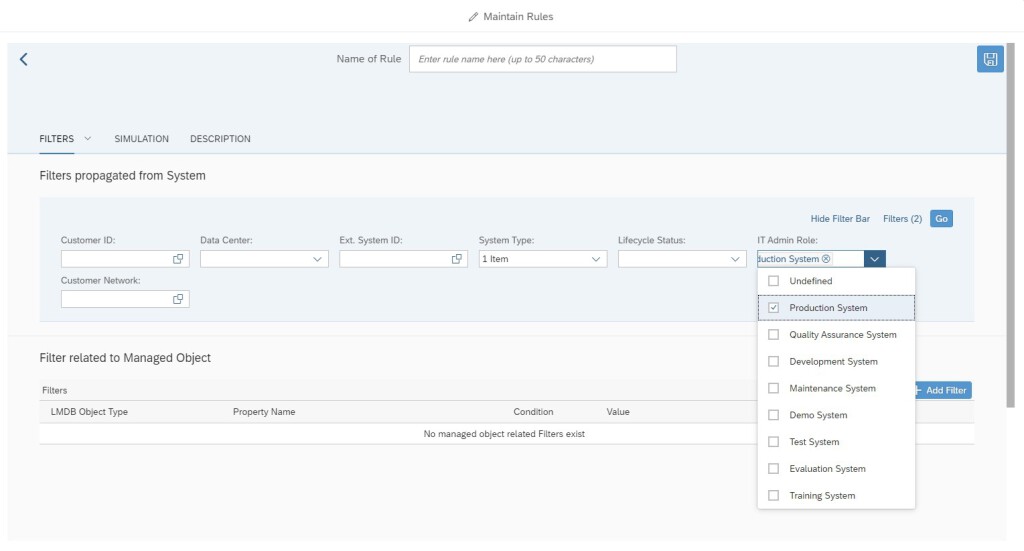
In the Maintain Rule screen we select the following filters.

Name your Rule and Save.

Similarly you can create Rule ABAP Non production, just ensure to select the following IT Admin Roles.

Now back in the main screen select the Rule you created from the drop down.

And for Template select the custom template you want to select for the assignment.

Add the assignment.

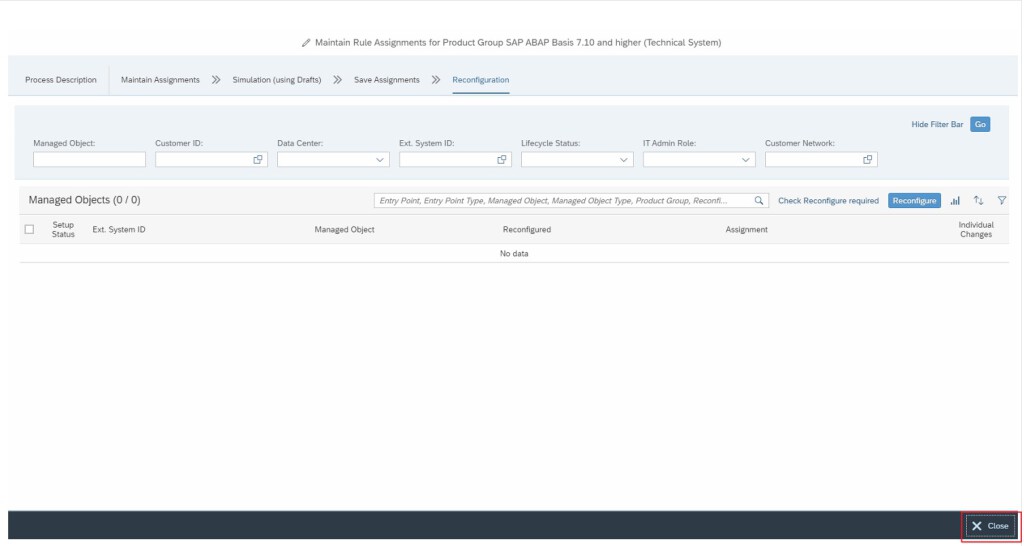
Now click in Continue with Next Step button till you come to the Reconfiguration tab and then close. This will allow you to save your Rule Assignment.
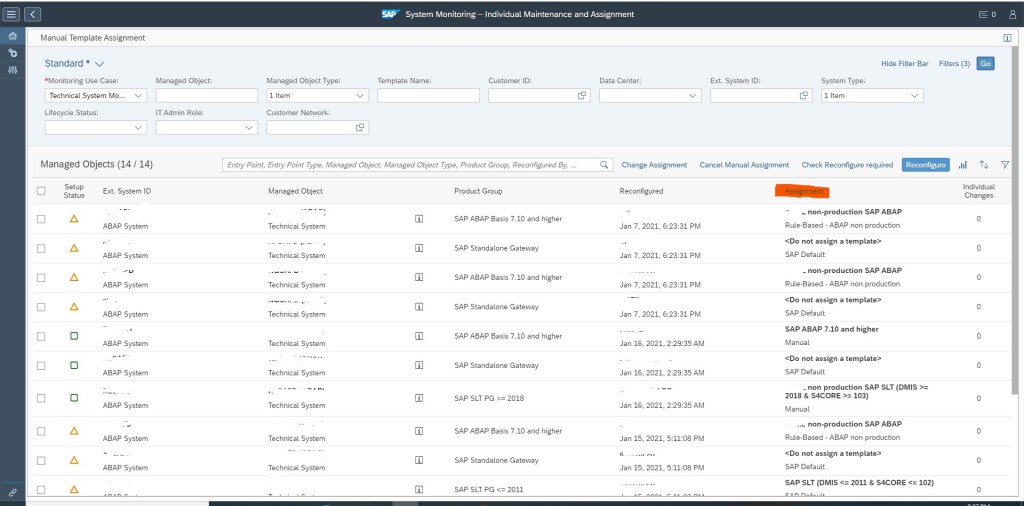
Once you have assigned the ABAP Production and ABAP Non production rules in the main screen you will see the following assignments listed.

After the assignments done, the next time SSI performed on any ABAP system will take up the custom monitoring template as defined in these rules.

In Individual Maintenance system list you can also see whether current assignment is SAP default or Rule Based Template Assignment.

Batch job monitoring setup Focused Run 3.0…

This blog will explain how to setup batch job monitoring in SAP Focused Run 3.0. If you are using SAP Focused Run 4.0: read this blog on batch job monitoring setup in Focused Run 4.0.

The usage of batch job monitoring is explained in the overview blog for batch job monitoring.

Questions that will be answered are:

  • How to setup batch job monitoring?
  • Can I monitor batch job start delay?
  • Can I monitor batch job duration?
  • Can I monitor if specific error messages occurred in the job log?
  • Can I alert on batch jobs?
  • Can I notify on batch jobs errors by sending mails?

Batch job monitoring setup

To setup batch job monitoring start the Batch job monitoring FIORI tile:

On the top right now open the configuration screen by clicking on the wheel icon:

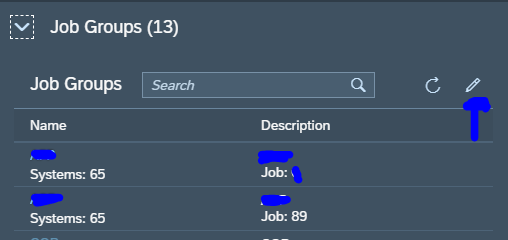
The batch job groups now open. Select the pencil icon to change:

In the next screen press the New button to add a new Job group:

A batch job group can be set up in many ways:
1. You define one group for each system.
2. You define a group per functionality that crosses multiple systems.
3. Combination of the above. For example all technical jobs are clustered.
Think twice carefully on this setup before you start to implement. Changing between the concepts can be costing a lot of work.

Give the new group a name:

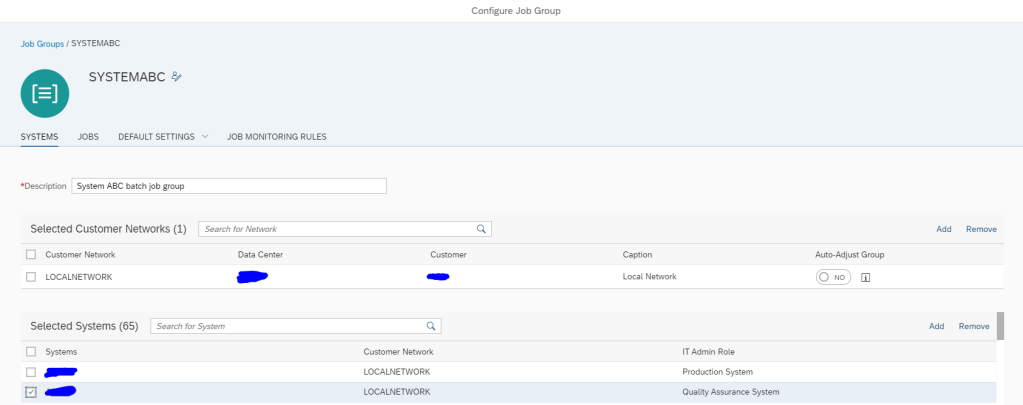
Give the new job group a good description and add the systems:

Save the definition.

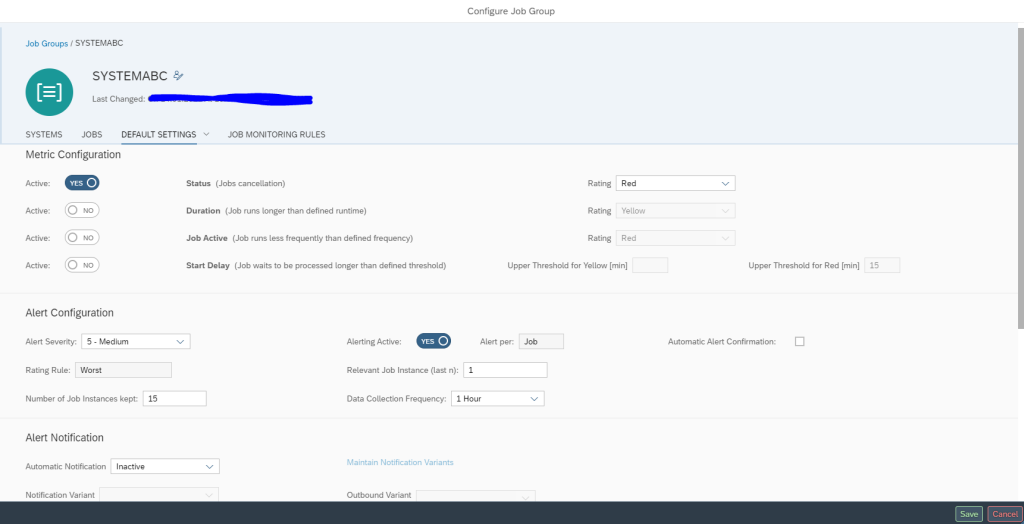
First goto the third tab to make the default job settings:

The default job settings will be applied to any job added to the group. You can still fine tune per job later on. It is best to start with job status monitoring first. And only switch on the more advanced options later on for specific jobs only.

Save your settings again.

Now go to the jobs tab and press the add button to add new jobs:

In the selection screen that pops up now, it is very important to first select the system you want to read the jobs from, and then press go:

Focused run will now read the jobs from the remote system. In the list, select the jobs you want to monitor. You can select them mass as well. Then press ok.

Save your work.

The selected jobs are actively monitored now.

The jobs need to run first before they are visible in the batch job monitoring overview screen. Especially for the weekly and monthly running jobs.

Fine tuning the job monitoring: job errors

Fine tuning of the job monitoring can be done on the monitoring rules tab. First select the job to fine tune:

Now you can start to make deviations from the default.

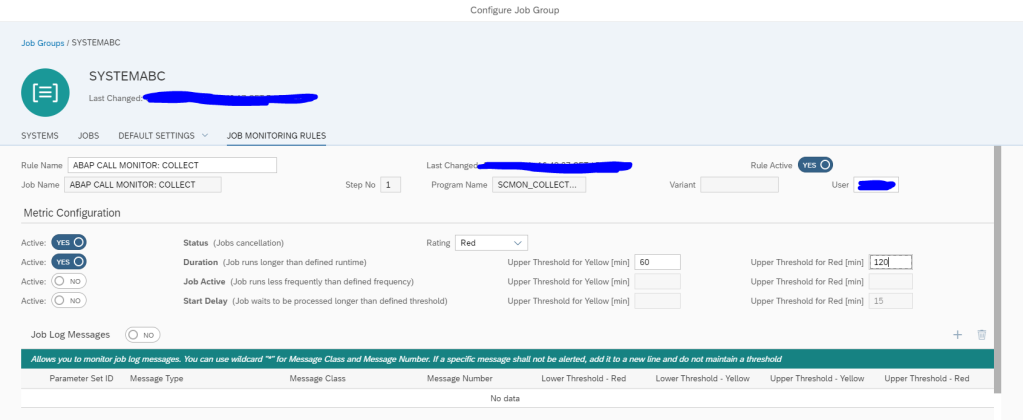
In the example above the job duration monitoring was activated. Note here that you should set 2 thresholds: 1 for yellow and 1 for red.

The third option is job activity: this you switch on for jobs you need to have running at a certain frequently.

The fourth option is the job delay: some job really must be started in time without delay. Indicate here after which time an alert should be generated if the job does not start in time.

The last option is to check the job log messages. Here you can check for messages in the job log. Usage example: a job might have finished technically correct, so the job cancellation is not triggered. But inside the job log a functional error might occur. This error code you can pickup here and trigger an alert in the job monitoring.

Fine tuning the job monitoring: alerting

In the second block you can fine tune the alerting per job:

You can choose here to automatically confirm the alert if the system detects that the next batch job run went ok.

The other important fine tuning possible here is decide how many job failures in a sequence are needed before the alert is raised. For example, you have a job that runs every 10 minutes, but on average fails twice per day and is normally corrected the next run. In this case you can set the Relevant job instance counter to 2. This way 2 failed jobs in a row will alert. If it is recovered after a single wrong run there is no alert generated (here you must also fine tune the data collection frequency).

In the alert notification section you can assign an alert notification variant (this holds the mail template and receivers). In the default setup, you normally set the notification towards the basis team. But for some job(s) you might also want to notify a functional or business team.

Reference

The full setup guide for batch job monitoring can be downloaded from the SAP Focused Run expert portal via this link.

System down monitor…

A special function is System Monitoring is the System Down Monitor. This overview directly gives an overview of the systems that are considered down by SAP Focused Run and the systems which are set to having maintenance.

Questions that will be answered in this blog are:

  • How can I quickly get an overview of all my systems that are down?

System down monitoring

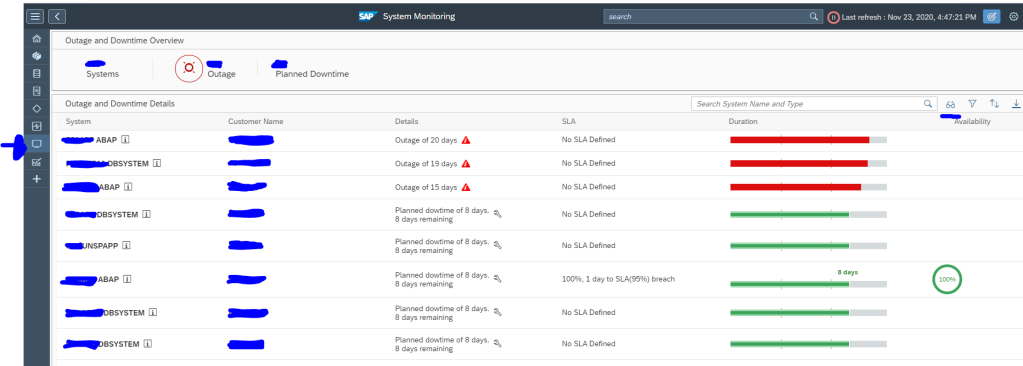
In the system monitoring screen select the System Down monitoring icon on the left icon bar (here indicated with the arrow):

You can see systems that are down and which ones that are having planned maintenance. If you have set up the SLA management, it will also show that aspect.

If you want to zoom in on the issues, press the i icon right of the system. Then select Links to go to the respective tool for further investigation:

For systems down the best tools are usually the System Analysis and the Alert Event management.

Changing settings

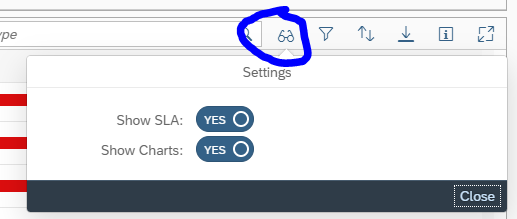
You can change the layout settings with the glasses icon:

You can show/hide the SLA and charts section as per your need.

Definition of down

The definition of down is in Focused Run: any red alert in the availability metrics. This can be:

  • Complete system down
  • One of the application servers is down
  • Core function is down (for example ABAP stack is up and running, but the Https is not available)
  • Important subfunctions are not working (for example in the SLT system 1 or more source systems can not be reached)

Tactical dashboard…

The tactical dashboard is a nice dashboard to check you system status across multiple systems. Items that are part of the tactical dashboard is database backup status, performance, logged on users, software maintenance status.

Questions that will be answered in this blog are:

  • How to use the Focused Run tactical dashboards?
  • How to fine tune the tactical dashboards?
  • How to setup your own tactical dashboard?

Tactical dashboards usage

To start the tactical dashboard, click the corresponding FIORI tile:

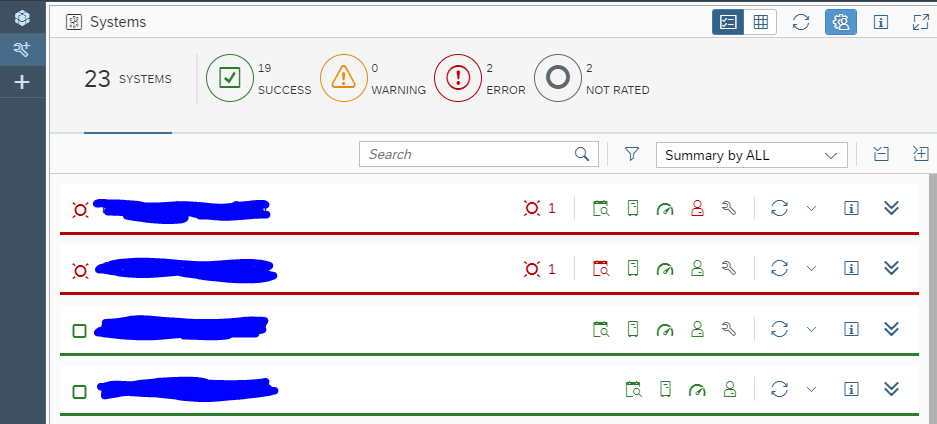
You now reach the tactical dashboard overview screen:

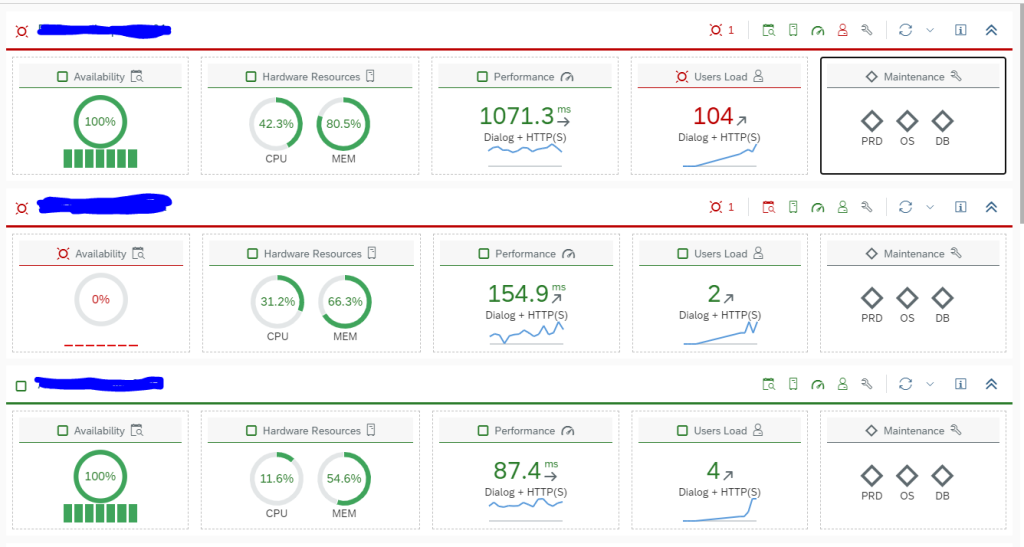
By clicking the Expand Group icon at the right you get first level of details:

By clicking the tile you are interested in you get the details.

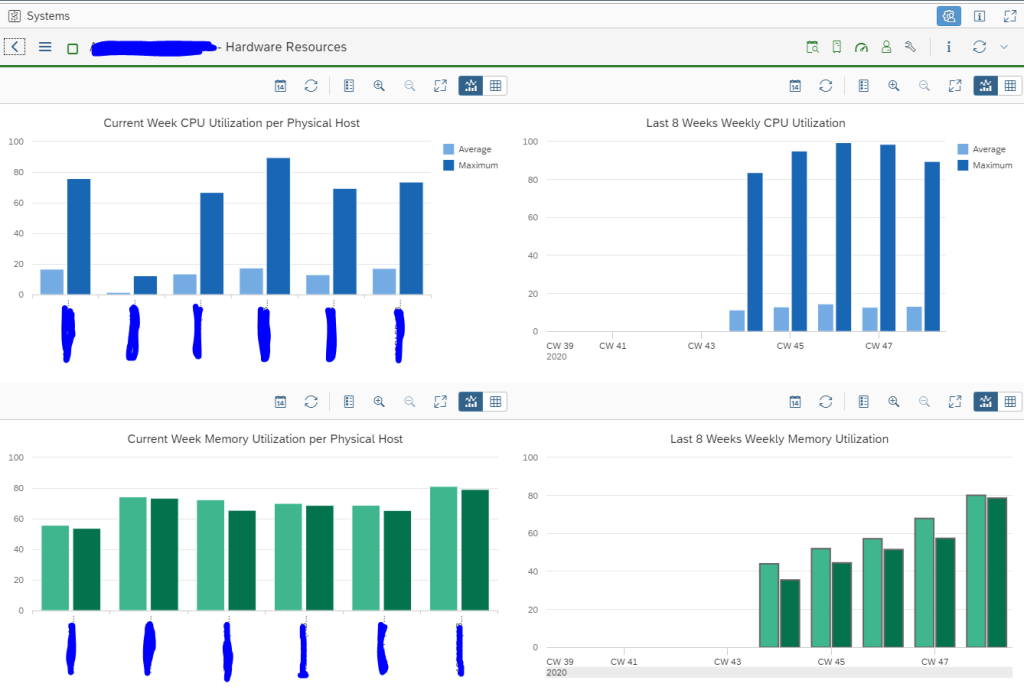
Examples are hardware resources for current week and last month:

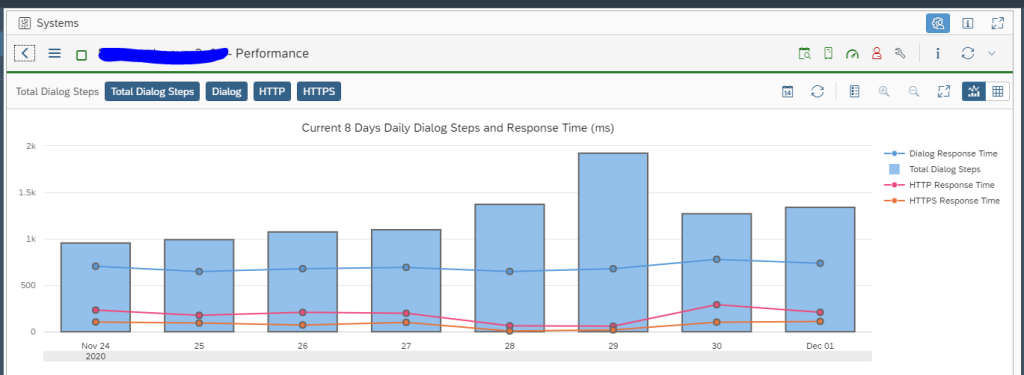
Dialog response times:

Amount of logged on users:

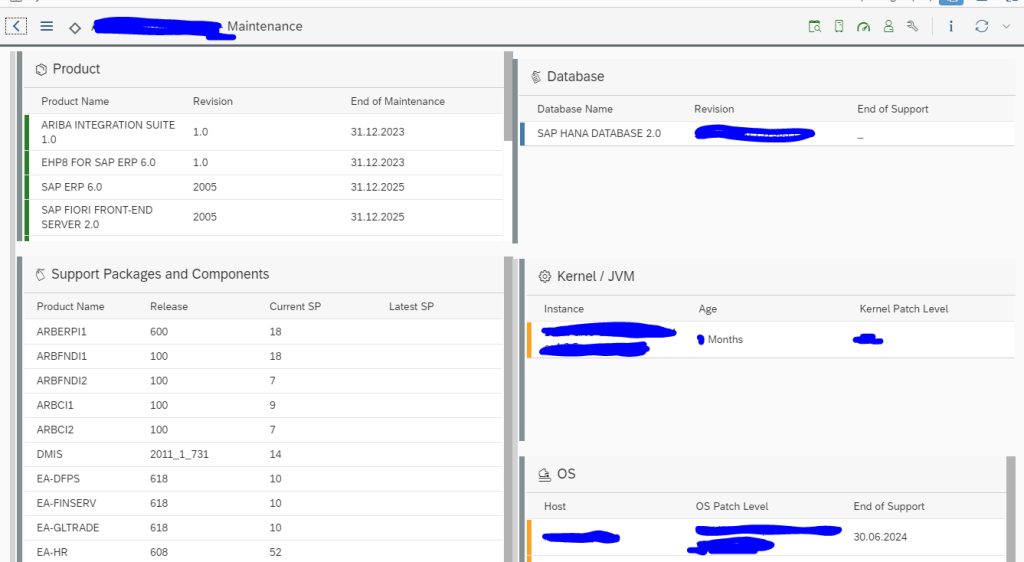
And software maintenance status:

More on the age of software components can be found in this detailed blog.

Configuration of dashboard

By clicking the personalization button top right:

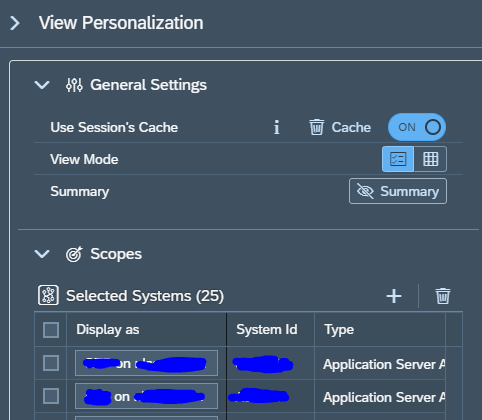
you will reach the configuration screen. Here you can add and delete systems from the overview:

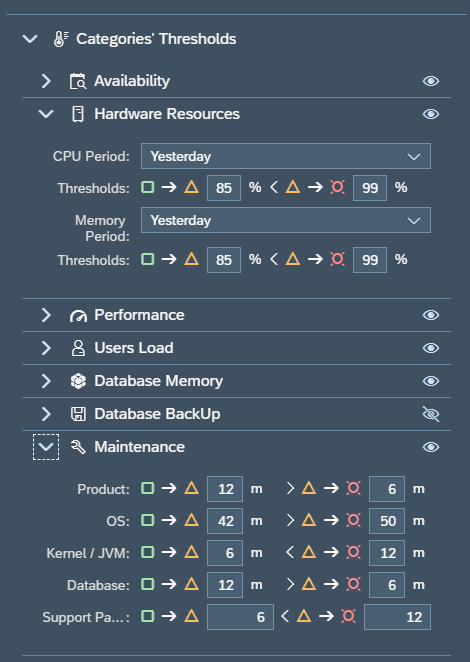
And you can set the view properties and thresholds for each of the categories:

This fine-tuning you do as per your companies needs. By clicking on the Visibility symbol, you can hide an aspect from your overview. Like above the Database backup was put to invisible.

Creating your own tactical dashboard

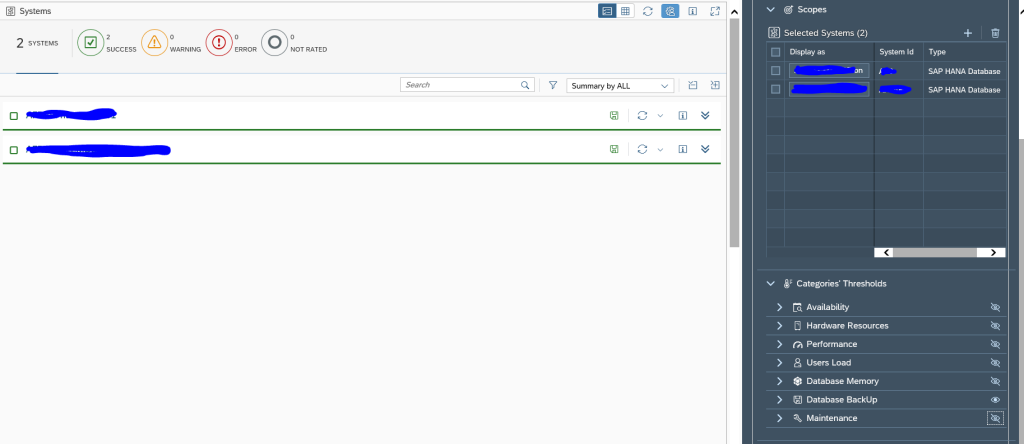
You can create your own tactical dashboard for your own specific needs. We will take the example here to make a dedicated dashboard for the backups. Since we want to check daily in the overview if the backups were successful.

Start by clicking top left on the big + symbol to add a new dashboard:

The personalization view screen will open:

Important here are a few things. Set the tick box Public if you want to share this dashboard. Find the keyword for the right SAP icon (use the SAP icons link and read this blog). Rename the dashboard by clicking the Rename button.

Now Save the page. Close the personalization. You are now in the empty screen. Open peronalization again to add the system(s):

Also hide the not needed views. On the left hand side you can immediately see the result updating.

Hint: start with one or two systems only when making a new dashboard. First fine tune what you want to see. When all is ok, add the systems later. If you have a lot of systems, the updating of the left hand screen will be slowing you down.

Don’t forget to save off course.

Using a dashboard created by a different user

If you want to use a dashboard created by a different user, go to the personalization option and select the add page option:

Now you can select any created dashboard, which has been set to public.

If you don’t see the correct dashboard, check with the owner that he made it public.