Activating RUM (Real User Monitoring)…

This blog will explain the technical activation of RUM (real user monitoring) in SAP Focused Run.

Basic activation as function

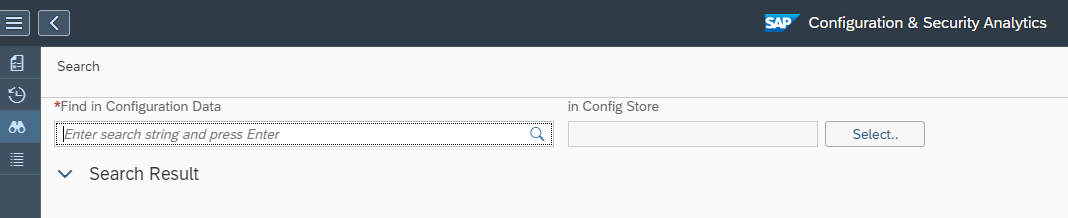
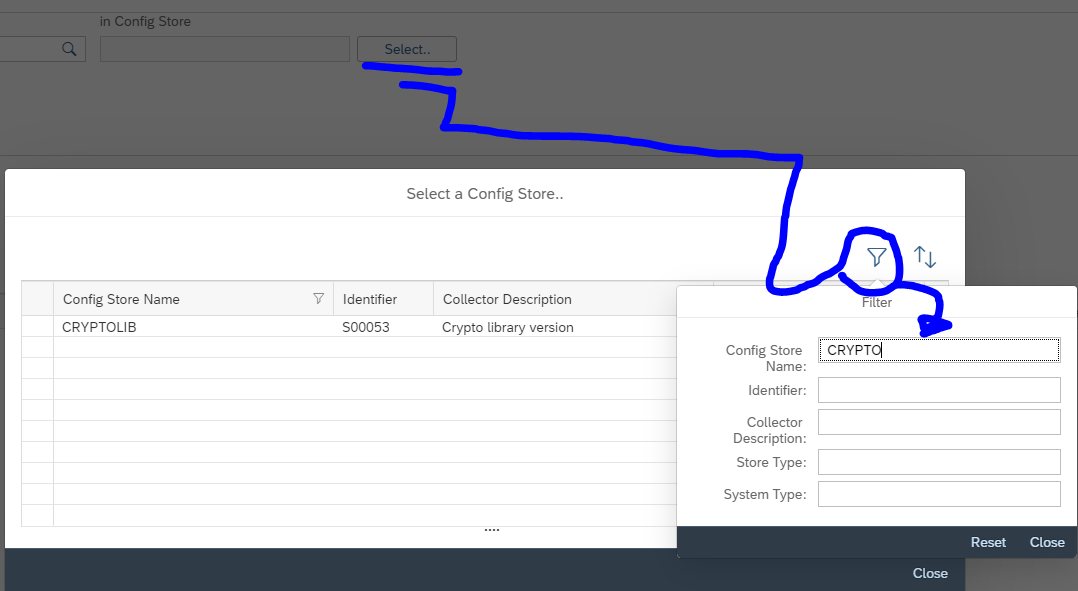
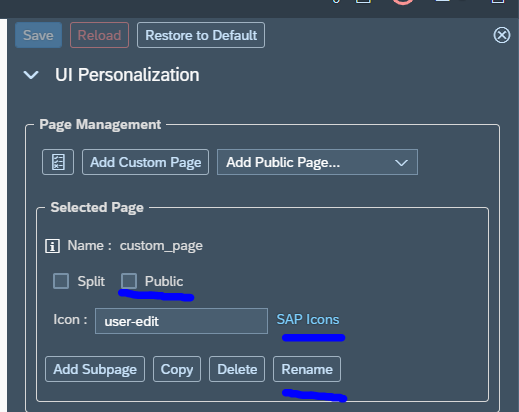
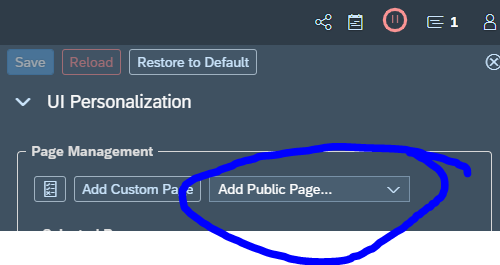
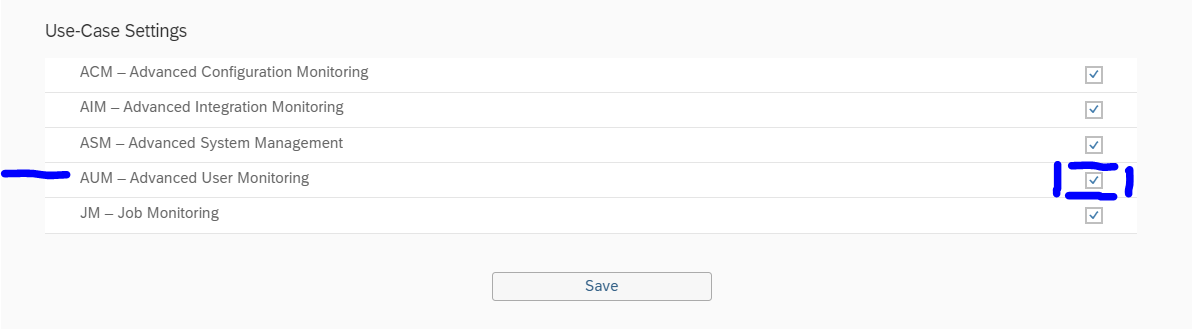
First go to the FIORI settings tile:

If the RUM function is not active yet, activate it and Save:

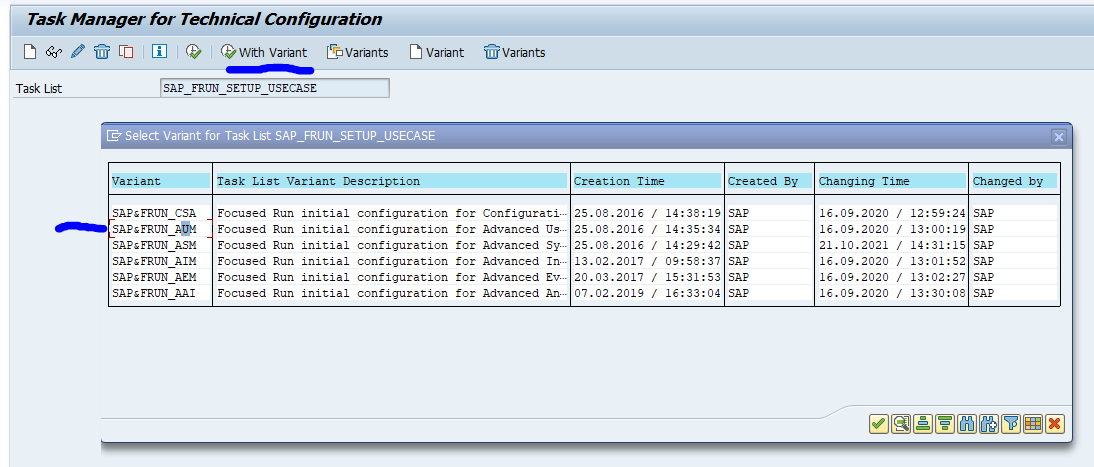
Now go to the FRUN backend ABAP system and start transaction STC01 and select task list SAP_FRUN_SETUP_USECASE and variant SAP&FRUN_AUM (advanced user monitoring):

In the task list setup also select the batch jobs:

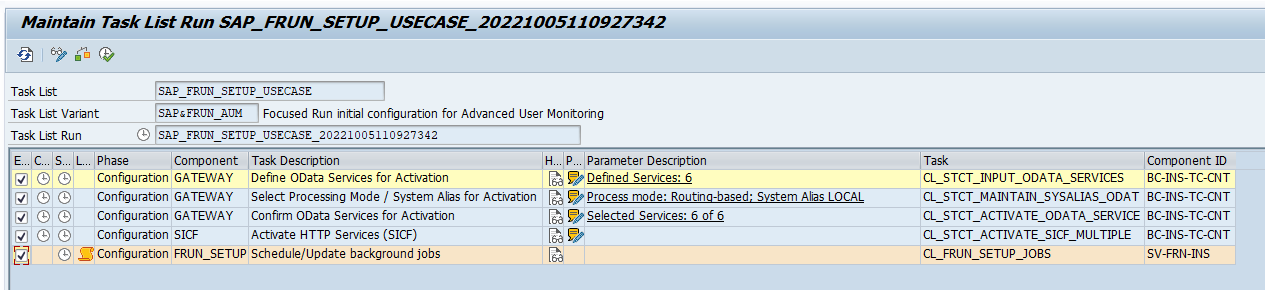
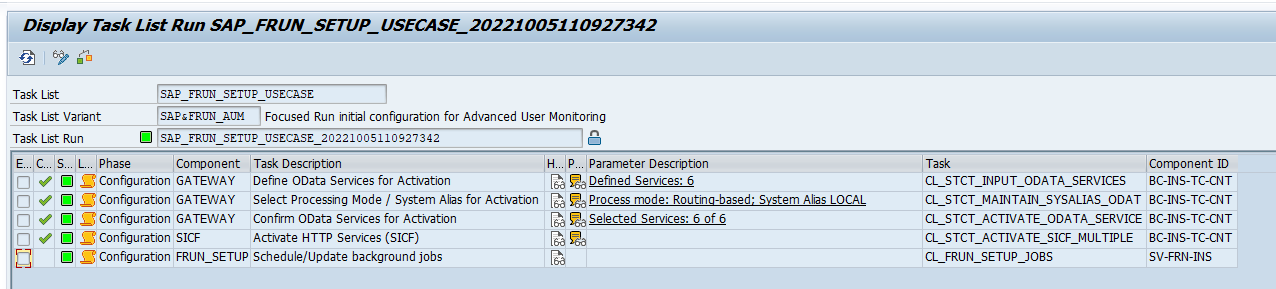
Now run the task list. This should not take longer than 1 minute. Result green is ok:

Technical activation of RUM per managed system

Per system for which you want to activate the RUM function proceed as follows:

Go to the SSI FIORI tile:

Select the system:

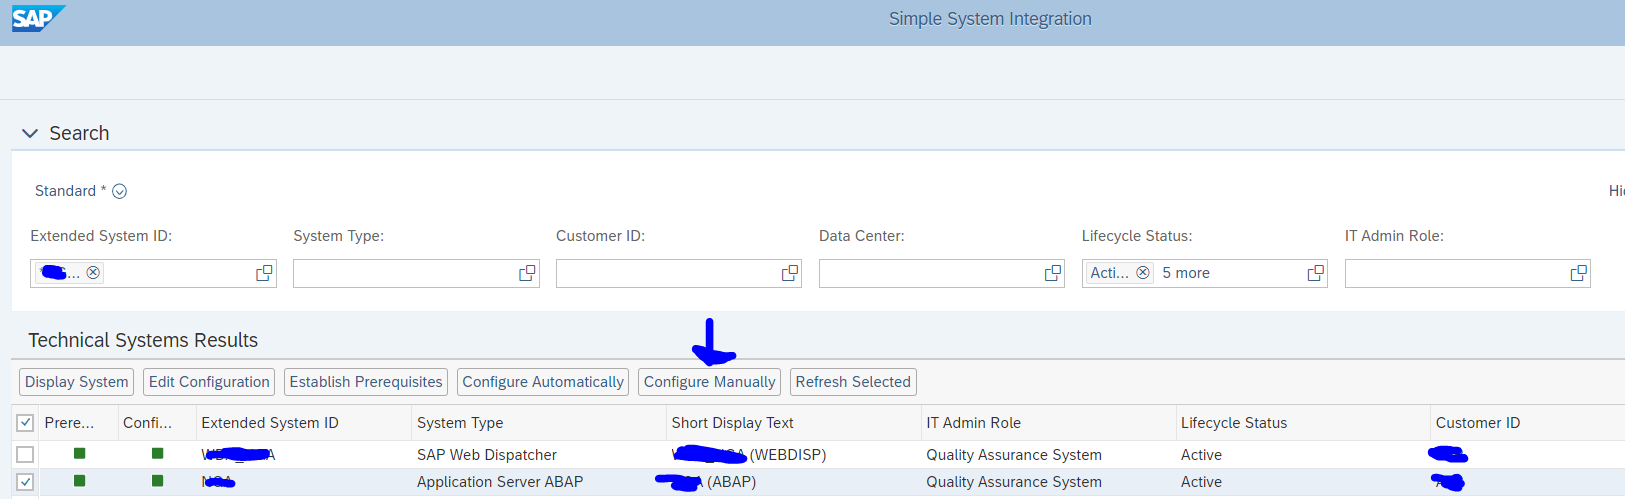
Now press the Configure manually button and new screen opens:

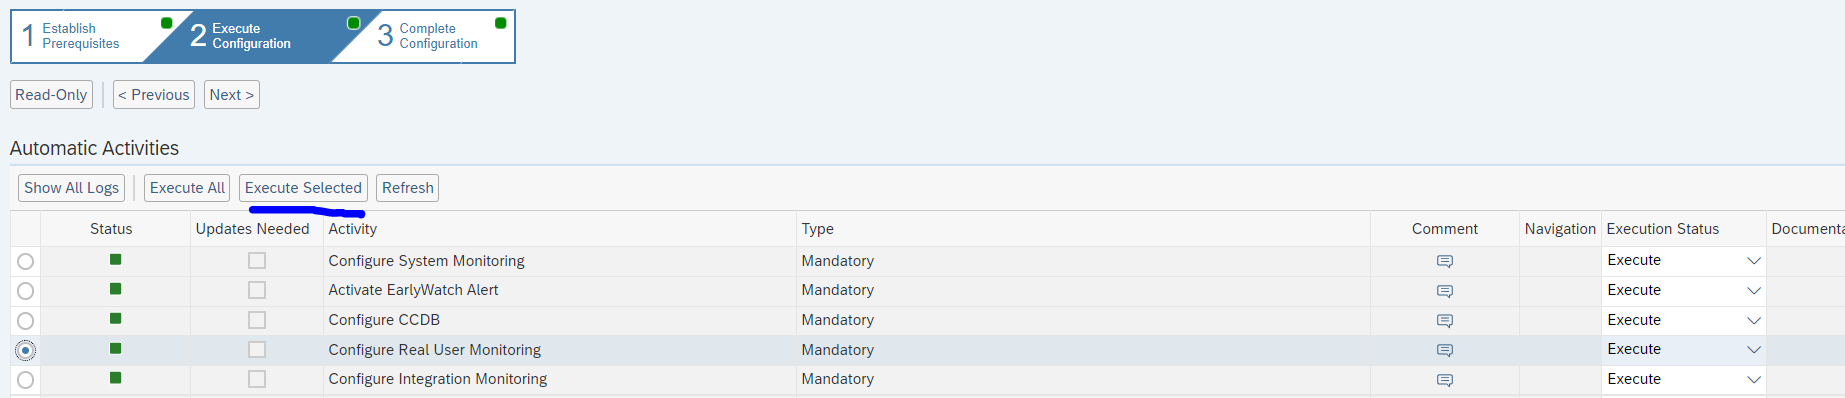
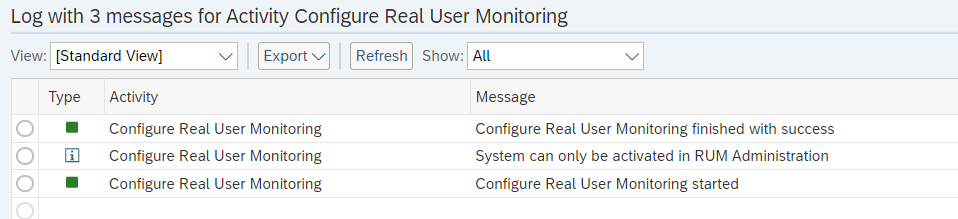
On top first select Step 2 for Execute configuration. And select the Configure Real user monitoring step. Press the Execute Selected button and wait for the log to show success:

Alternatively you can also do the SSI completely new on the first screen by selecting the Configure Automatically button.

Background: RUM is an intense function. If it is not active, the agent does not have to do anything. The re-do of the SSI is needed to tell the agent on the system to start sending RUM data once it is activated in FRUN configuration.

With this step the managed system is prepared.

Functionality activation of RUM per managed system

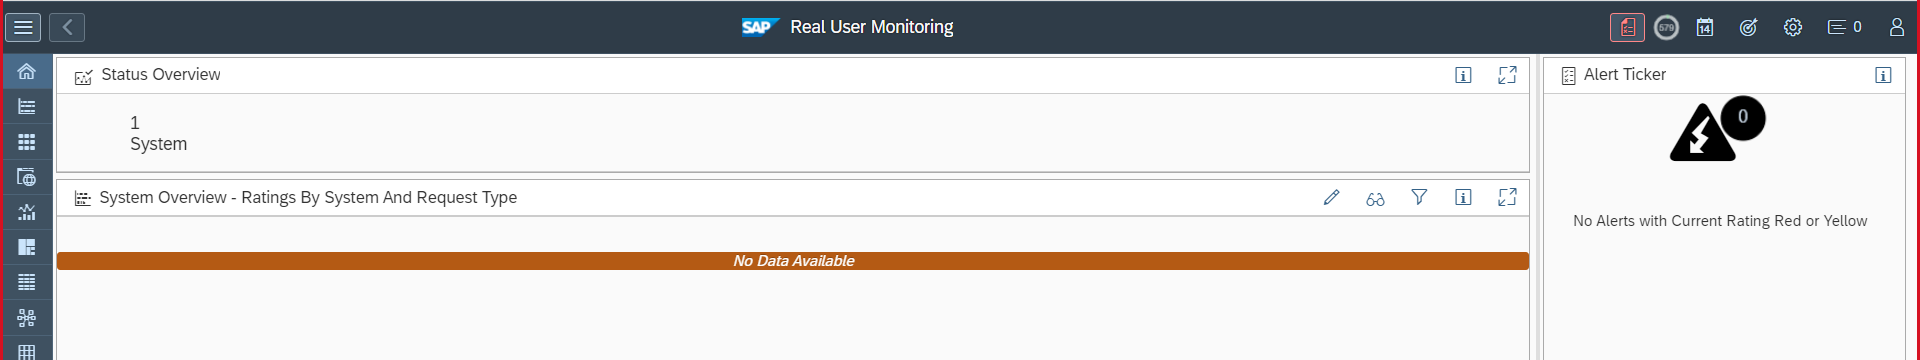
Now we can go to the RUM FIORI tile:

After scope selection nothing is active yet:

On top right choose the Configuration button and start with the housekeeping settings:

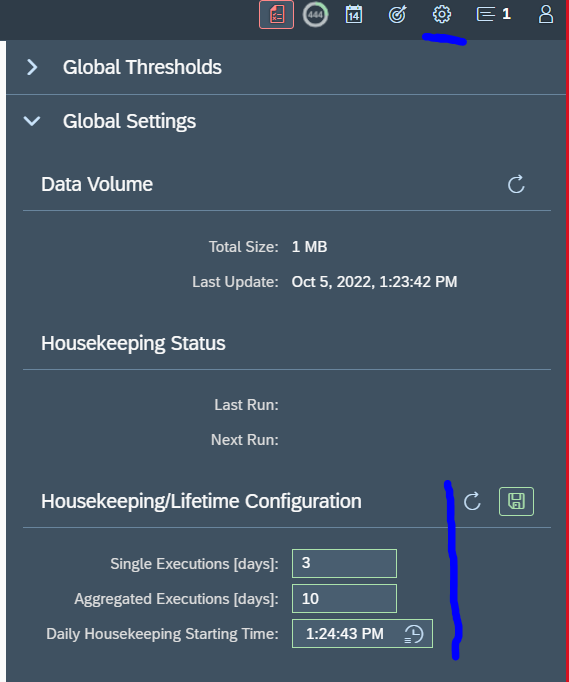
WARNING: RUM can use a lot of data in your database. It can also consume a lot of your Focused Run licensing. If you use too much; reduce amount of systems for which you activate RUM and reduce the retention periods in the screen above. See blog on Focused Run license measurement.

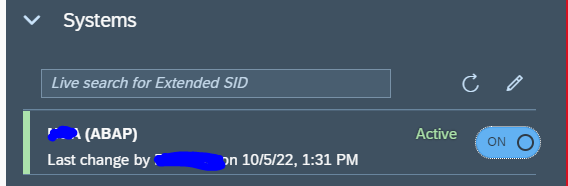
Go to the Systems section and toggle the Activation for the system to On:

Wait for the configuration and data collection to happen. Take 5 to 10 minutes patience for this step.

After the step, refresh the screen and it should look like this:

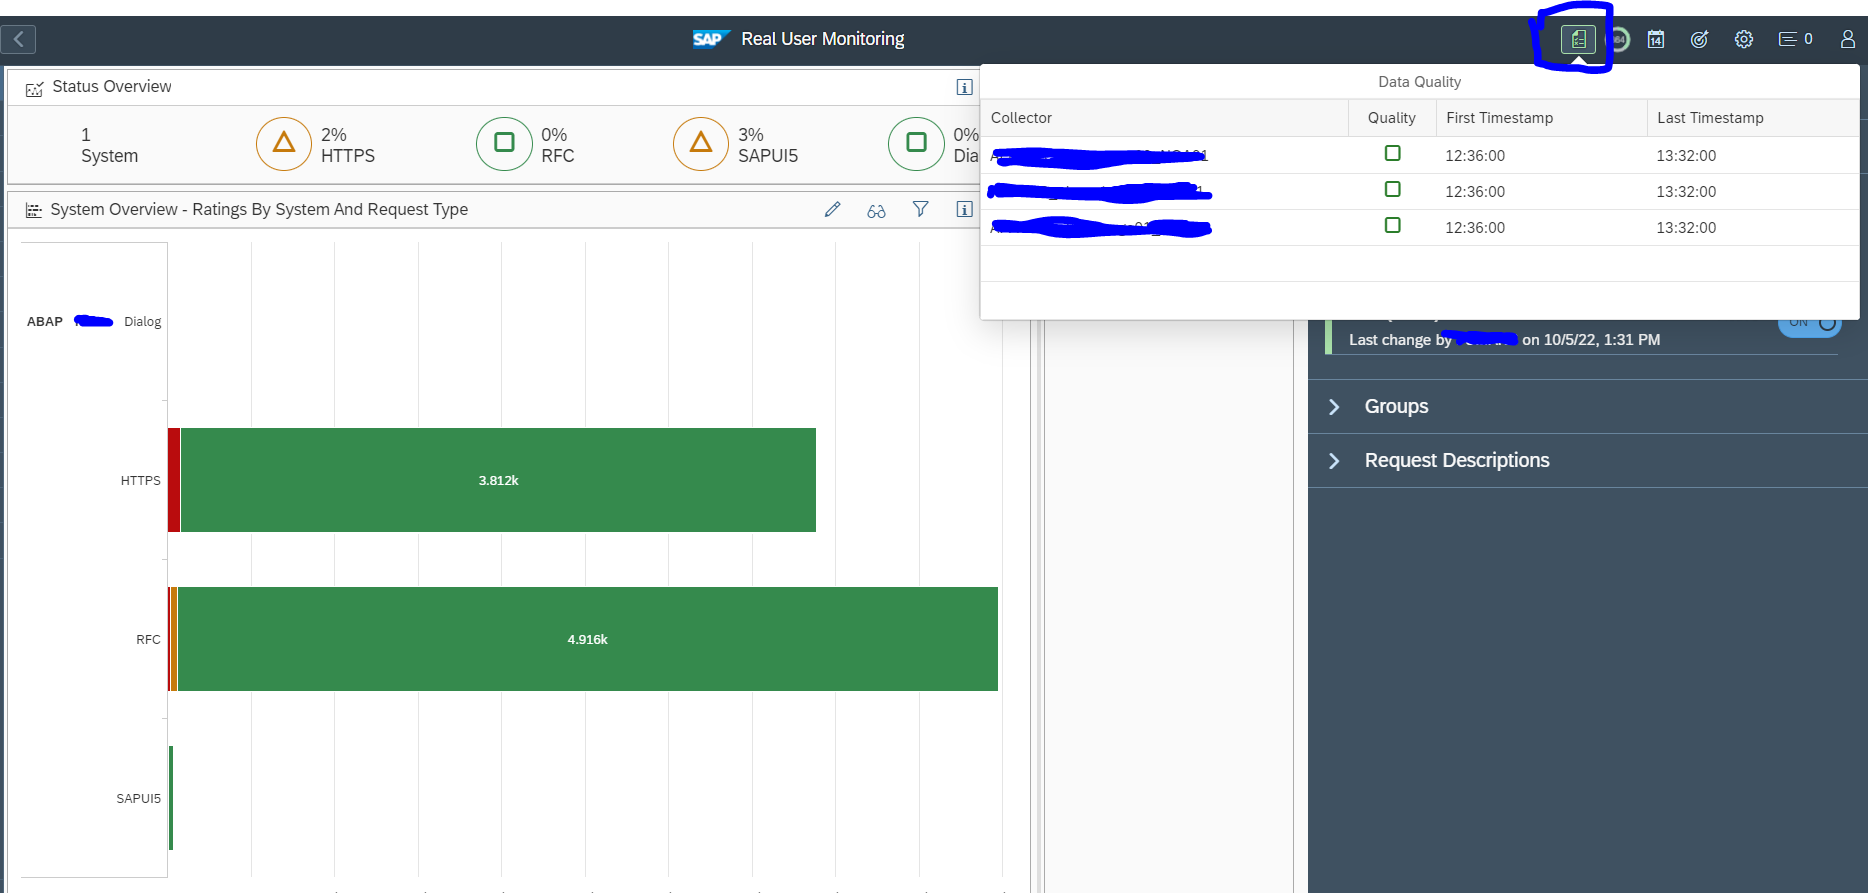
Data should appear on the left. On top, select the icon Data Quality. This shows the data collection status per host. The icon will be red at start and turn green after 30 minutes.

<< This blog was originally posted on SAP Focused Run Guru by Frank Umans. Repost done with permission. >>

Monitoring ECC and S4HANA systems…

This blog will focus on monitoring on ECC and S4HANA systems.

Monitoring productive ECC and S4HANA systems

ECC and S4HANA systems are at the core of each SAP landscape, and most vital to the business.

When monitoring a productive system, you will need to finetune the monitoring templates for:

  • ABAP 7.10 and higher Application template, for the ABAP application
  • ABAP 7.10 and higher Technical instance template, for the ABAP application servers
  • System host template
  • Database template

ABAP application template

Make sure you cover in the ABAP application template the following items:

Availability:

  • Message server HTTP logon
  • System logon check
  • RFC logon check
  • License status
  • Certificates expiry
  • Update status

Performance and system health:

  • Critical number ranges
  • Enqueue lock % filled
  • SICK detection
  • Dumps last hour
  • Update errors last hour
  • Cancelled jobs last hour
  • Long running work processes and jobs (see blog)

Security:

  • Global changeability should be that the system is closed
  • Locking of critical users like SAP* and DDIC (see blog)

Fine tune the metrics so you are alerted on situation where the system is having issues.

ABAP application server template

Make sure you cover in the ABAP application server template the following items:

Availability:

  • Local RFC logon test
  • Local HTTP logon test
  • Local Logon test
  • Message server disconnects (see blog)

Application server performance and health:

  • Amount of critical SM21 messages
  • No more free work processes (see blog)
  • Update response times

You can consider to setup extra custom metrics for the application servers:

System host template

For system host the regular CPU, memory, disc template is sufficient. Finetune the thresholds to your comfort level.

Database template

Important items of the database template:

  • Database availability
  • Database health checks
  • Backup

Functions monitoring

Next to the availability and performance mentioned above, check also for monitoring certain functions:

Technical data clean up in SAP Focused Run…

For the licenses of SAP Focused Run, you do housekeeping. There are also technical tables that might grow fast in SAP Focused Run that will consume memory in your HANA database.

Fast growing table LMDB_P_CHANGELOG

See OSS note 2610122 – Cleaning up the change history in the LMDB: run program RLMDB_CLEAR_CHANGELOG.

Fast growing SISE_LOG table

Run program SISE_LOG_DELETE to clean up SISE_LOG table. See OSS note 2984789 – Scenario F4-help not working for SISE_LOG_DELETE report.

Idoc and PI monitoring data fast growing

If you get too much data for idoc monitoring, apply OSS note 3241688 – Category wise table cleanup report (IDOC, PI). This note delivers program /IMA/TABLE_CLEANUP_REPORT for clean up.

Invalid entries in MAI_UDM_PATHS

If table MAI_UDM_PATHS is getting large, follow the instructions from OSS note 3030652 – Cleanup invalid entries from database table mai_udm_paths to clean up. It is explained in more detail in OSS note 3250729 – Housekeeping for metric paths.

Custom metric to detect if there are no free work processes…

From availability perspective, you want to detect as quickly as possible if you don’t have any free work processes left.

You can create a custom monitoring metric to measure and act on this.

Creation of the custom metric for no free work processes

Create a custom metric following the steps in this blog. The template to be adjusted is the technical instance SAP ABAP 7.10 and higher template.

Don’t forget to tick it on for monitoring otherwise it is not active.

In expert mode create a custom metric.

Create technical name Z_NO_FREE:

In the data collection:

Data to enter: RFC on diagnostics agent (push). Select ABAP System Log Stats. Filter on message number QoG with text *NOWP*.. For more information on system log messages, read this blog.

Define the threshold for alerting:

And assign the metric to the ABAP Resource Shortage alert group:

Custom metric to detect if hardware ID is missing…

From availability perspective, you want to detect as quickly as possible if you are suffering from missing hardware ID.

You can create a custom monitoring metric to measure and act on this.

Creation of the custom metric for missing hardware ID

Create a custom metric following the steps in this blog. The template to be adjusted is the technical instance SAP ABAP 7.10 and higher template.

Don’t forget to tick it on for monitoring otherwise it is not active.

In expert mode create a custom metric.

Create technical name Z_METRIC_MSG_SRV_HW_ID_MISSING:

In the data collection:

Data to enter: RFC on diagnostics agent (push). Select ABAP System Log Stats. Filter on message number Q16. This indicates missing hardware ID. For more information on system log messages, read this blog.

Define the threshold for alerting:

And assign the metric to the ABAP Instance not available alert group, create a custom alert group:

Msg Server hardware ID missingChecks for Syslog message Q16. Threshold Red for 1.

Use configuration analytics to determine Cryptolib versions across your landscape…

SAP Cryptolib is use for diverse security scenarios. In many cases it is simply installed and never updated.

This blog will explain how to use the configuration validation tool to quickly list all Cryptolib versions across your landscape.

Configuration analytics

Open the configuration and security validation FIORI tile:

Top left choose the searching for configuration items icon:

The search screen opens:

Now select the CRYPTOLIB store:

Now press the find button in the Find in configuration data field:

Results show:

Remark: the result is depending on your scope selected. Use the scope selection button to change the scope.

Other use cases

You can use the same method to get other information from the system.

Use the browsing for configuration items view to find what you are looking for:

Configuration validation to check for disablement of webadmin page…

OSS note 2258786 – Potential information disclosure relating to SAP Web Administration Interface is describing the issue that the web administration interface is publicly available if you didn’t configure your system correctly. More background can be found in this blog. This item is misconfigured on a lot of systems. It is present in ABAP, JAVA and web dispatcher.

If you start to fix this item, you want to keep track of the progress, and also in the future you want to check if the setting is done correctly for new systems and after updates, upgrades, etc.

Setting up the configuration validation rule

Go to the security and configuration validation policy tile:

Create a new policy with the following syntax for ABAP:

<configstore name="ABAP_INSTANCE_PAHI">
<checkitem desc="icm/HTTP/admin_0" id="ICM_HTTP_ADMIN">
  <compliant>NAME = 'icm/HTTP/admin_0' and VALUE  like '%ALLOWPUB=FALSE%' </compliant>
  <complianttext/>
  <noncompliant>NAME = 'icm/HTTP/admin_0' and not ( VALUE like '%ALLOWPUB=FALSE%' ) </noncompliant>
  <noncomplianttext/>
</checkitem>
</configstore>

For JAVA and webdispatcher:

<configstore name="DEFAULT.PFL">
<checkitem desc="icm/HTTP/admin_0" id="ICM_HTTP_ADMIN">
      <compliant>TEXT like '%admin_0%' and TEXT  like '%ALLOWPUB=FALSE%' </compliant>
      <complianttext/>
      <noncompliant>TEXT like '%admin_0%' and not ( TEXT like '%ALLOWPUB=FALSE%' ) </noncompliant>
      <noncomplianttext/>
</checkitem>
</configstore>

The rule says: if the subparameter ALLOWPUB is defined with value FALSE it is ok. In all other cases it is not ok.

Running the rule

Now you can run the rule and check if your systems are compliant:

Age of system components…

Your system landscape contains a lot of components. For security and compliance it is important to keep the system in good shape with regards to patches and updates.

SAP Focused Run can help you with the check on the age of your system components;

  1. Tactical dashboard
  2. Configuration validation rule

Tactical dashboard

The first method to check for component age is the use of the tactical dashboard. The highlights are explained in this blog.

Result of the tactical dashboard for components:

In the threshold settings you can fine tune the levels to give warning or red flag:

Remark: this function works for ABAP and JAVA systems. Not for other SAP products.

Configuration validation rule

From the text below or from the github site of Focused Run you can download this policy:

COMPONENT like '%' and VERSION like '%' and SP_REL_DATE != '' and <?xml version="1.0" encoding="utf-8"?>
<!--
Exclude software components for which SP_REL_DATE is empty
Version: 002
Date:    July 16 2021
-->
<targetsystem xmlns:xsi="http://www.w3.org/2001/XMLSchema-instance" desc="Age of component level" id="AGE_COMP" multisql="Yes" version="0000" xsi:schemaLocation="csa_policy.xsd">
  <!-- Basic -->
  <configstore name="COMP_LEVEL">
    <checkitem desc="Age of Component Level - ABAP" id="ABAP.AGE_COMP.01" not_found="ignore" system_attributes="SYSTEM_TYPE:ABAP">
      <compliant>
      COMPONENT like '%' and VERSION like '%' and SP_REL_DATE != '' and (add_days(current_date,-730)) &lt; (CASE WHEN SP_REL_DATE like_regexpr '^\d{8,8}$' THEN SP_REL_DATE WHEN SP_REL_DATE = 'NEWER' THEN CURRENT_DATE ELSE '00000000' END)
      </compliant>
      <noncompliant>
      COMPONENT like '%' and VERSION like '%' and SP_REL_DATE != '' and not (add_days(current_date,-730)) &lt; (CASE WHEN SP_REL_DATE like_regexpr '^\d{8,8}$' THEN SP_REL_DATE WHEN SP_REL_DATE = 'NEWER' THEN CURRENT_DATE ELSE '00000000' END)
      </noncompliant>
    </checkitem>
    <checkitem desc="Age of Component Level - JAVA" id="JAVA.AGE_COMP.01" not_found="ignore" system_attributes="SYSTEM_TYPE:JAVA">
      <compliant>
      COMPONENT like '%' and VERSION like '%' and SP_REL_DATE != ''and (add_days(current_date,-730)) &lt; (CASE WHEN SP_REL_DATE like_regexpr '^\d{8,8}$' THEN SP_REL_DATE WHEN SP_REL_DATE = 'NEWER' THEN CURRENT_DATE ELSE '00000000' END)
      </compliant>
      <noncompliant>
      COMPONENT like '%' and VERSION like '%' and SP_REL_DATE != '' and not (add_days(current_date,-730)) &lt; (CASE WHEN SP_REL_DATE like_regexpr '^\d{8,8}$' THEN SP_REL_DATE WHEN SP_REL_DATE = 'NEWER' THEN CURRENT_DATE ELSE '00000000' END)
      </noncompliant>
    </checkitem>
  </configstore>
</targetsystem>

Use this to set up a new policy called AGE_COMP (for detailed instructions for setting up new policy, see this blog):

By default the rule is taking 730 days. You can adjust the value as per your needs.

Now you can run the query to get an easy overview across the systems:

Don’t be afraid if you have high number in the beginning; most of the cases this is due to HR components being outdated.

Custom metric to check OS signal…

In some cases the OS system will give critical signals to the SAP system that are visible in the ABAP system log. An example is the signal 11.

When this happens, the system is in trouble and you as admin need to check fast to see what is going on to stop the system from full collapse, crash or very poor performance.

You can create a custom monitoring metric to measure and act on this.

Creation of the custom metric for OS signal detection

Create a custom metric following the steps in this blog. The template to be adjusted is the technical instance SAP ABAP 7.10 and higher template.

Don’t forget to tick it on for monitoring otherwise it is not active.

In expert mode create a custom metric.

Create technical name Z_METRIC_OS_SIGNAL_RECEIVED:

In the data collection:

Data to enter: RFC on diagnostics agent (push). Select ABAP System Log Stats. Filter on MSG_ID QoE. This captures severe errors for OS signals.

Define the threshold for alerting:

And assign the metric to the system message alert group:

OCC dashboards…

OCC dashboards are the most flexible form of dashboarding in SAP Focused Run. It is completely up to you to define any dashboard based on the available data.

The explanation below will give a quick introduction on how to setup a dashboard with as example a line graph with CPU for one system and amount of short dumps per hour for that system in a bar chart.

Set up new dashboard

Start the OCC dashboard FIORI tile:

Click the add a new dashboard icon on the left:

Now open on the right hand side icon the personalization. Here you can change the default 2 by 1 layout if want as well:

Now per gadget, select the personalization. First choose the type of graph, then select the query details:

Add the query by clicking the Plus sign:

Give the legend a name and press the Change query button:

First select the data source. In this example we choose system monitoring. Select next your system, and select the metric (in this case CPU). Don’t forget to save on top of the personalization!

We repeat for the other gadget, but now select short dumps per last hour as example:

Test your dashboard to see if the results are according to your expectation.

Make dashboard public

If you are happy with your dashboard, you can make it public. To do so, go to the personalization options:

Set the selected page to public, select a proper icon, and rename the default user-edit to a proper name and don’t forget to Save.

Other users can now add you dashboard from their UI personalization menu by clicking the Add Public Page and add your dashboard:

Other examples

Examples on this blog site: trend for ABAP short dump.