URL Availability Monitoring in Health Monitoring…

SAP Focused Run Health Monitoring helps us to extend monitoring capabilities to Non SAP world. It provides us with many monitoring functionalities like URL Availability & Performance monitoring, URL Certificate Monitoring, OS Script Monitoring, OS Process Monitoring & Logfile Monitoring . We can activate these monitoring functionalities whether its a SAP or Non SAP application

Health Monitoring provides a functionality called Availability Monitoring wherein we can monitor:

  1. HTTP Availability: Monitoring availability of URLs.
  2. TCP Availability: Monitoring the availability of a TCP port or the availability of a host.
  3. RFC Availability: Monitoring availability of RFCs specifically for measuring availability of an application server instance of an SAP system or the availability of a message server port of an SAP system.

In this blog we will explain how you can configure a HTTP Availability monitor to monitor availability of a URL.

Setup

Step1: Assign Agent for data collection

The HTTP availability is measured by making a URL http or https call by a designated Simple Diagnostic Agent from your specific customer network in the Focused Run system.

The first step is to assign a Simple Diagnostic agent as the collector for this metric.

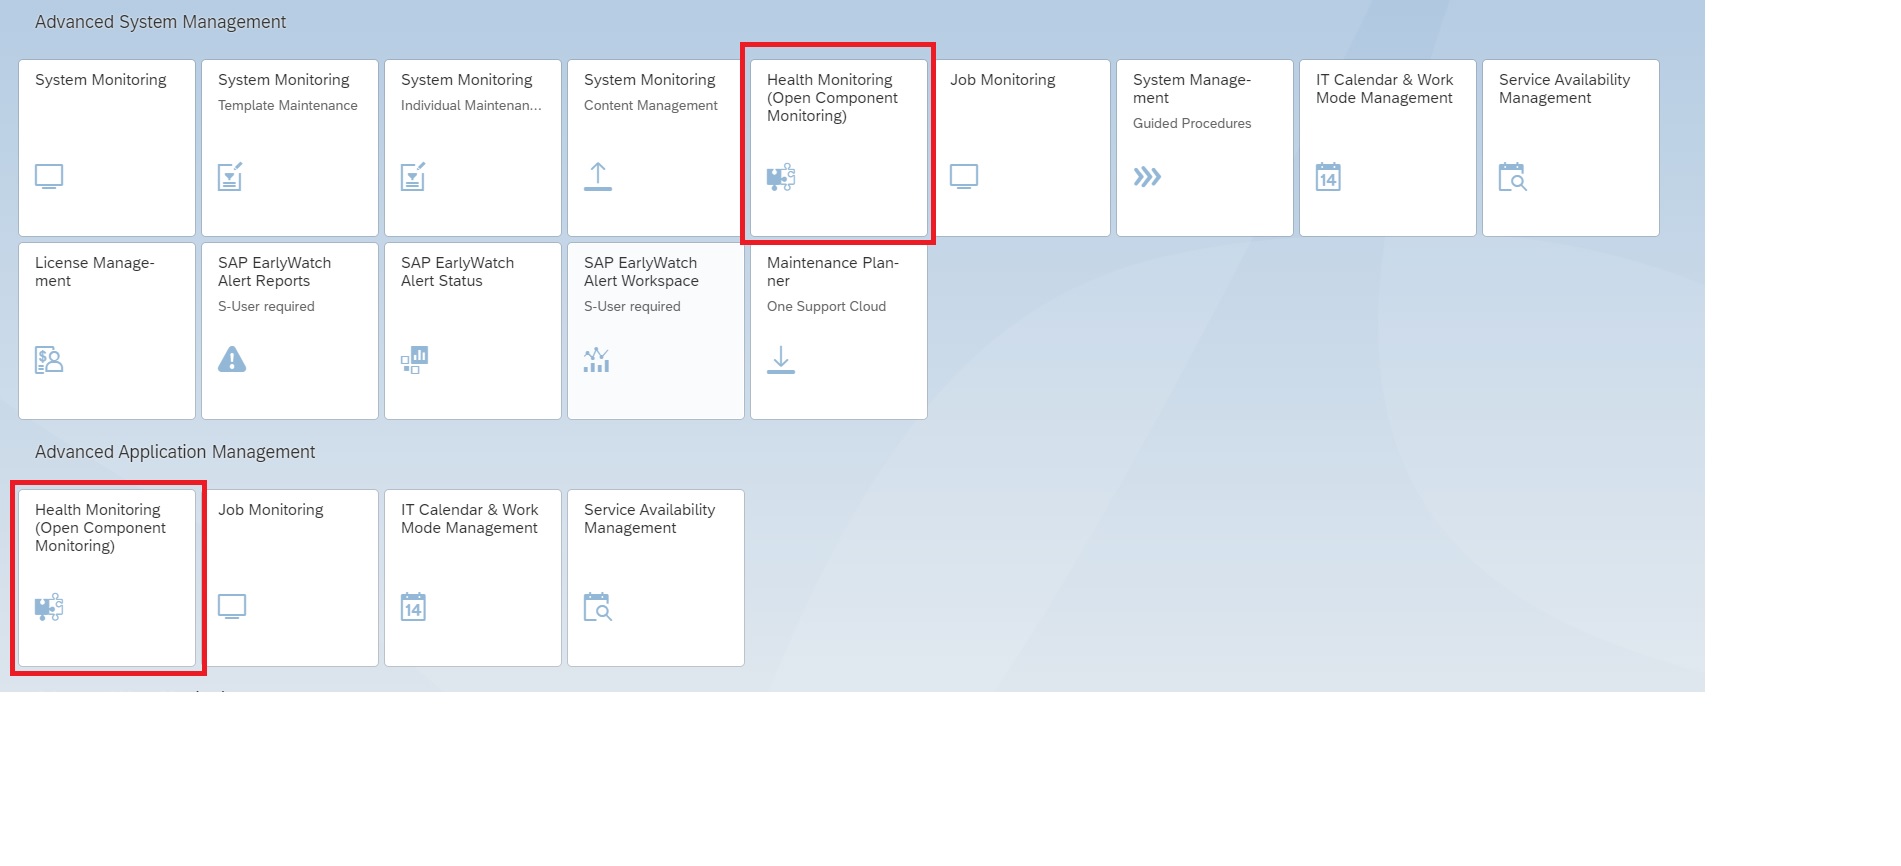
For this open the Health Monitoring App from the Focused Run launchpad.

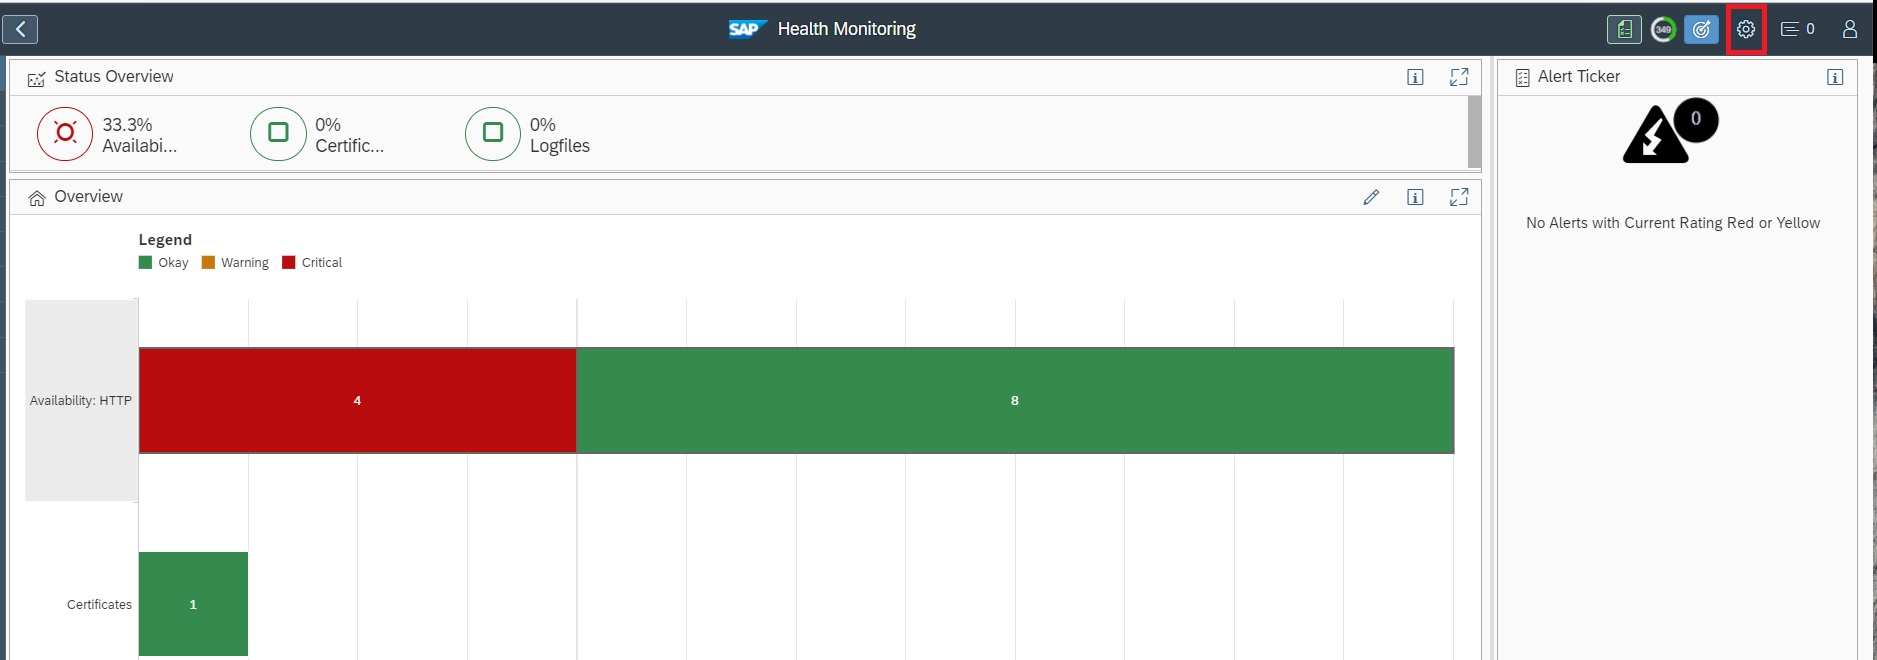
Navigate to Configuration area by clicking on the button.

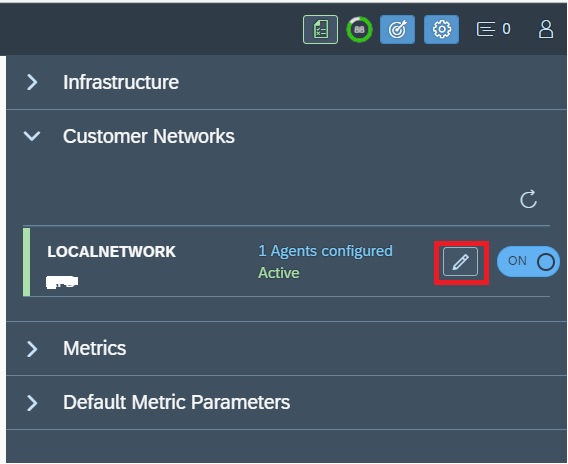
Expand the Customer Networks node and click on the button.

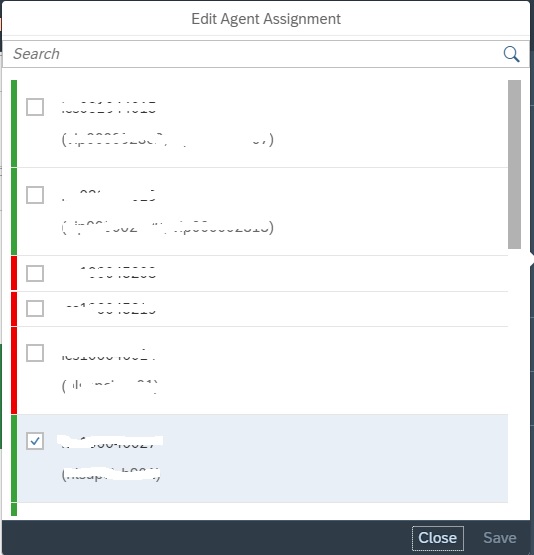
In the next popup select the agent from the list of all connected agents to this customer network.

Step2: Configure HTTP Availability Metric

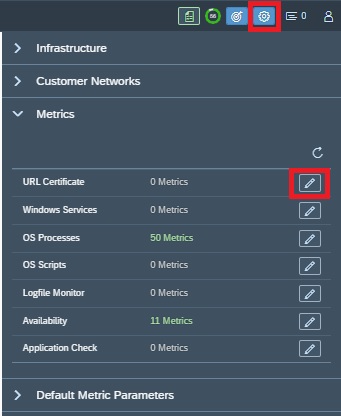
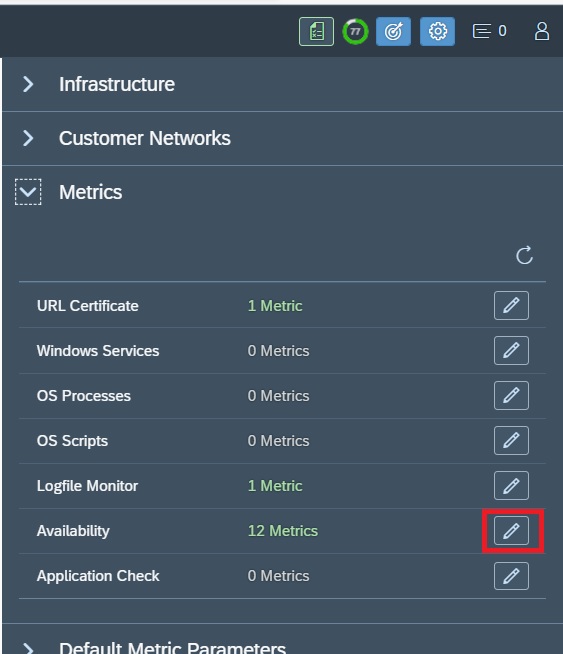
In the Configuration area expand the metric node and click on the button for Availability under Metrics node.
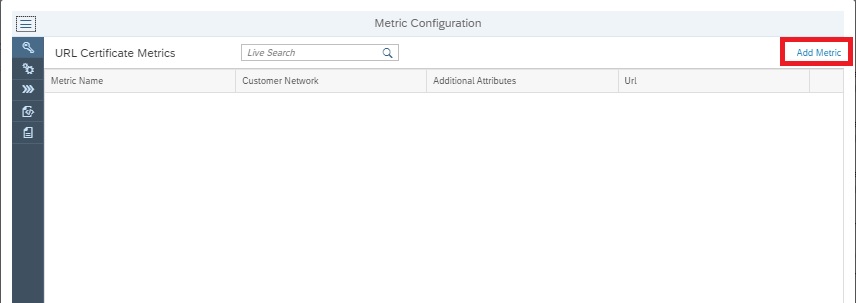
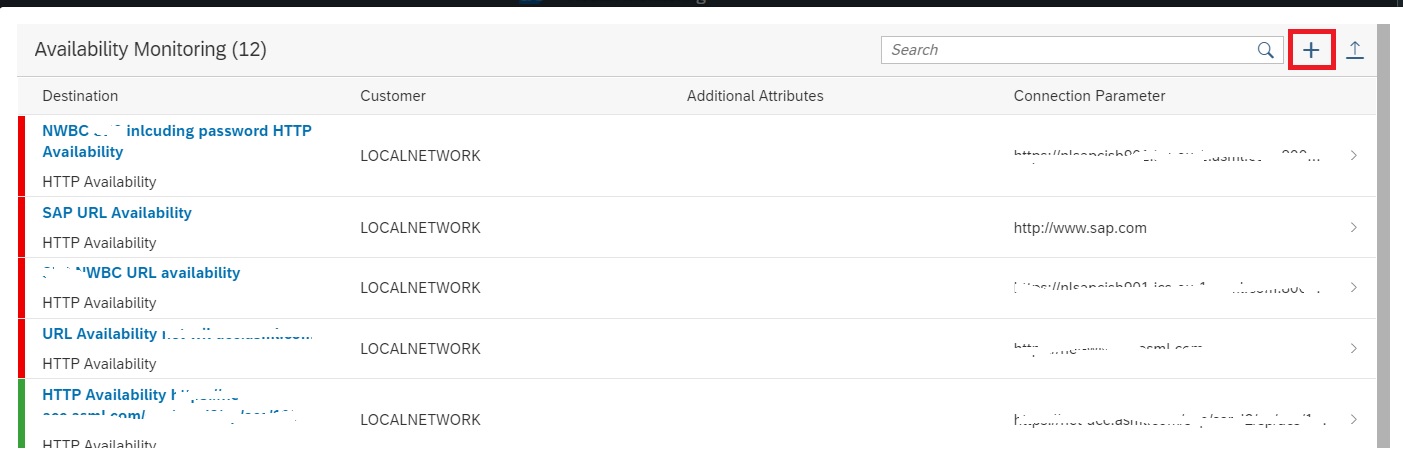
In the next pop-up screen click on the button to add a metric.

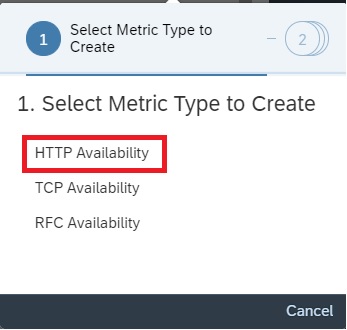
In the next pop-up screen select HTTP Availability

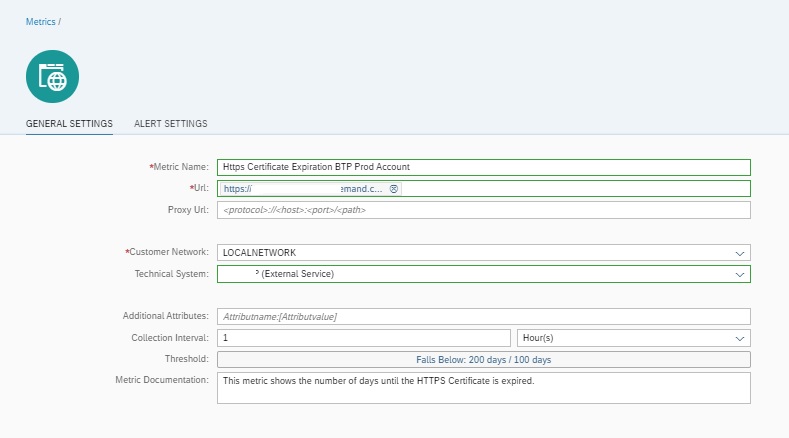
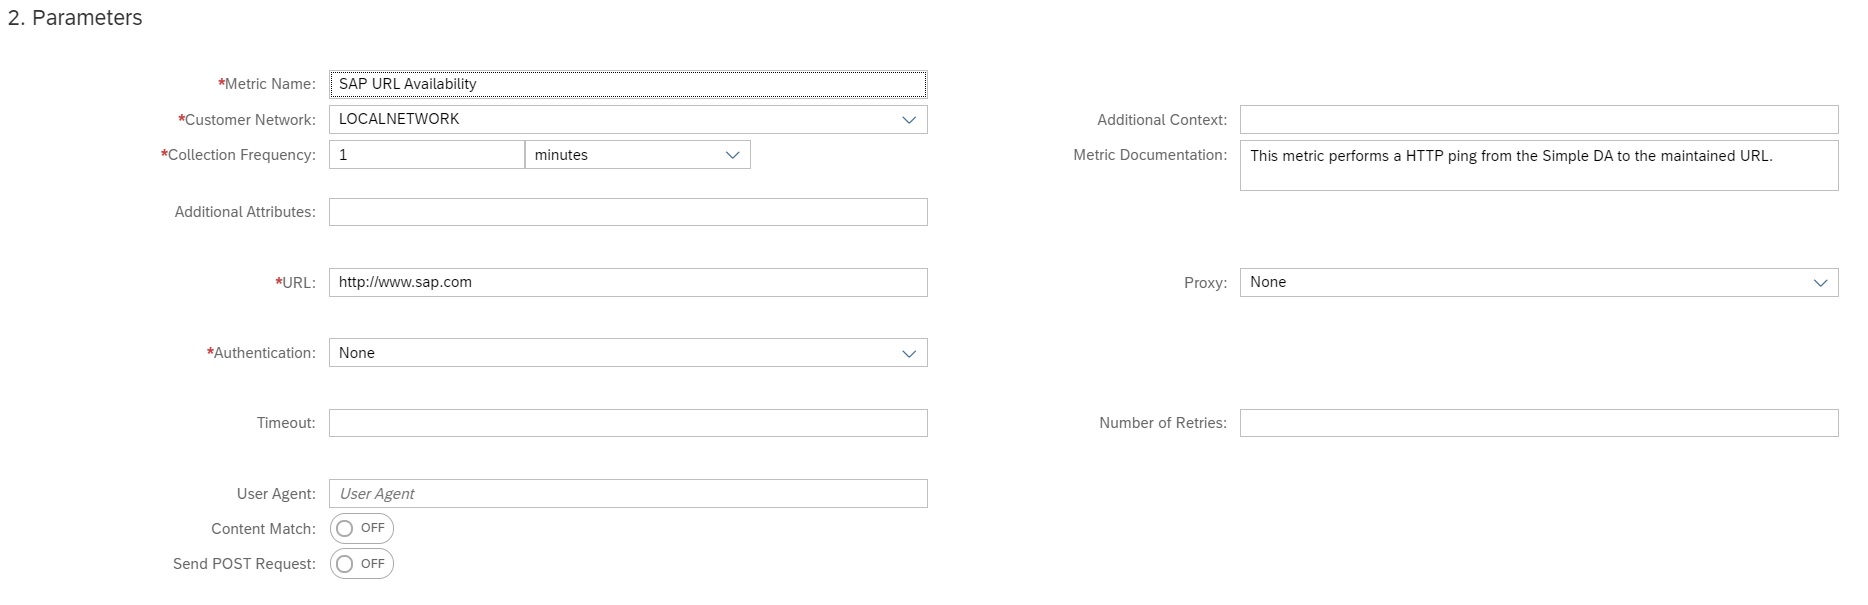
Enter the following details for a basic URL Availability check.

FieldDescription
Metric NameA descriptive name for the metric
Customer NetworkSelect the customer network for which you want to create the metric
Collection FrequencySpecify the collection frequency, how frequently the check should be performed.
URLEnter the URL to be monitored
ProxyEnter the proxy detail if the URL is reached via a proxy from the customer network. Else select None.
AuthenticationEnter the authentication type None or Basic or oAuth and enter the details based on authentication type.
TimeoutPeriod in milliseconds (ms) before a call fails.
Number of RetriesNumber of times the data collector calls a URL until it receives a response.

You can also further customize based on type of call you want to do to the URL for instance sending a POST request. For details you can refer to the SAP documentation here.

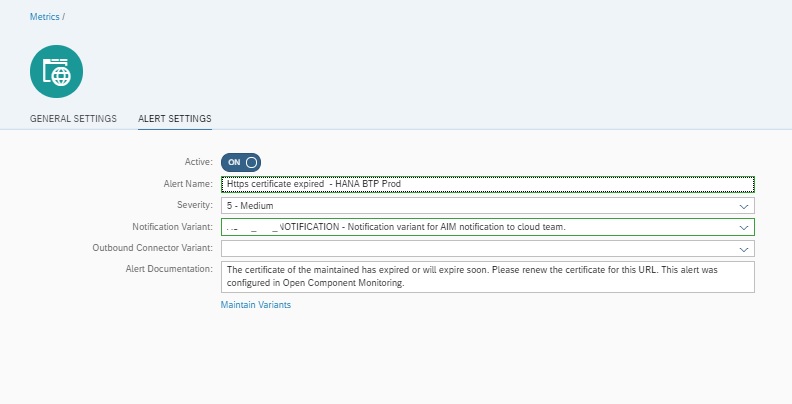
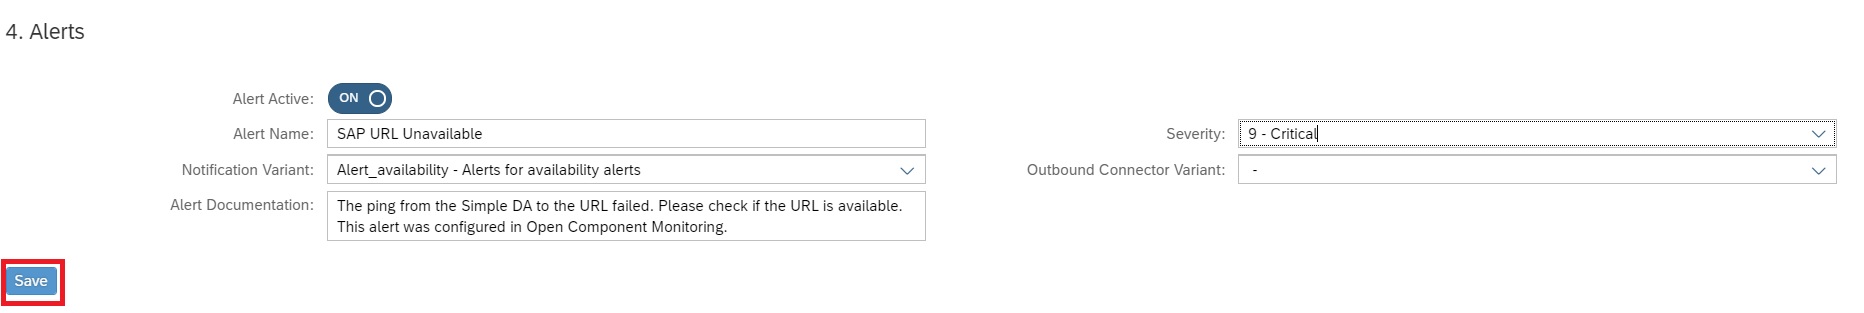
Optionally you can also enable alerting and notification in the Alert section of the configuration.

After entering all the details save your configuration to activate the metric.

Monitoring

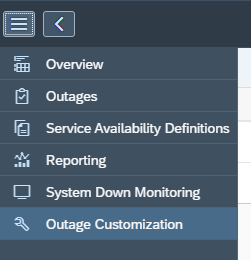
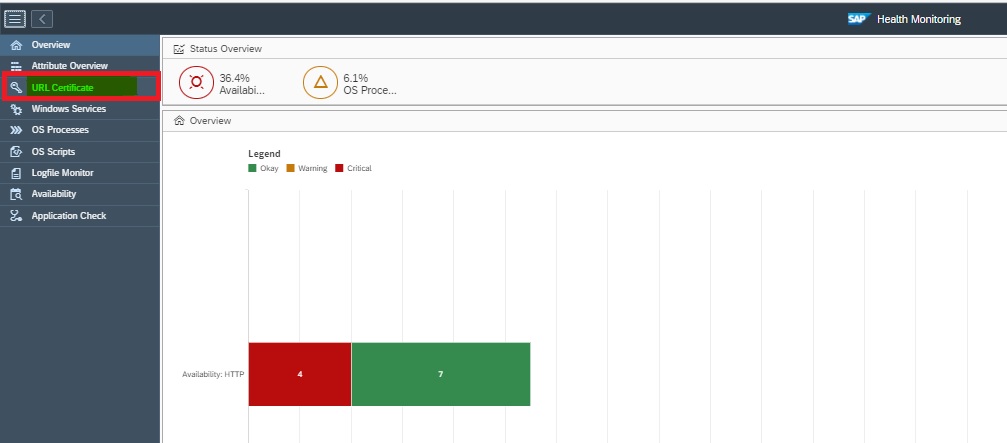
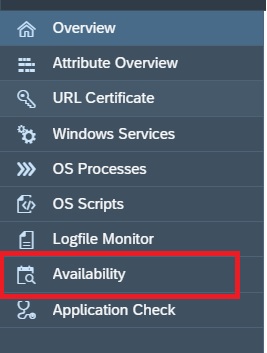
To navigate to the URL availability monitors you can click on the Availability button in the navigation panel.

Or you can also navigate from home screen.

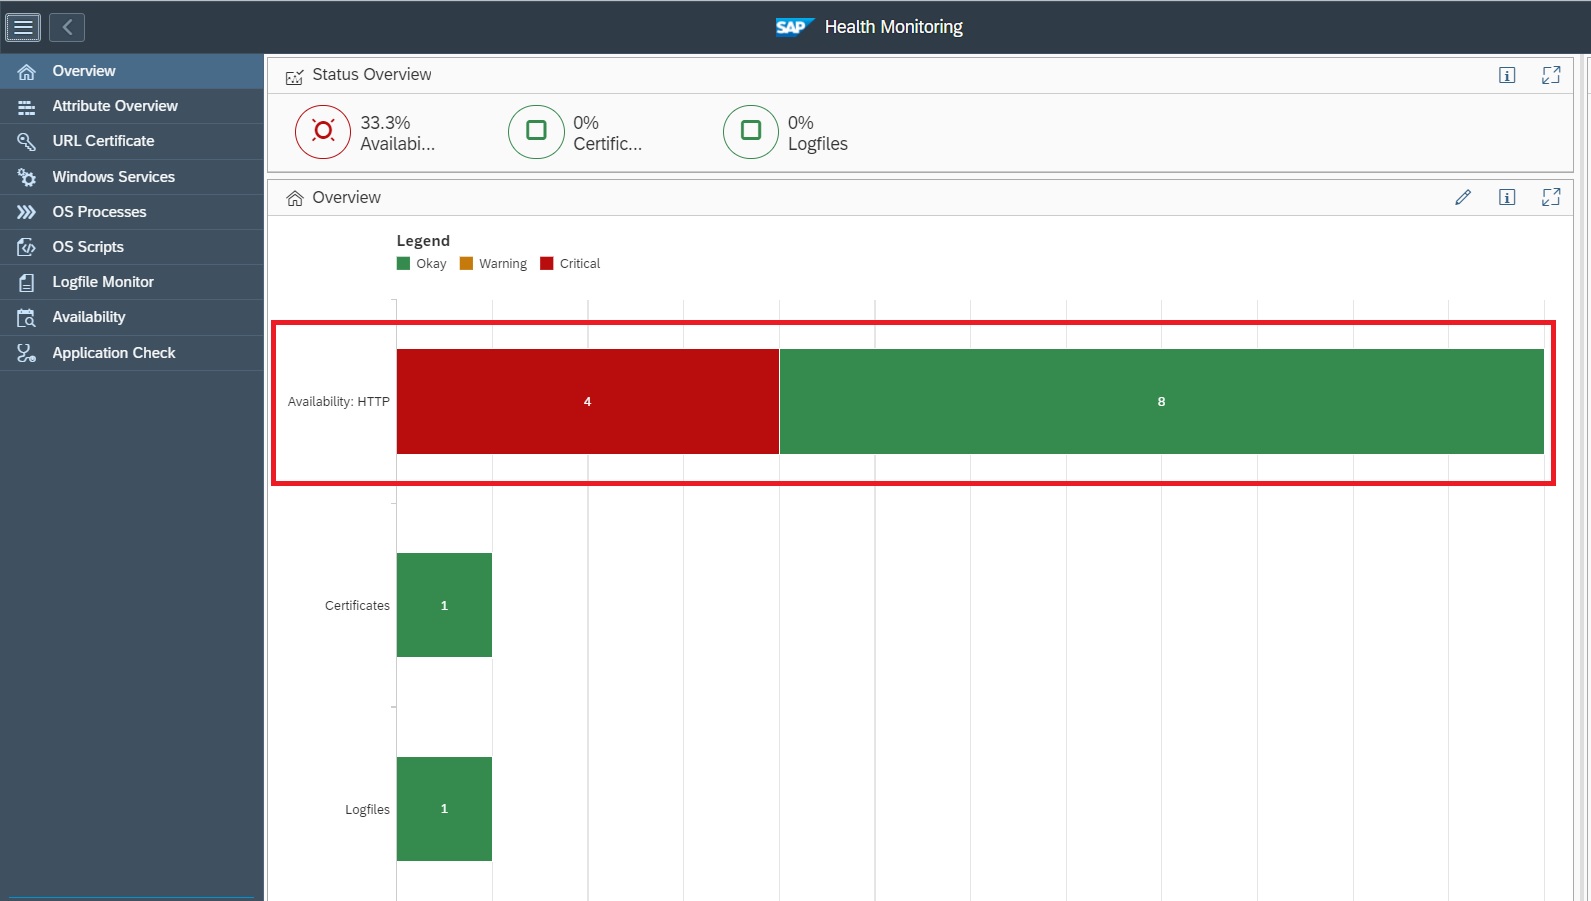
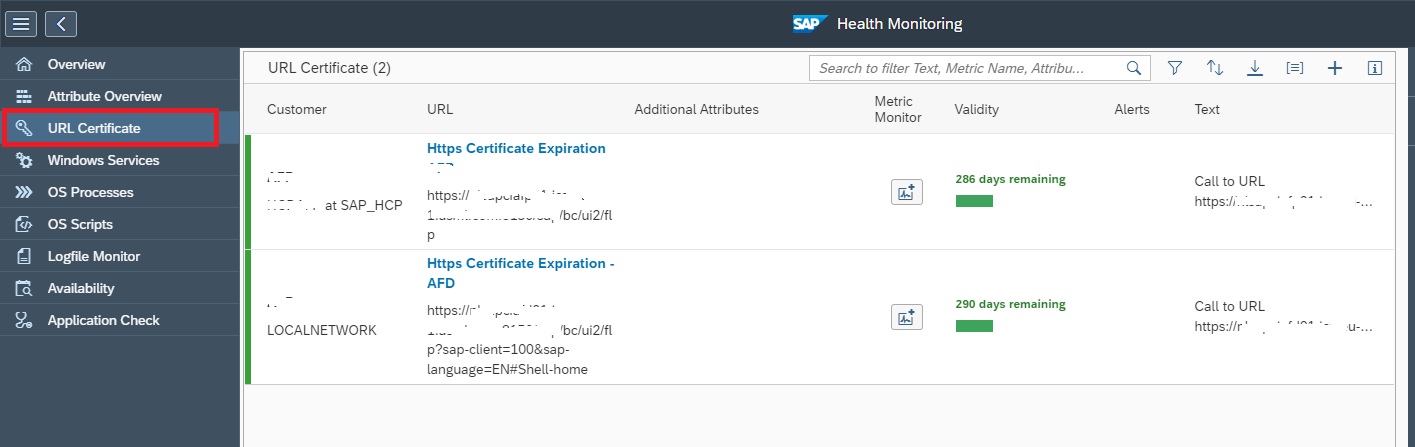
Upon navigating to the Availability monitor metric list you will see the status of all URL availability metrics configured. The metric list view shows us the number of days and hours since the URL is available or unavailable. It also shows us the response time when accessing the URL.

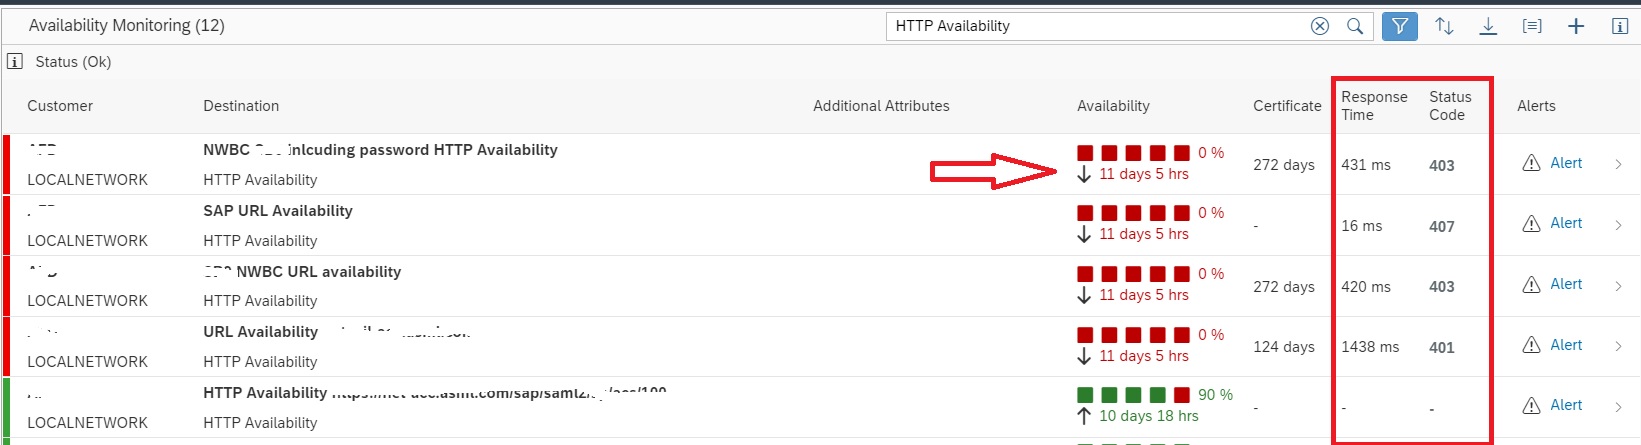
This way you can not only monitor the URL availability but also the performance of an URL with regards to the response time while accessing the URL.

Performance analysis in System Analysis…

In the system analysis function there is a special function to monitor system performance based on ST03 system data from the managed system.

This blog will explain how to setup and use this data.

Performance analysis

Start on the System Analysis tile:

Now choose the menu option for ABAP performance:

The performance overview will now open:

You can click on many items now to get to the details.

Setup of Performance Analysis

Before the above works, the click on the settings wheel and click on the Configure Collection of ABAP performance data:

Make sure the system you need analysis data from is activated correctly.

If the data collection is not ok, check the Collector Status button and Agent logs. Also check the backend system user used to see if this user has sufficient authorization to fetch the required data.

Decommissioning Managed Systems…

We need to perform decommissioning of a managed system if

1. The managed system itself has been decommissioned or

2. The managed system is not required to be monitored in the Focused Run system anymore.

Case 1: Managed System is Decommissioned

Step 1: The first step of decommissioning would be to disconnect the Simple Diagnostic Agent from the Focused Run system. For this you can directly uninstall the Host Agent.

You can uninstall by running the following command at OS level

  • UNIX, IBM i: ./saphostexec -uninstall
  • Windows: saphostexec.exe -uninstall

Step 2: Deactivate all monitoring for managed system in Focused Run system

For this in transaction SA38 execute report RSRSM_SSI_CLEANUP

  1. Select a Customer Network
  2. Go to the Cleanup Technical System tab
  3. Select a Technical System
  4. Select the option to Cleanup unused hosts
  5. Press Delete Selected Objects
Case 2: Managed System is not required to be monitored in the Focused Run System

Step 1: You have to ensure the managed system is no more sending landscape data to the Focused Run system. For this disable all SLD data suppliers for the technical system. (In case of ABAP systems its in transaction RZ70 and in case of Java systems its the Data Supplier settings in the NWA.)

Step 2: Disable outside discovery for all hosts of the technical system by executing the following command.

  • UNIX, IBM i: ./saphostctrl -function ConfigureOutsideDiscovery -disable
  • Windows: saphostctrl.exe -function ConfigureOutsideDiscovery -disable

Step 3: Execute the decommissioning report RSRSM_SSI_CLEANUP as mentioned in step 2 of case 1.

For further details you can refer to SAP documentation here.

In addition to the above two cases, you might need to decommission system if the system is being migrated or upgraded to a different or higher version. For example migrating a standard ECC system to S4HANA. Instead of adjusting the monitoring of existing system, you decommission the system and then reconnect the system to Focused Run system. In our future blog we will explain how to decommission in such cases.

Service Availability Management…

Since SAP Focused Run is measuring availability issues, it can also be used to manage the figures you need for service availability management:

  • Uptime of the system
  • Planned and unplanned downtime of the system

All service availability management functions are present using this FIORI tile:

On the left hand side there is the menu with all options:

Service availability management definitions

There are 2 definitions we need to configure:

  1. The outage customization
  2. Service availability definitions

First we start with the outage customizing:

Make the required settings for planned and unplanned downtime.

Now you add a new service management definition:

Provide a name and validity date for the definition and use the + symbol to add systems for which the definition is relevant.

In the tab availability set the SLA threshold for the availability percentage:

If relevant you can set specific contractual maintenance time in the last tab:

Example of use for this tab: you are running your SAP system hosted on for example AWS or Azure. Those platforms can have scheduled maintenance as well. That is not in your control.

Carefully check your entries and definition before saving. They cannot easily be changed later!

You cannot delete an active definition. To make it inactive you need to change the end date of the definition to today, and then delete it next day.

Each system can only be in one SLA definition!

Classifying the outages

On the Outages overview you can see the outages. The outages can be 0, or there can be open and/or confirmed outages:

Click on the open alert to classify it (click once for the line, click on the line for the details):

Classify the outage (planned/unplanned) and set the status. Fill out the text to clarify. And then save the update.

Outage reporting

There are 2 main reports. The uptime and outage reporting. The uptime reporting shows how long your system is up since the last reported planned or unplanned downtime. This overview is not so useful.

The useful overview is the outage reporting which shows you the downtime per system and per month:

In the example above 1 system had outage, but that was short enough to still meet the SLA target. Availability was 99.64% versus SLA target over 99.5%.

Central SSL Certificate Monitoring in SAP Focused Run…

Purpose

You can configure monitors to monitor the SSL certificate of a URL using Health Monitoring functionality in SAP Focused Run system. This monitor measures the remaining validity (in days) of a SSL certificate for a https call to a URL. The URL is called by Simple Diagnostics Agent of a designated host in your customer network.

In our previous blog, we have shown how you can monitor availability of critical OS processes via Health Monitoring.

The Health Monitoring app also provides a separate section called as URL Certificate Monitor where in you can centrally monitor expiry of SSL certificates of any https URL.

To navigate to URL Certificates monitor you can click on the URL Certificate button as shown below in the navigation panel of the app.

Setup

To configure URL Certificate monitors , navigate to the Configuration area, expand the Metrics node and click on the change button.

In the popup window click on the Add Metric.

In the Metric Configuration window enter the following details in the General tab.

FieldDescription
Metric NameA meaningful name to the monitor
URLURL whose certificate to be monitored.
Proxy URL (Optional)The Proxy URL if the URL is accessible via a proxy URL
Customer NetworkThe Customer Network to which this URL belongs. The designated SDA from this customer network will be performing the check.
Technical System (Optional)You can optionally link this monitor to a specific cloud service you have registered in your LMDB. This is the Cloud Service you would have created if you are using AIM scenario for Cloud Service Monitoring. Select from the drop down.
Collection IntervalFrequency of data collection. Select from available options.
ThresholdThreshold for remaining days for expiry. By default 200 Days for Yellow and 100 days for Red.

Additionally and optionally in the Alert Settings tab you can activate alerting and notification settings as shown below.

That’s it, now your monitor is active. To monitor navigate to the URL Certificate tab in the Health Monitoring App .

You can also refer to this SAP documentation to know more about various features available with Focused Run Health Monitoring.