System monitoring custom metric for user lock status…

From security perspective, you want to validate that 2 important users are locked in the main system clients: SAP* and DDIC.

You can create a custom monitoring metric to measure and act on this.

Creation of the custom metric for user lock status

Create a custom metric following the steps in this blog. The template to be adjusted is the technical system SAP ABAP 7.10 and higher template.

Don’t forget to tick it on for monitoring otherwise it is not active.

In expert mode create a custom metric.

Create technical name ZUSER_LOCK_STATUS:

In the data collection:

Data to enter: RFC diagnostics agent (push). User Lock status Data collector. Enter as parameters the user ID (DDIC) and the COLLECTOR_CONTEXT_ID as TECHNICAL_SYSTEM.

Set the threshold as a text threshold:

Set the red rating in case the string contains the word ‘not locked’ and set to green in case it contains the word ‘locked’.

Now assign it to Alert group for locked users:

Save the metric.

Repeat the same for SAP*.

Cloud monitoring overview…

The integration and cloud monitoring function of SAP Focused Run consists of 2 main functions:

  • Cloud monitoring between on premise and cloud SAP products
  • Interface monitoring between SAP systems (read more on interface monitoring in this blog)

This blog will give an overview of the Cloud monitoring between SAP on premises systems and SAP cloud solutions.

Questions that will be answered in this blog are:

  • How does the Cloud monitoring in SAP Focused Run look like?
  • How much details and history can I see in SAP Focused Run interface monitoring?
  • Can I link an Cloud monitoring event to and alert?
  • Which Cloud monitoring scenarios are supported?

Cloud monitoring

To start the cloud monitoring click on the FIORI tile:

Select the cloud scenarios:

You now reach the scenario overview screen:

Click on the tile for details (we will take Ariba as example):

Click on the red line between the on premise and the cloud system:

Click on the red errors number for the error overview:

Click on specific error:

Supported cloud scenarios

Not all cloud products and scenarios of SAP are supported via SAP Focused Run Cloud monitoring. On the SAP Focused Run Expert Portal the following scenarios are currently published:

Read the scenario details carefully! Inside the details there might be less monitored than you were expecting.

Could monitoring setup

The setup for cloud monitoring is explained in detail per use case:

Interface monitoring: web service monitoring…

The generic interface monitoring setup in SAP Focused Run is explained in this blog. This blog will zoom into monitoring of web services.

Web services monitoring automates the monitoring in transaction SRT_MONI, which is extensively explained in this blog.

This monitoring does not check the connection availability of the web service. To make that happen, you would need to install a custom program from this blog, that writes an entry to SM21. From the SM21 entry, you can create a custom monitoring metric that alerts on the connection issue. How to setup custom metrics is explained in this blog.

Data collection and alerting setup

In the configuration for interface monitoring in the Technical System settings, goto the monitoring part and activate the data collection for Web Service Errors:

In the monitoring settings, you can filter on specific criteria, or leave everything blank to report on everything:

In the alerting part check you can choose between amount of entries and number of error entries:

And set the filters for the alerting:

The filter for monitoring and alerting can be different. It could be you want to monitor all errors, but only activate specific important ones.

Save your monitoring data collection and alerting settings.

Graphical modelling

In the graphical modelling add the filter between two systems for the web service monitoring:

Also here: first scroll down to see the OK button. Press first OK before pressing Save, or you might loose the data and have to re-enter it. This it bit annoying in the UI.

Monitoring usage

The end result looks as follows:

You can click on the errors or success messages and zoom all the way down to individual messages:

SAP reference

SAP reference for web service monitoring can be found here.

Interface monitoring: qRFC monitoring…

The generic interface monitoring setup in SAP Focused Run is explained in this blog. This blog will zoom into monitoring of qRFC connections, which are frequently used in communication from ECC to EWM and SCM systems.

OSS notes for bug fixing

Please make sure bug fix OSS note 3014667 – Wrong parameter for QRFC alerts is applied before starting with qRFC monitoring.

Other OSS notes:

Data collection and alerting setup

In the configuration for interface monitoring in the Technical System settings, goto the monitoring part and activate the data collection for qRFC Errors:

In the monitoring settings, you can filter on specific queues, direction and RFC name, or leave everything blank to report on everything:

In the alerting part check you can choose between age of qRFC entries and number of entries:

And set the filters for which ones, and the metric threshold for CRITICAL errors:

The filter for monitoring and alerting can be different. It could be you want to monitor all errors, but only activate specific important ones.

Save your monitoring data collection and alerting settings.

Queued RFC’s are normally back and forth between 2 systems. If this is the case you have to make the settings for both systems.

Graphical modelling

In the graphical modelling add the filter between two systems for the qRFC monitoring:

Also here: first scroll down to see the OK button. Press first OK before pressing Save, or you might loose the data and have to re-enter it. This it bit annoying in the UI.

Queued RFC’s are normally back and forth between 2 systems. If this is the case you have to make the settings for both systems. You model first one direction and then model the direction back:

Monitoring usage

The end result in operations looks as follows:

You can see here qRFC is modelled back and forth between 2 systems. The blue line indicates messages in process. The red line is clicked on. Here you can see both messages in process and errors. Click on the red error number gives the details:

Interface monitoring: ODATA gateway monitoring…

The generic interface monitoring setup in SAP Focused Run is explained in this blog. This blog will zoom into monitoring of ODATA gateway connections.

We assume in this use case that end users are using the ODATA in FIORI apps. In case ODATA is consumed by external applications like Tibco, Mulesoft, Mendix, etc., you have to replace USER with the corresponding application.

Model end users in LMDB

Before we can start the scenario modelling, we first need to model the end users in LMDB as a Unspecific Standalone Application System), just like we did for TIBCO in this blog.

Name the ‘system’ USER:

Make sure the status is Active.

Add this new system USER to the Technical System list in the Integration Monitoring setup.

The system will be display only.

Data collection and alerting setup

In the configuration for interface monitoring in the Technical System settings, goto the monitoring part and activate the data collection for Gateway Errors:

In the monitoring settings, you can filter on specific items if wanted, or leave everything blank to report on any error:

In the tab alerting setup the alerting:

The filter for monitoring and alerting can be different. It cloud be you want to monitor all errors, but only activate specific important ones.

Save your monitoring data collection and alerting settings.

Graphical modelling

In the graphical modelling add the backend system and the system created for USER:

Now add the link starting with USER towards the backend system:

Save your changes.

Also here: first scroll down to see the OK button. Press first OK before pressing Save, or you might loose the data and have to re-enter it. This it bit annoying in the UI.

Monitoring usage

The end result in operations looks as follows:

In the graphical overview click on the red line. The screen with the exceptions opens. Click on the red number to see the overview:

Here you can see the trends and zoom into the specific errors:

Interface monitoring: RFC monitoring…

The generic interface monitoring setup in SAP Focused Run is explained in this blog. This blog will zoom into monitoring of RFC connections.

RFC’s between SAP systems

RFC’s with fixed user ID

The basic setup of monitoring RFC’s was explained as example for the generic interface monitoring setup in this blog already.

Trusted RFC’s

This RFC was an RFC with a fixed user ID. If you have to setup an RFC monitoring for a trusted RFC (for example between Netweaver Gateway system and ECC system), then you have to take care of the user ID’s and rights. The system from which the SM59 test will run, will use that Focused Run user ID to log on to the other system. If your user ID’s are unique for each system you have to create the user ID in the other systems with the rights to be able to execute a ping and logon for the test.

End result RFC checks

The end results of the RFC is list of RFC’s with the latency time, availability and logon test overview:

Transactional RFC towards external system

To monitor transactional RFC (type T) towards an external system like TIBCO, Mulesoft, etc, you first need to model the external system in the LMDB. To do this goto the LMDB maintenance FIORI app:

Then select Single Customer Network and select the option Technical Systems. In this section choose the Type Unspecific Standalone Application System:

And press Create:

Fill out the details and Save. Make sure the status is Active.

Now the system can be added in the configuration of technical systems in the Interface monitoring configuration:

Now you can model the tRFC interface connection monitoring:

OSS notes

Relevant OSS notes:

Interface monitoring setup…

In the previous blog on Interface Monitoring overview, we have explained the global functions of interface monitoring.

This blog will zoom into the setup parts. We will use a simple scenario to monitor a central user administration system which has RFC connections to the CUA child systems. Basically check that the connection in SM59 is working. More on CUA can be read in this blog.

Questions that will be answered in this blog are:

  • How can I enable my systems for interface monitoring?
  • How do I set up a scenario to monitor?
  • How do I setup alerting for an interface scenario?

Concept

The concept for interface monitoring is unfortunately bit confusing at first.

There are 2 main things to remember:

  1. Systems data collection and alerting: this is where the action happens
  2. Graphical representation: this is where you make it visible

Unfortunately this means you have to do lot of double work.

Set up systems

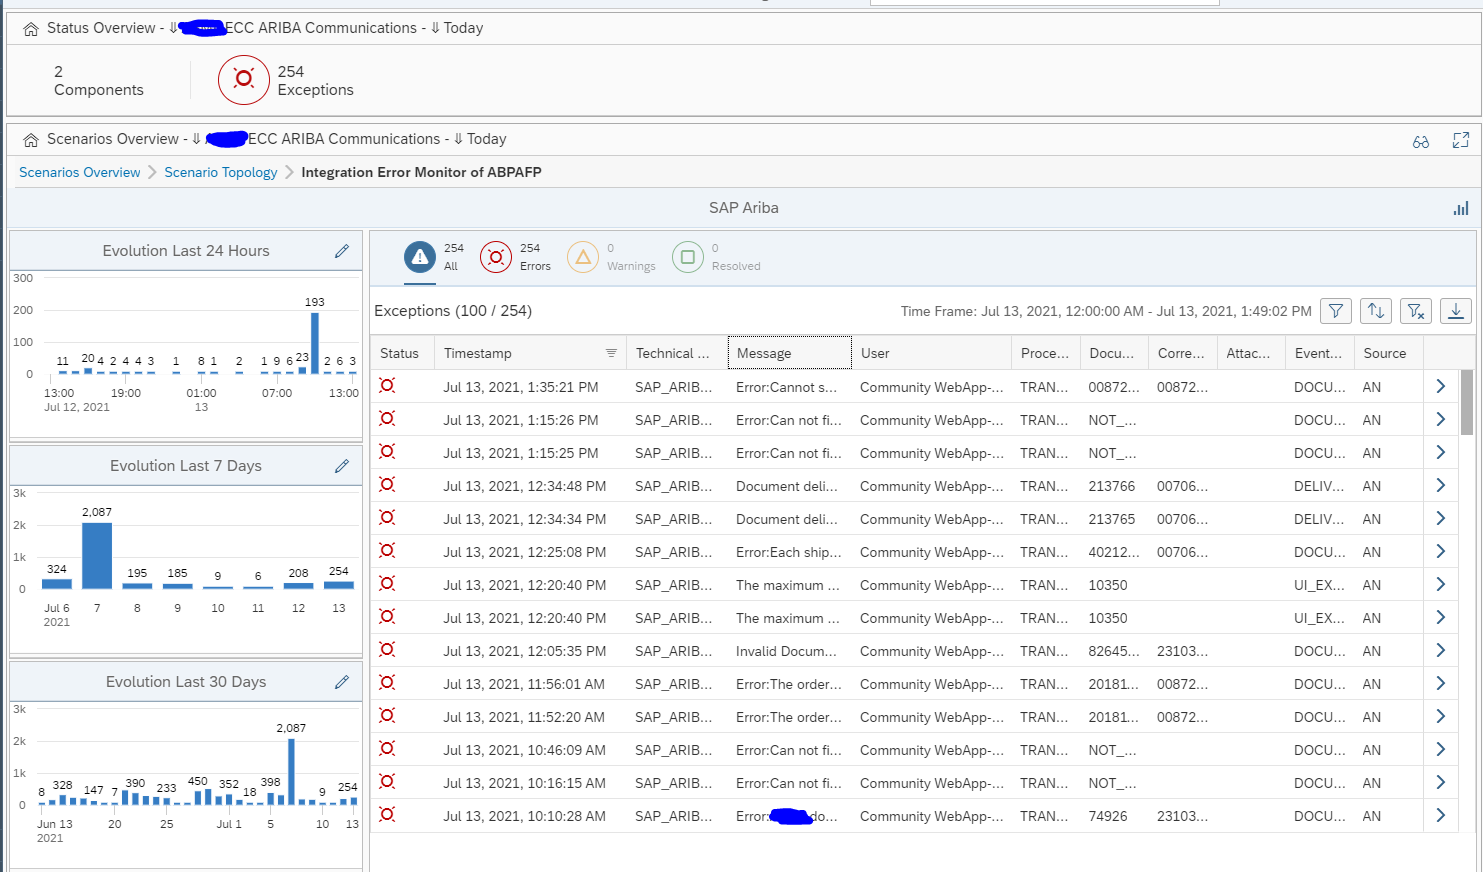
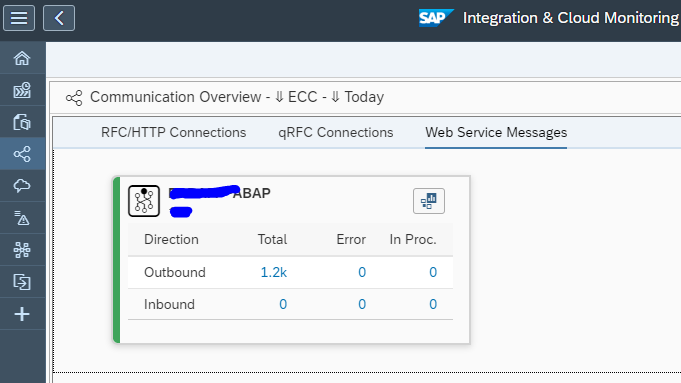
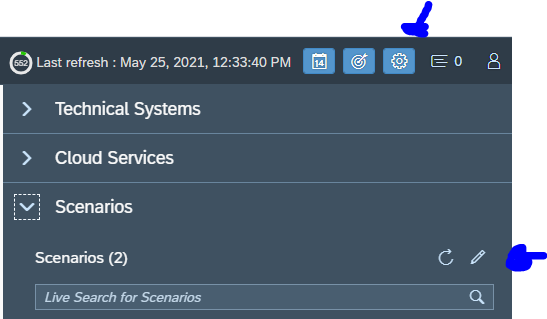
Goto the Integration and cloud monitoring FIORI tile:

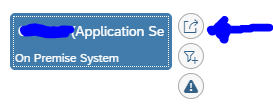
On top right click on the configuration icon to change or add a scenario:

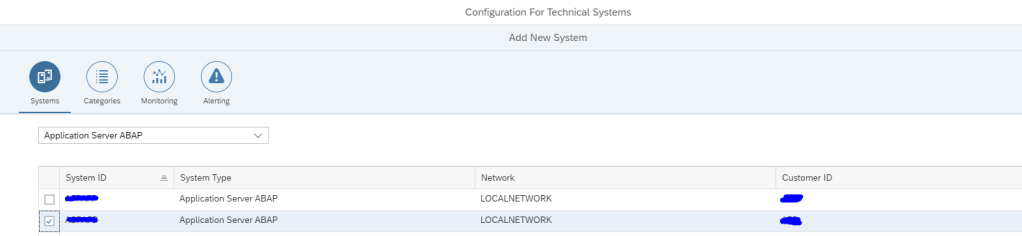
First add the systems:
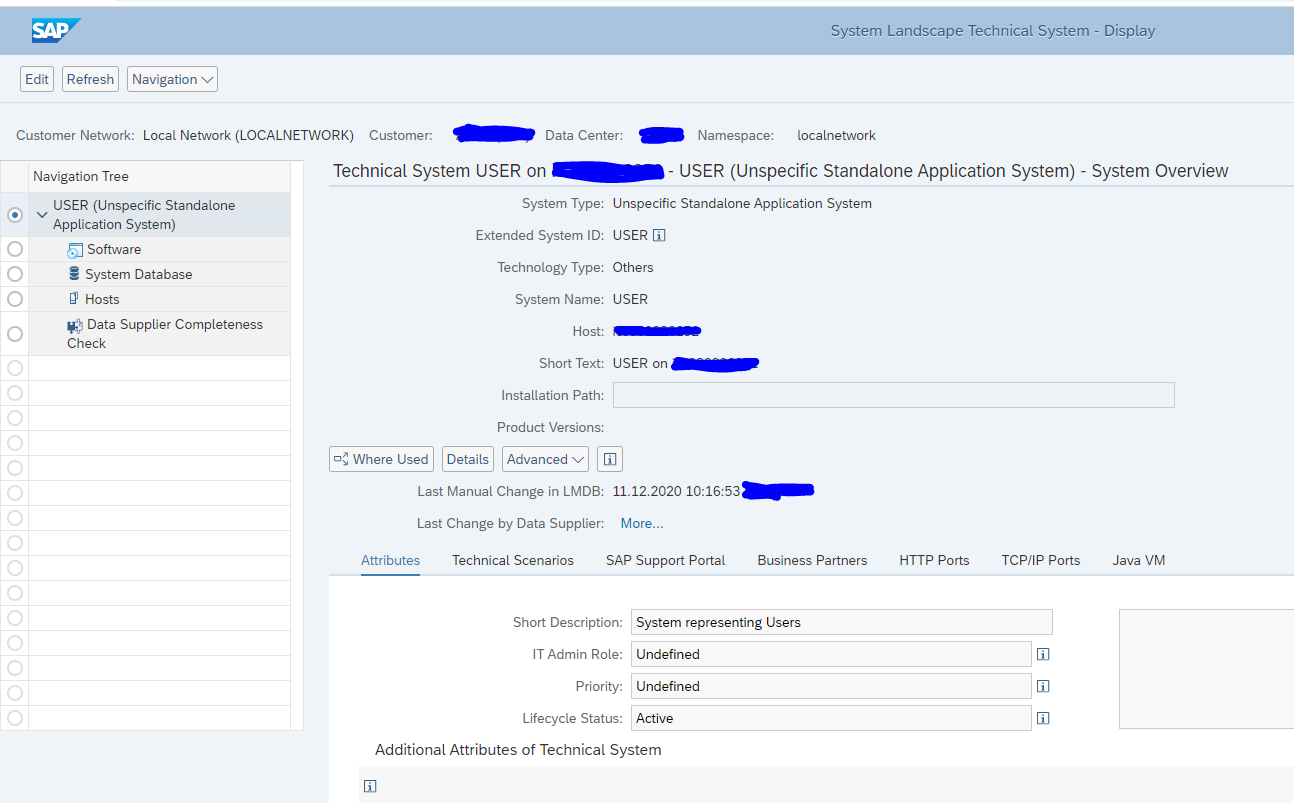
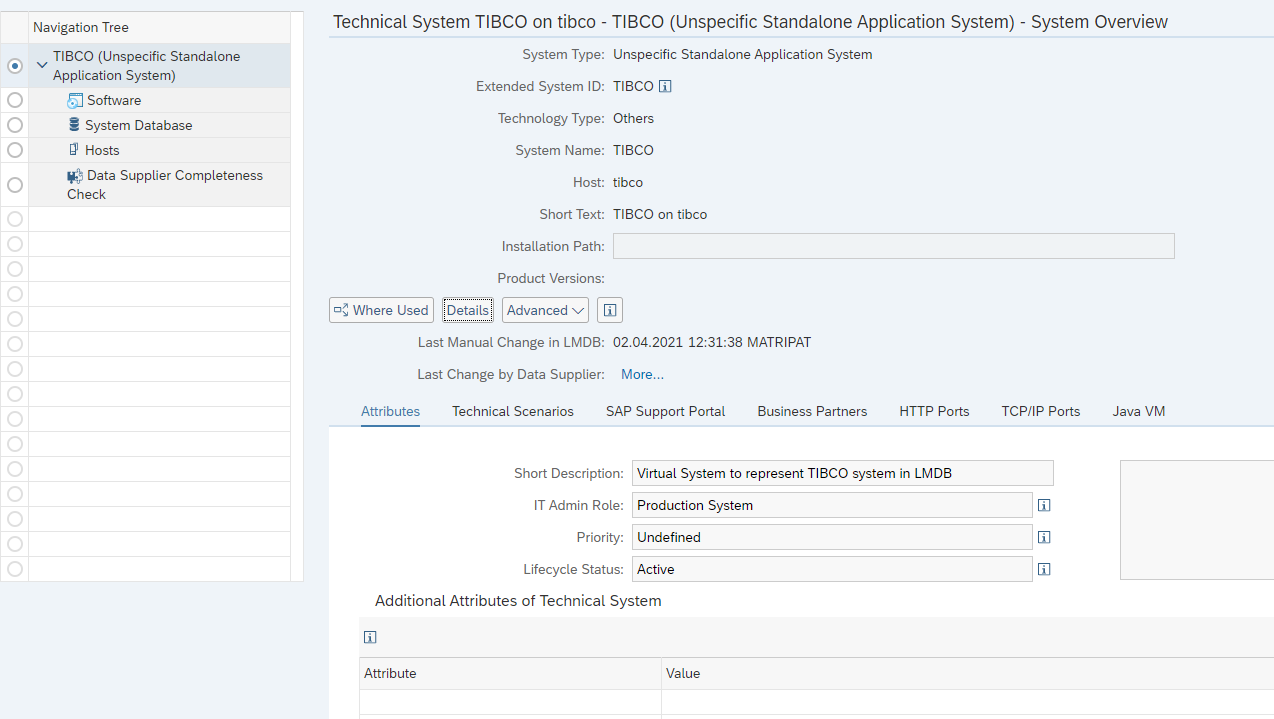
Select the system:

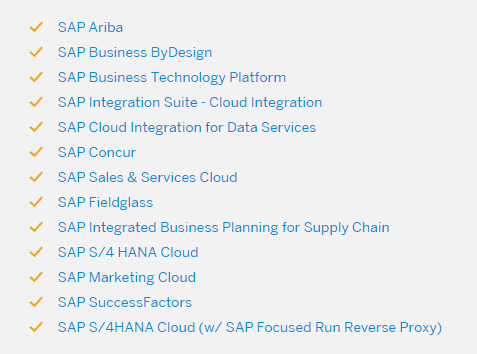
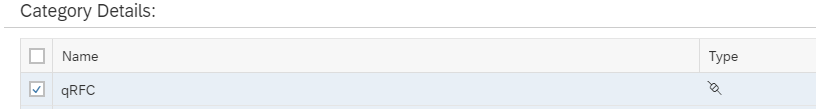
Select the configuration categories:

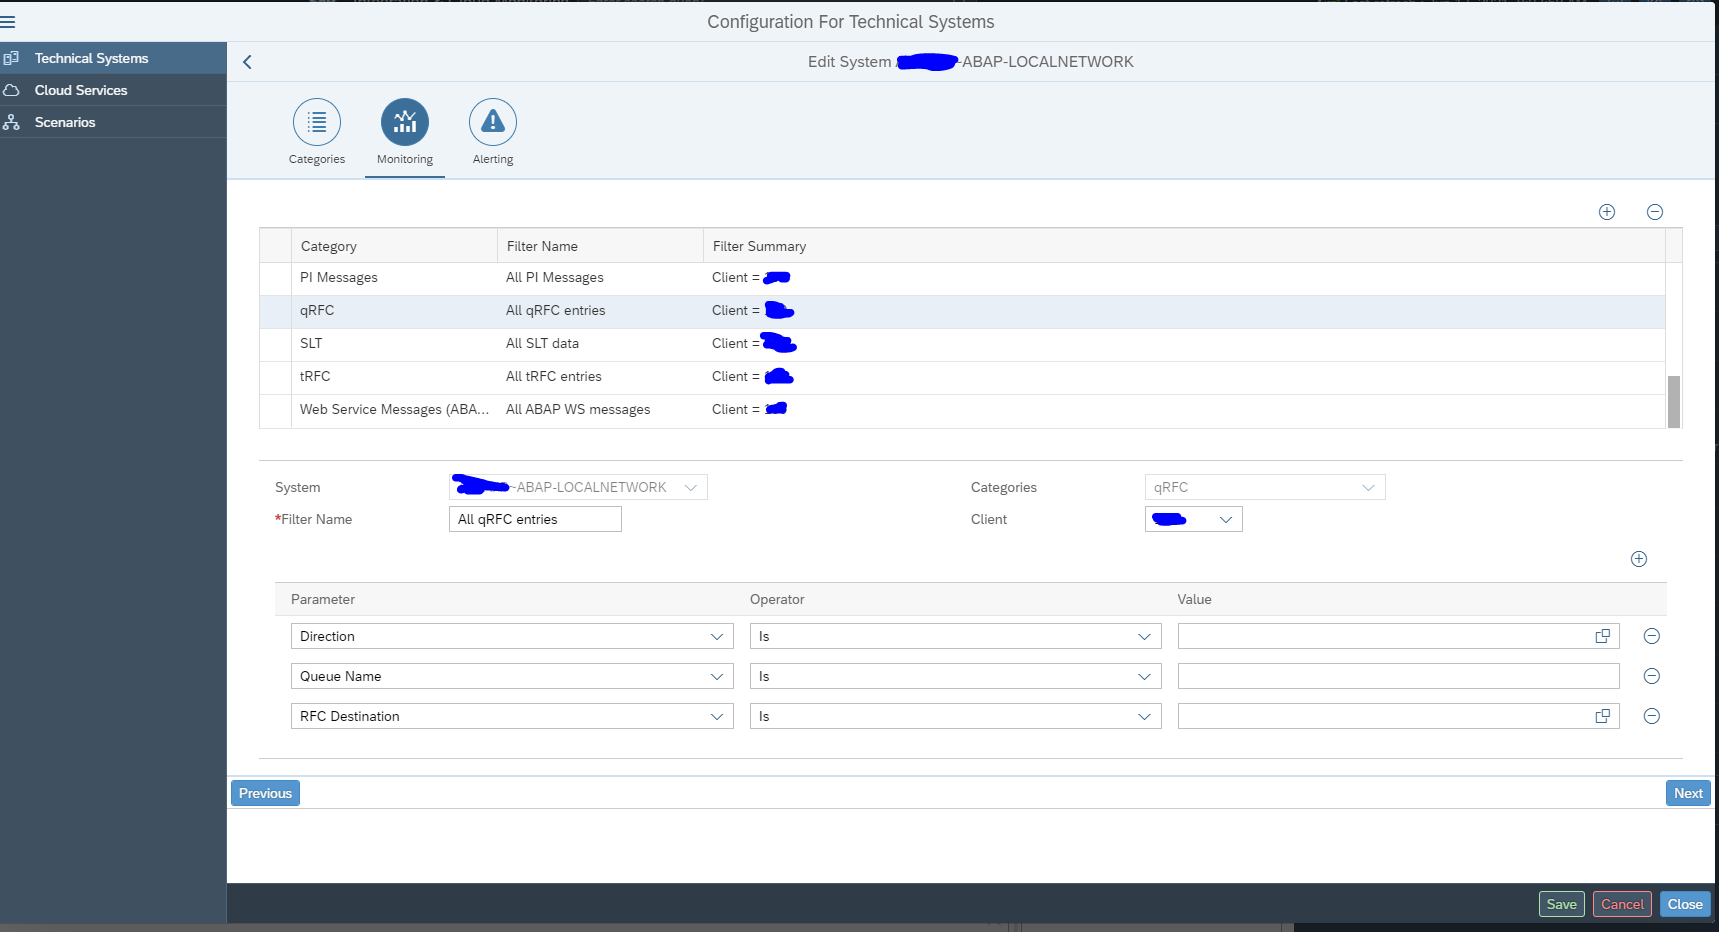
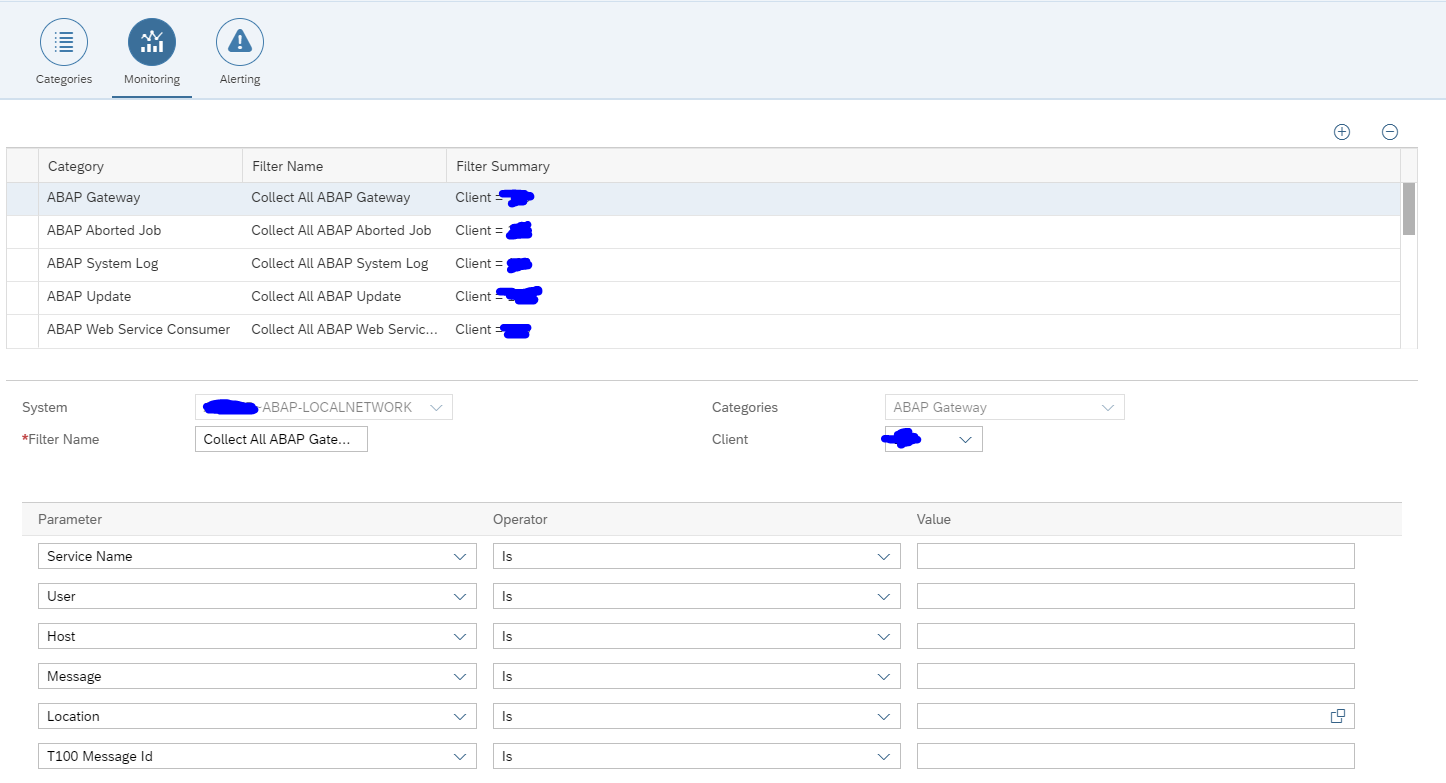
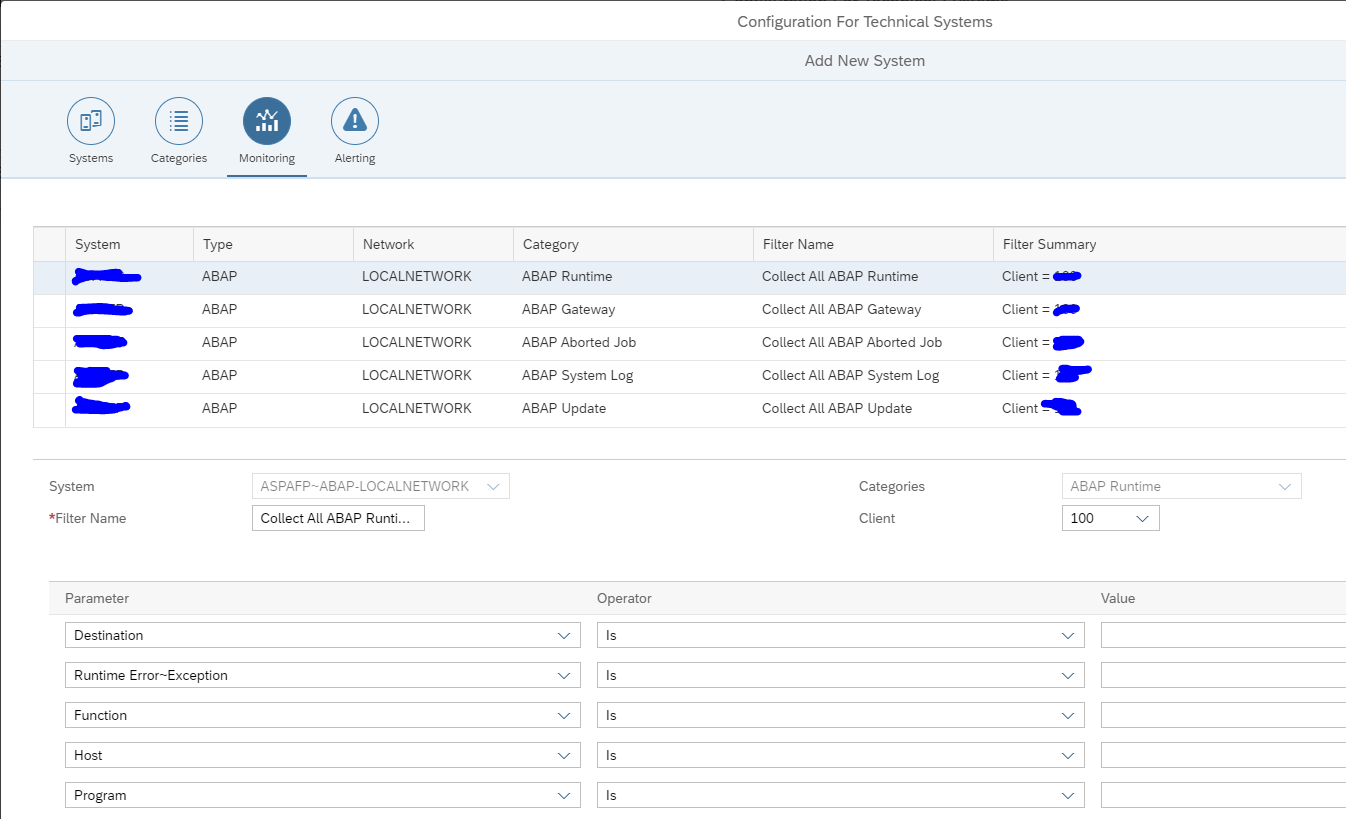
Select the monitoring:

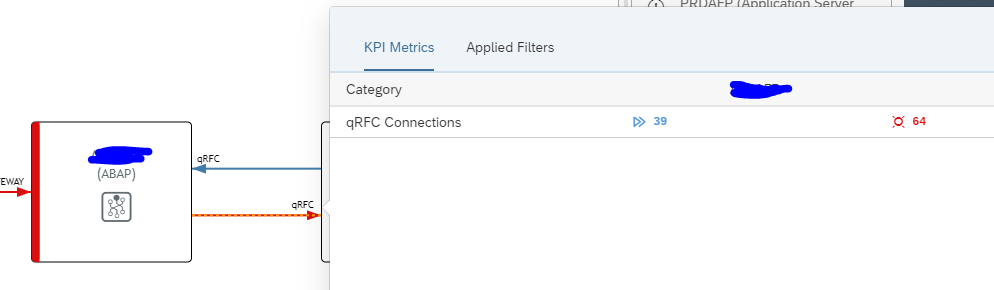
Here you must add the connections you want to monitor.

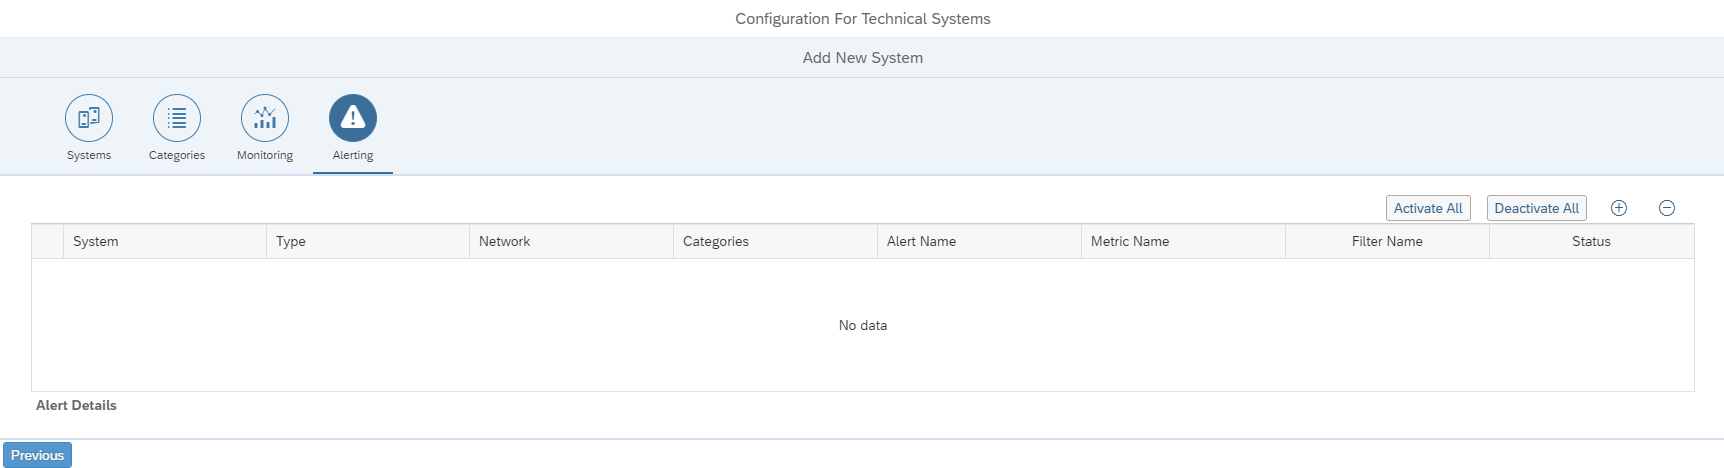
The alerting configuration is empty initially:

We will fill this later if we want alerts for a specific interface connection.

Save this system and repeat for the rest of the systems.

The system determines the actual data collection and actual alerting. The system can be re-used in multiple scenarios.

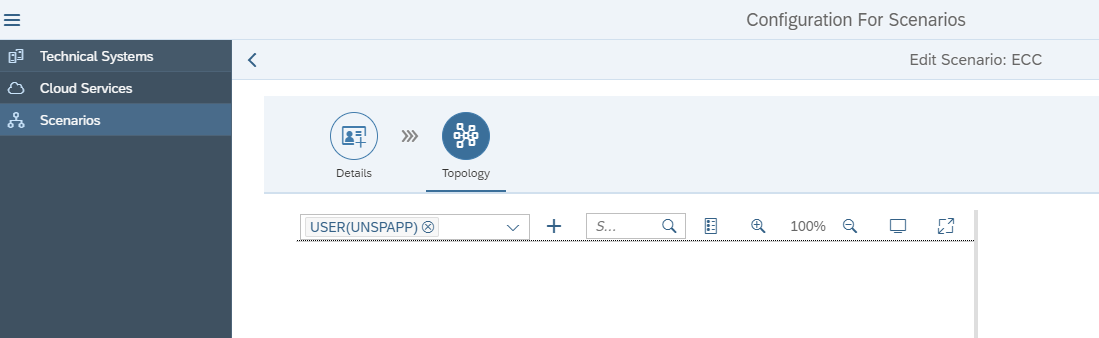
Scenario configuration

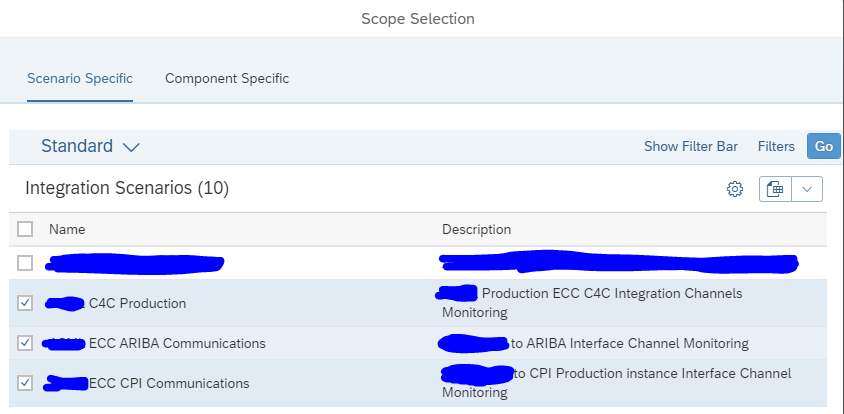
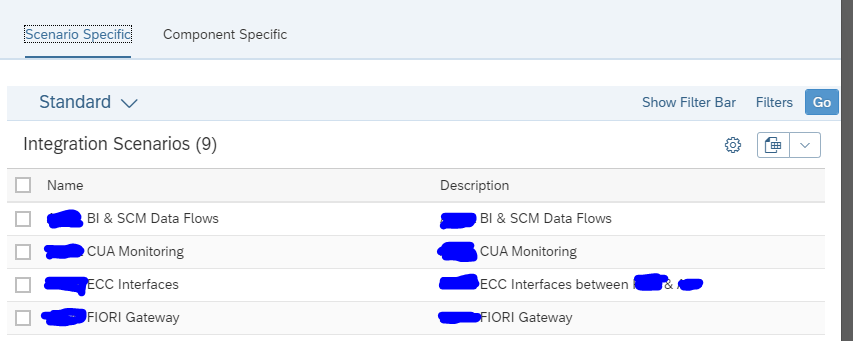
On the configuration screen now add the new scenario. Add a name and description for the scenario:

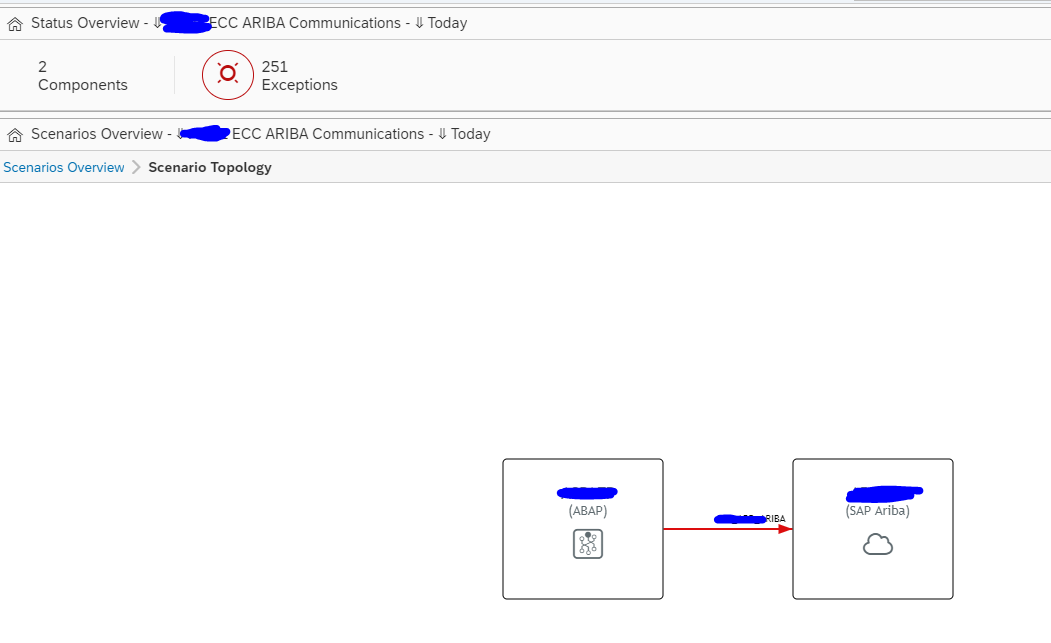
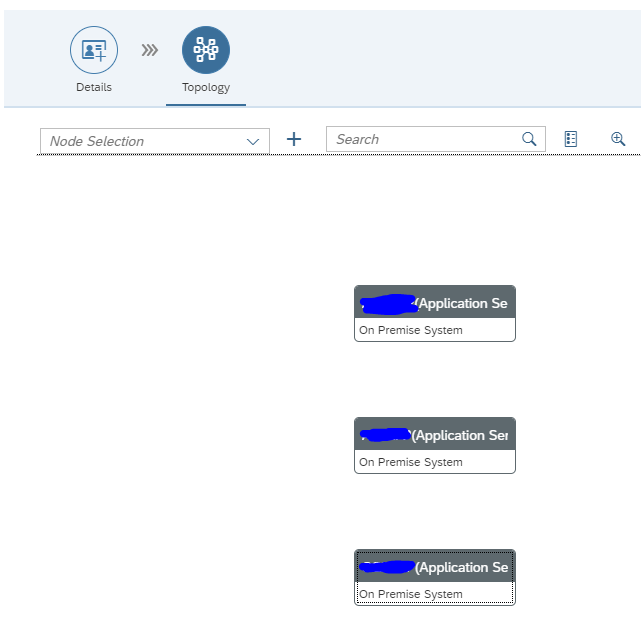
In the topology screen now add the systems in the drop down for Node Selection and use the + icon to add them to the screen:

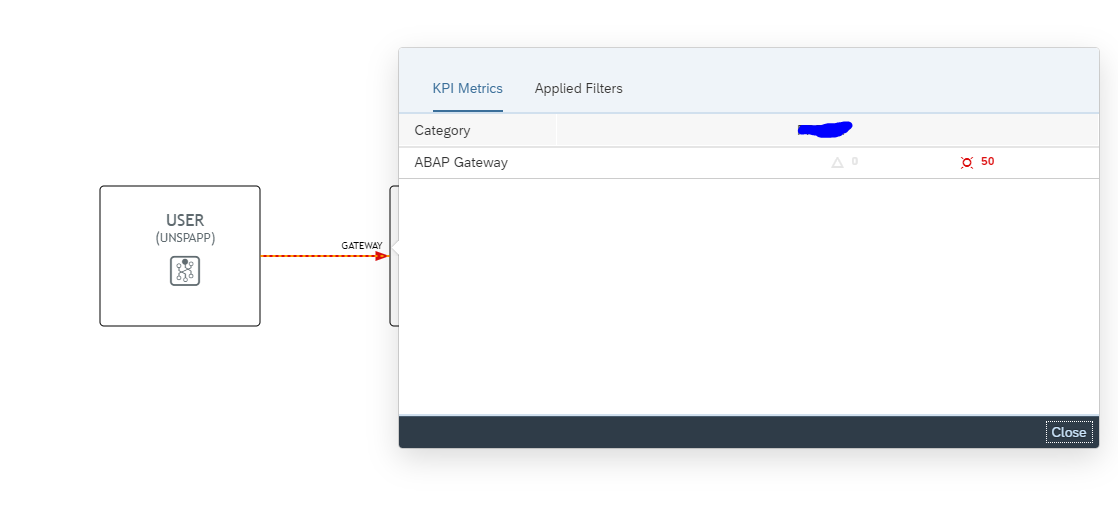
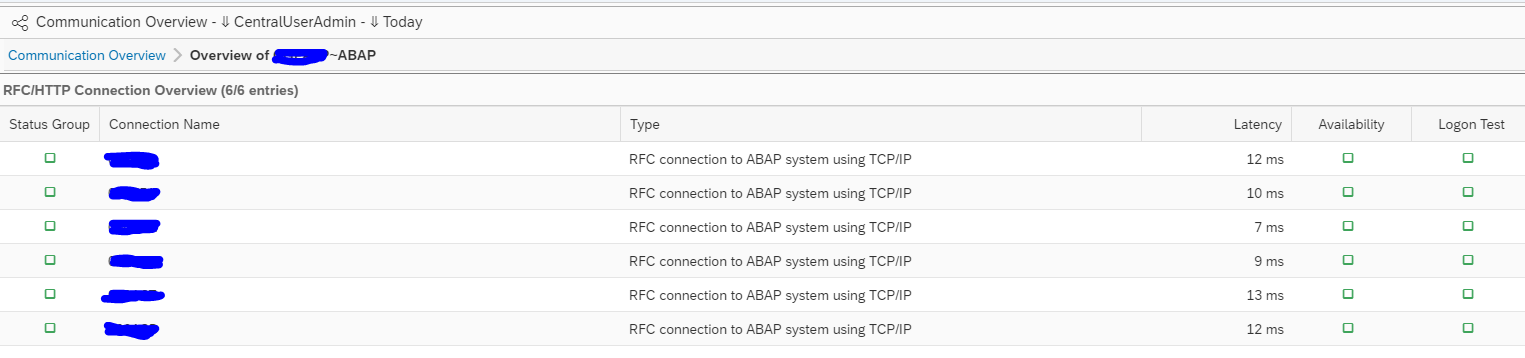
Now select the source system (we will have 1 CUA central and 2 child systems) and select the Action box:

Select Add link to and then select the system.

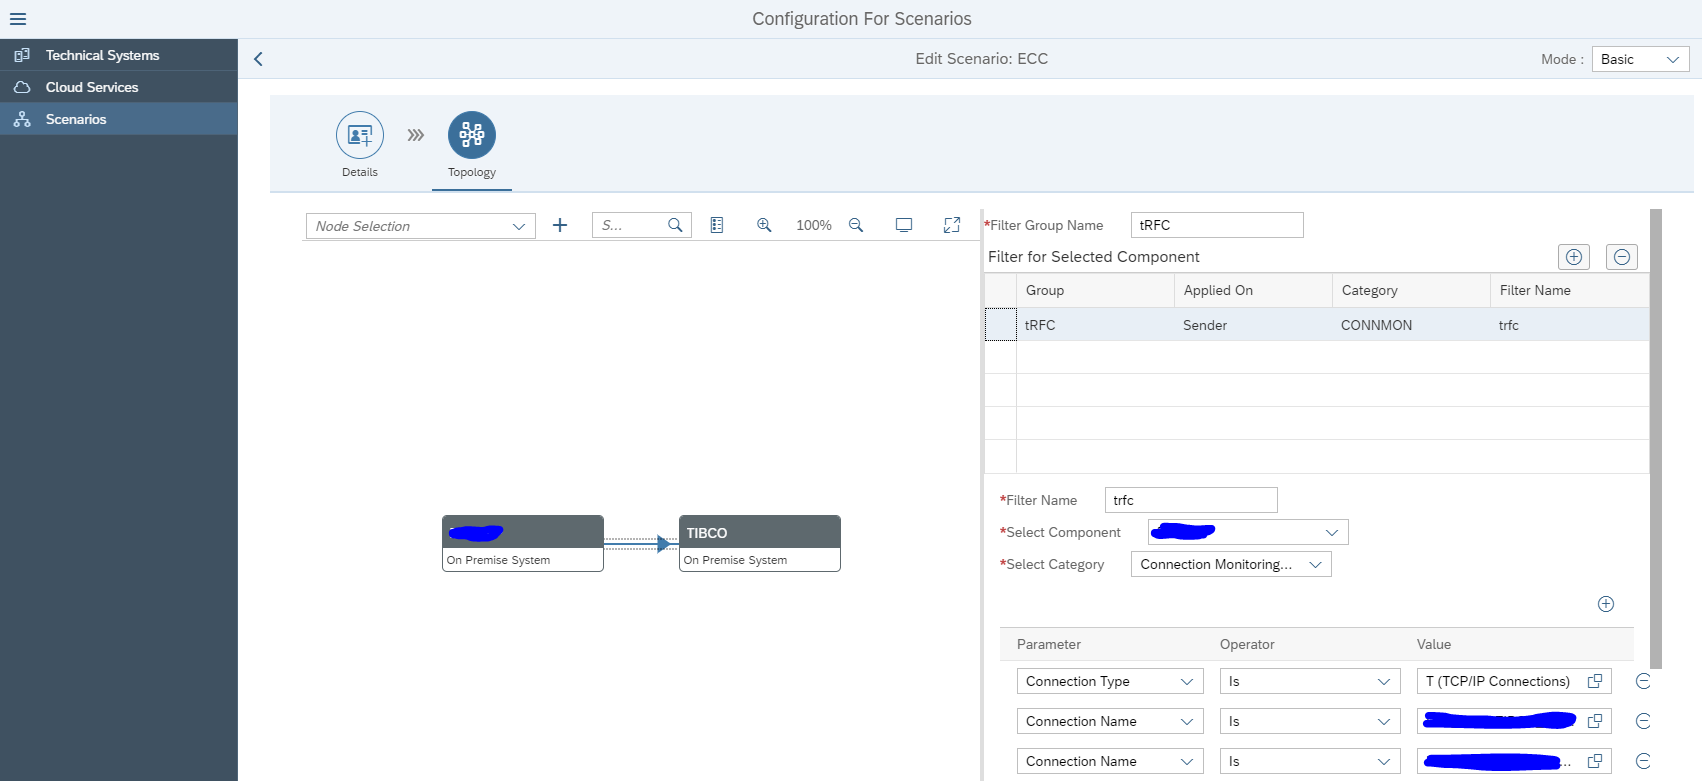
Now add a filter to the link by clicking on the line:

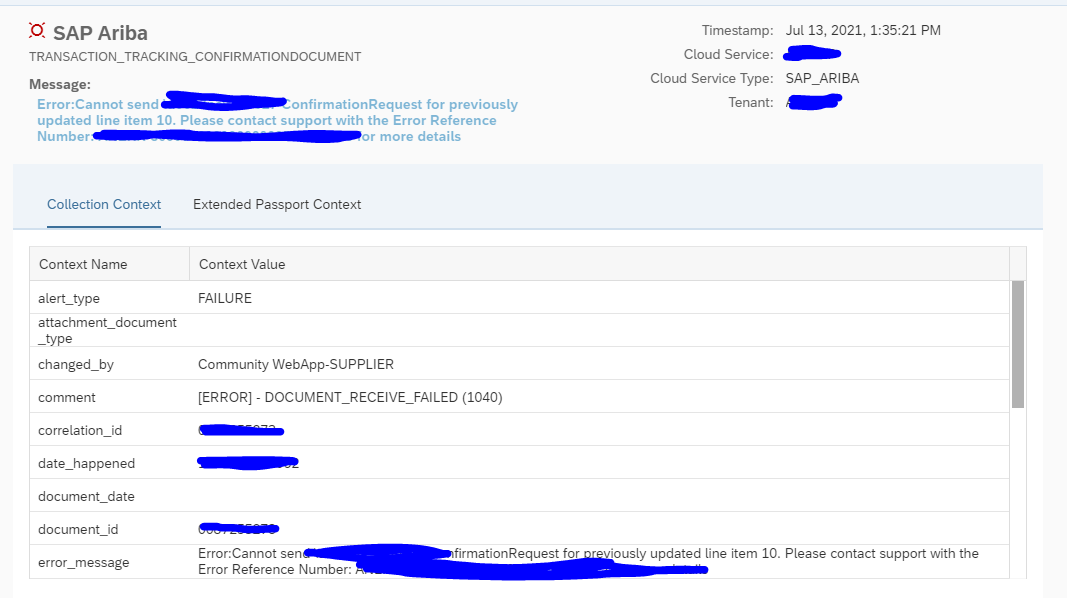
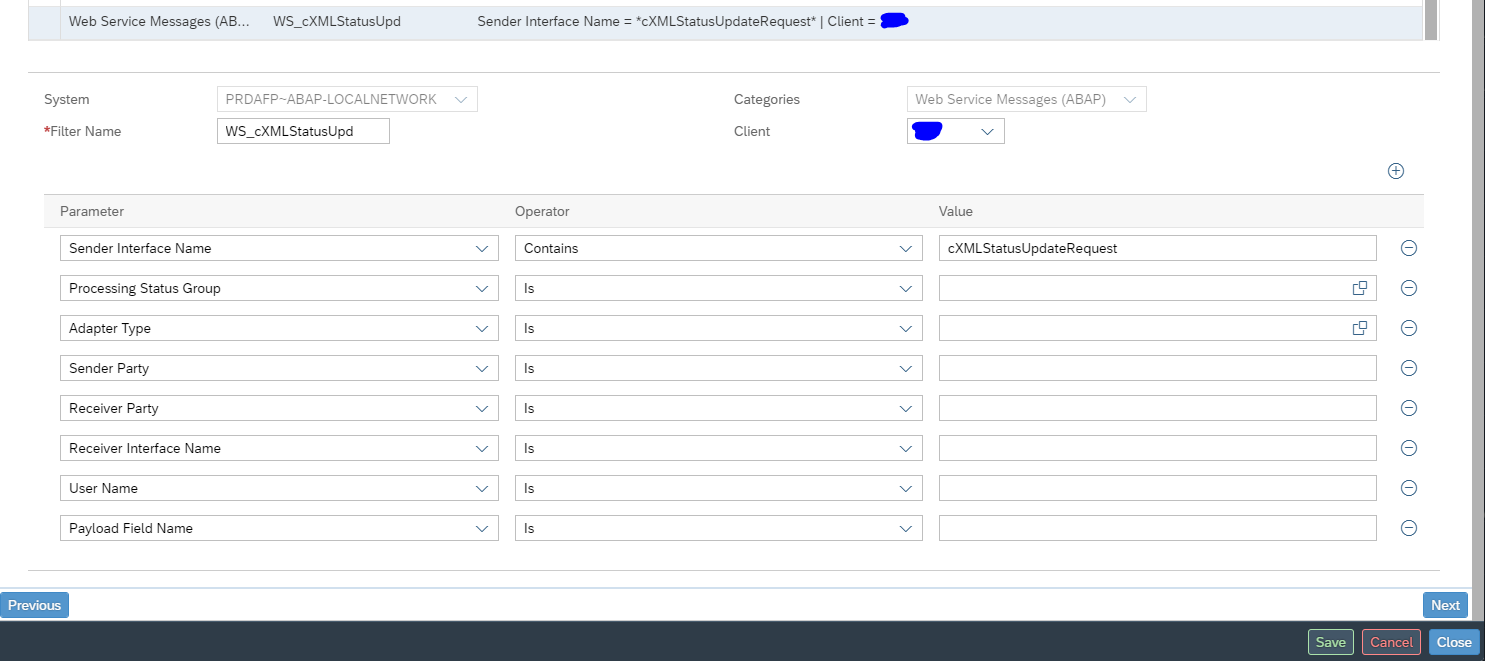
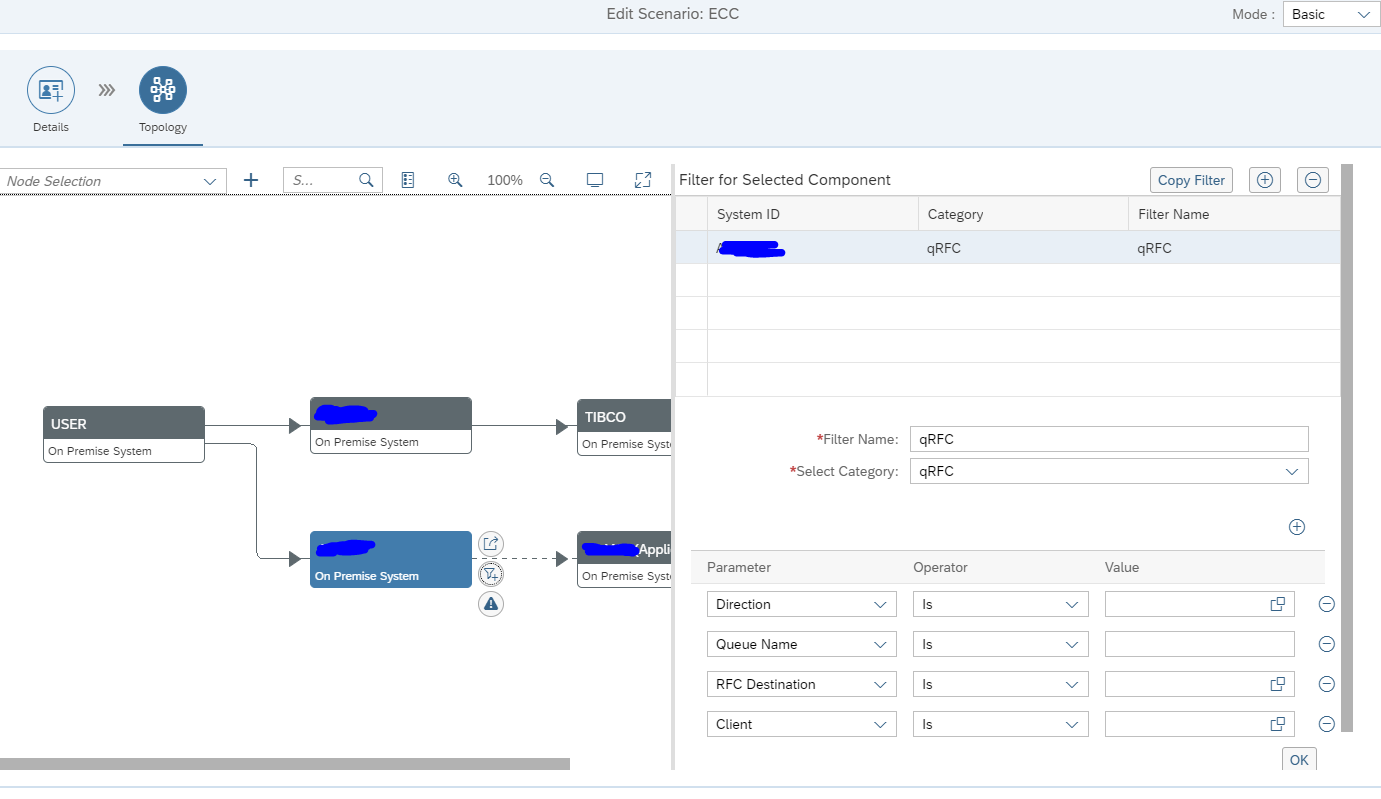
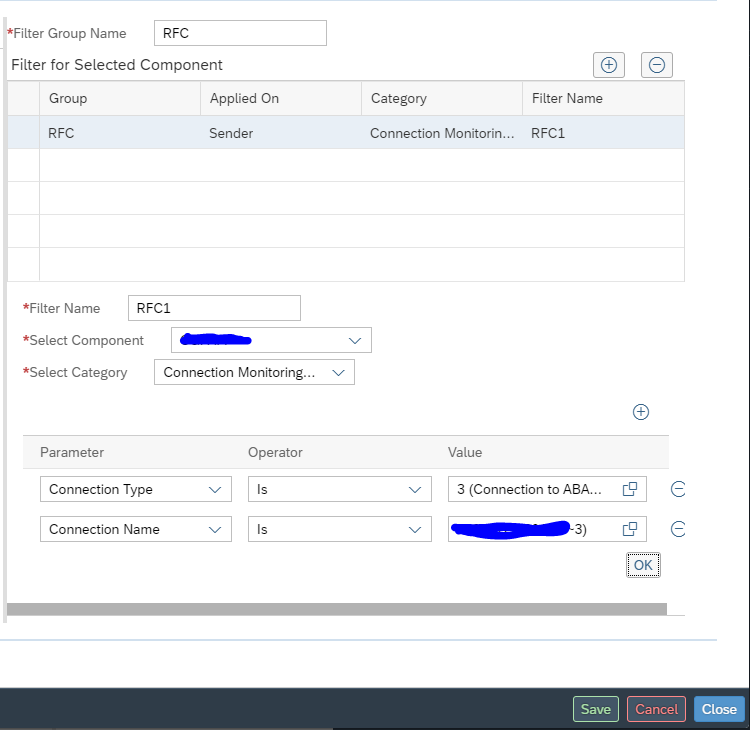
In the dialog screen on the right now add the details:

Start by giving the group a name. Now add the filter. Give the filter a name (in this case RFC1). Select the central component and the category (in this case Connection monitoring SM59). Now add the RFC connection type (3) and connection name to be monitored.

Very important here: press Ok first to transfer the data. Only then press Save. Otherwise your data is lost. SAP UI is not ok for this area.

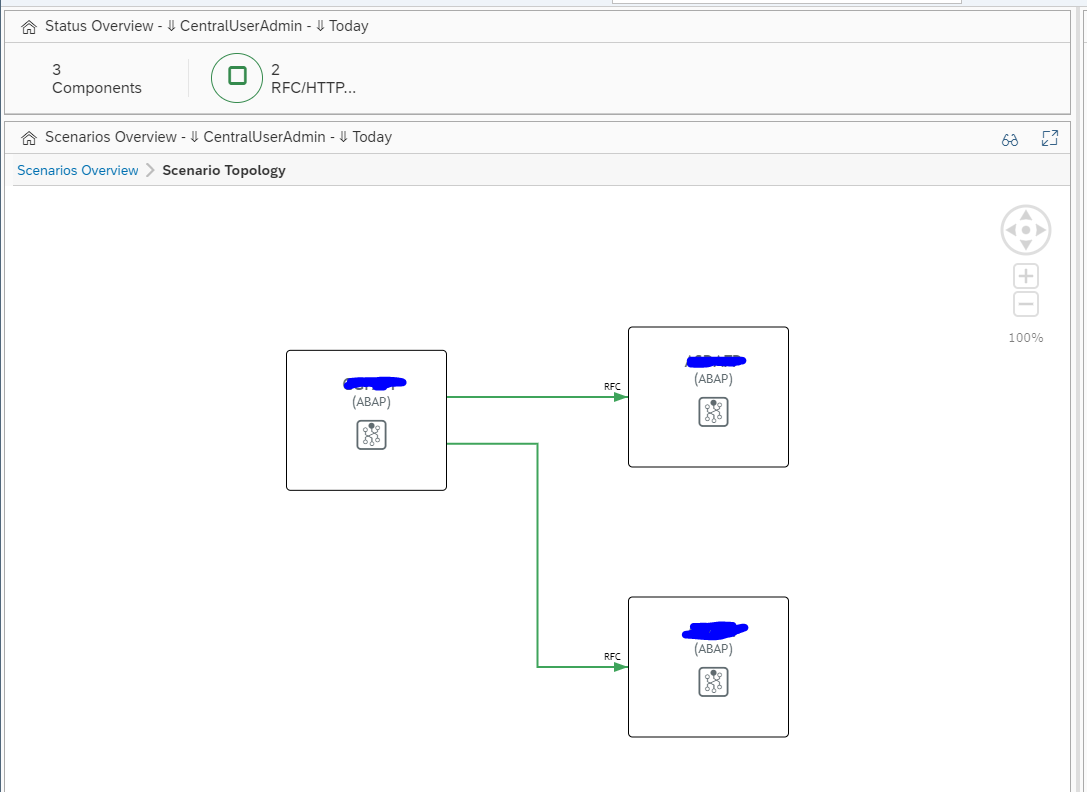
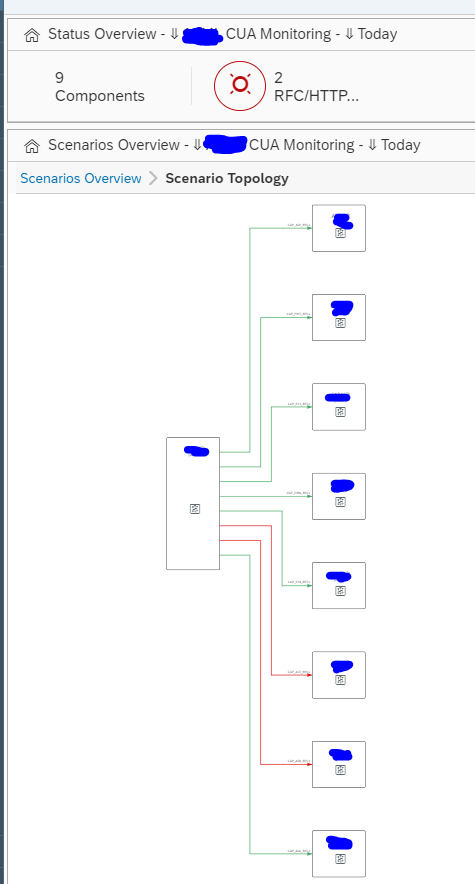
Repeat for the second scenario. The end result is that the dotted lines are replaced by straight lines:

Then Save.

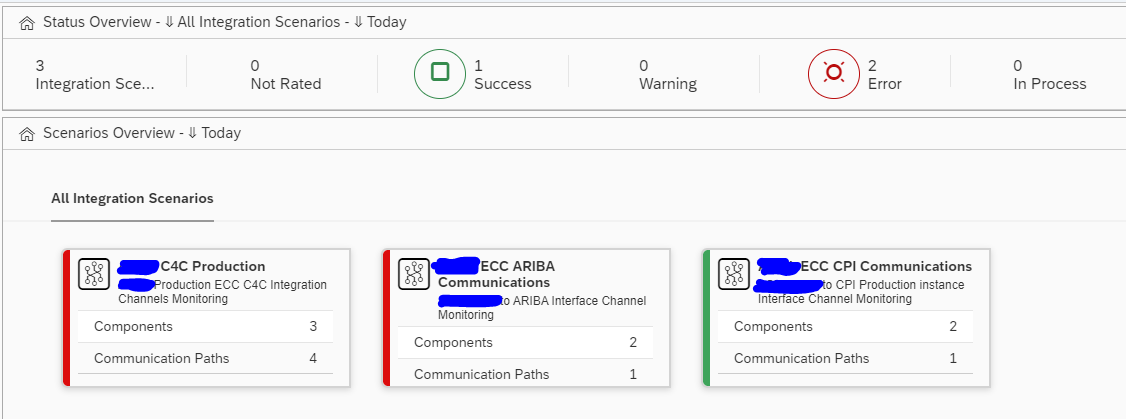
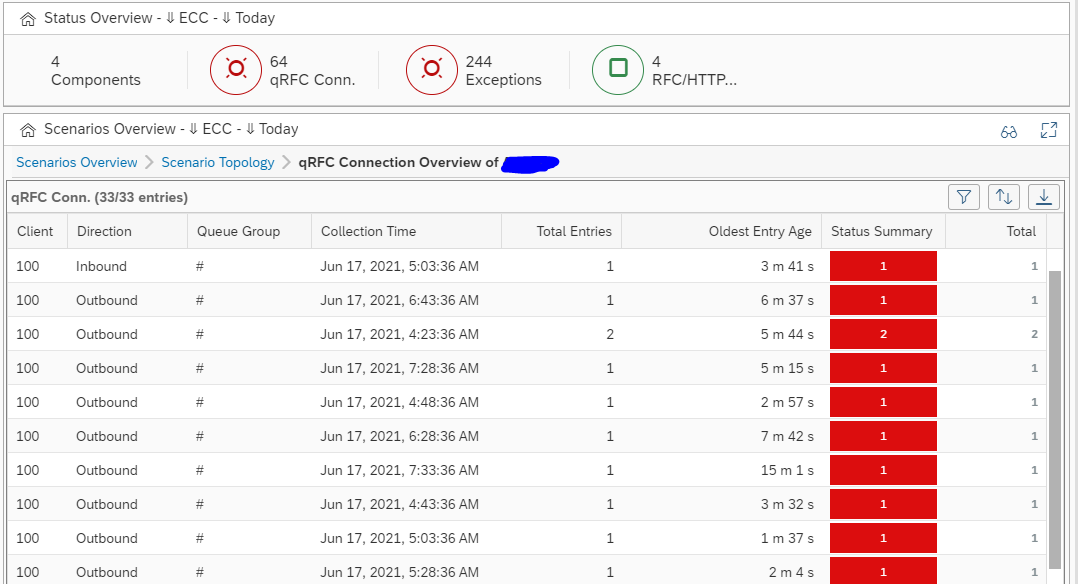
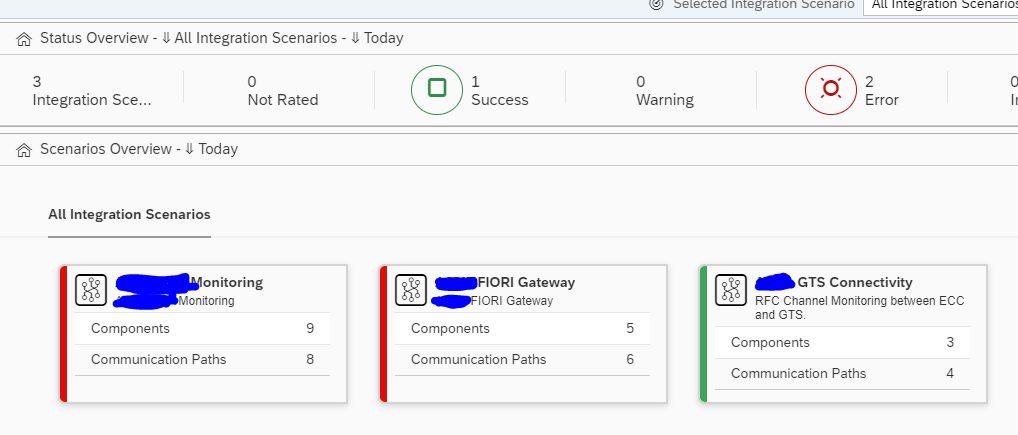
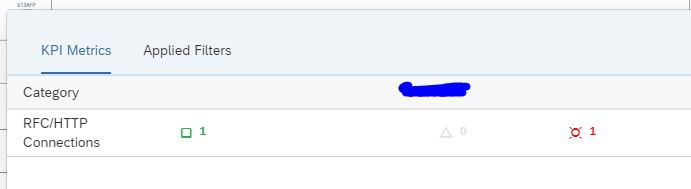
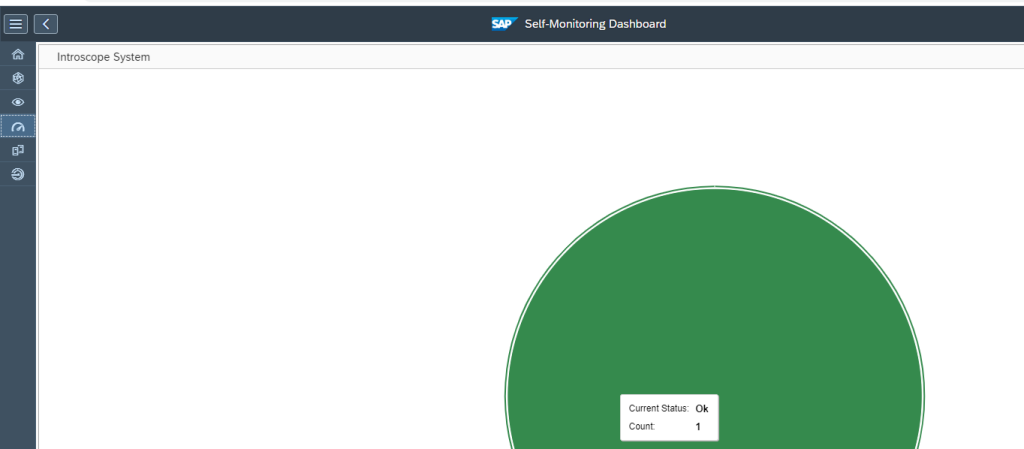
The scenario is active now:

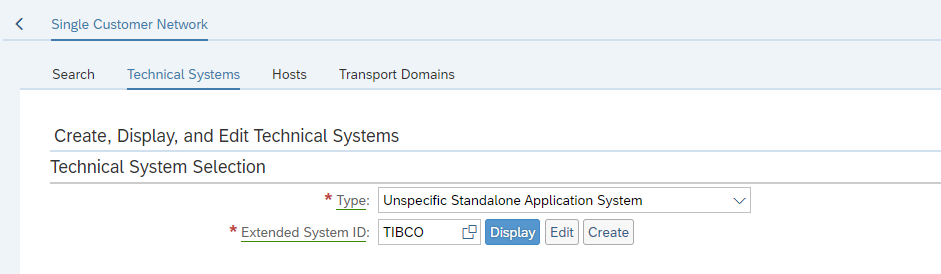
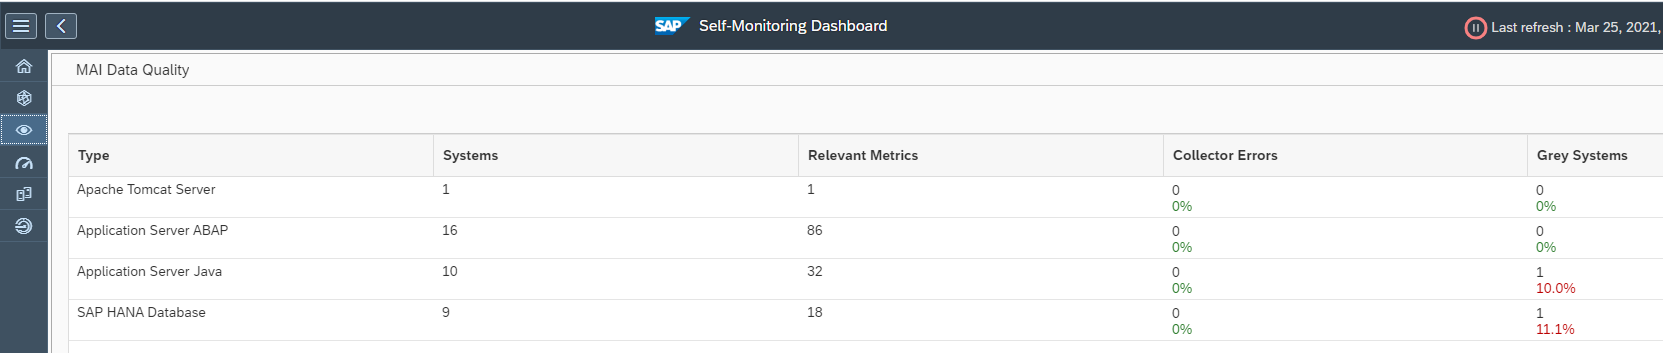
Reminder: you did have to add the same information in the system level as well in the Technical System as well: this will perform the data collection itself. If this is not done, then the scenario overview will show grey results for missing data collection.

The scenario is to make the interfaces graphical visible.
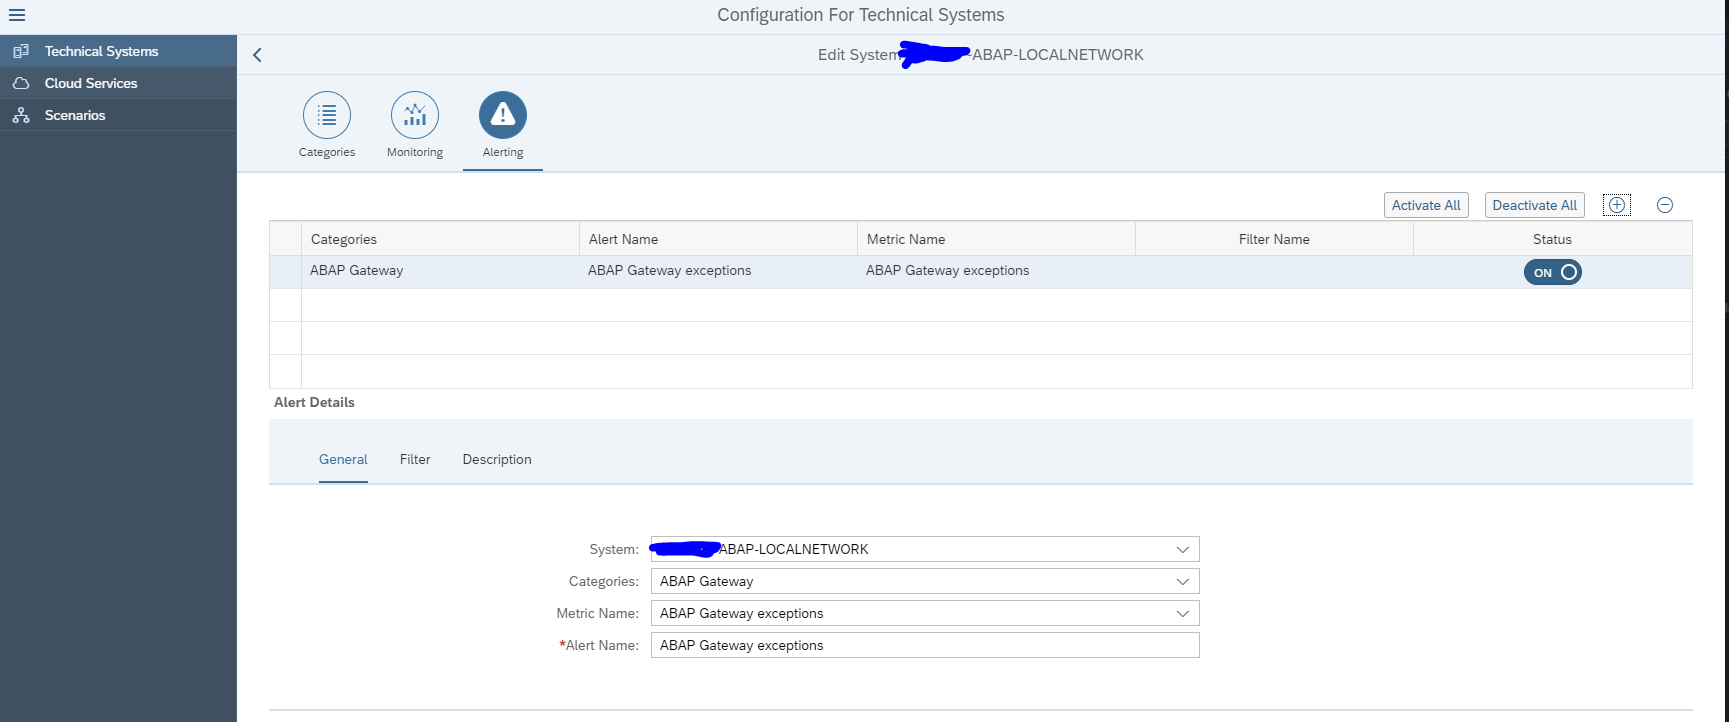
Adding alert

When you have monitored the scenario long enough to see it is stable, the next step is to setup alerting so you get notified in the central alert inbox.

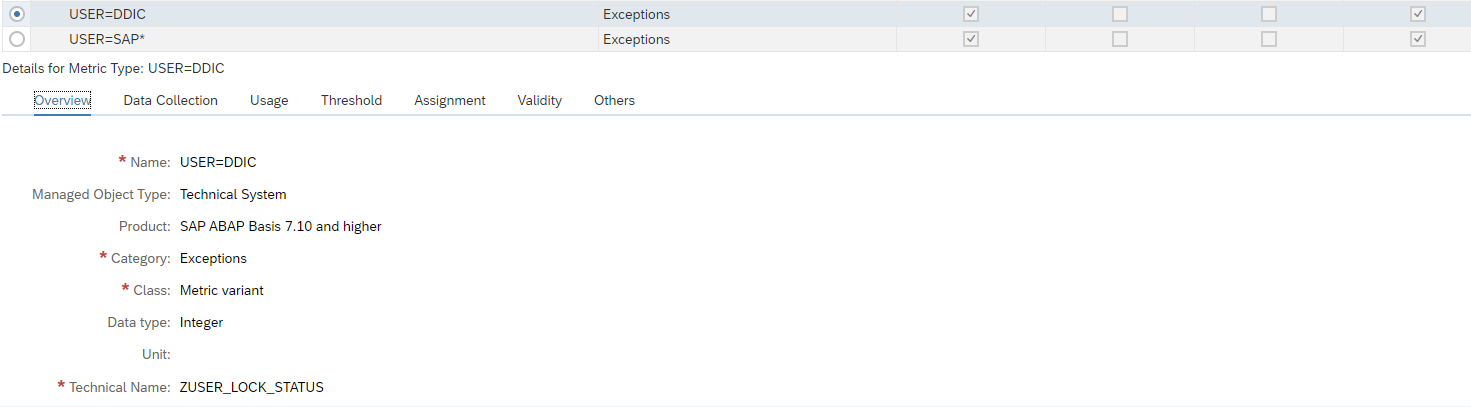
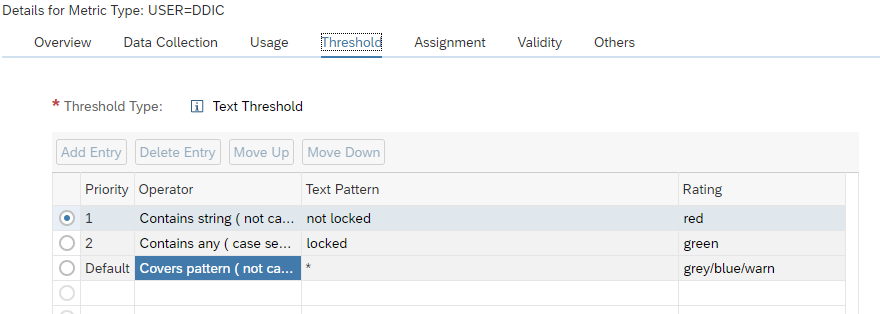
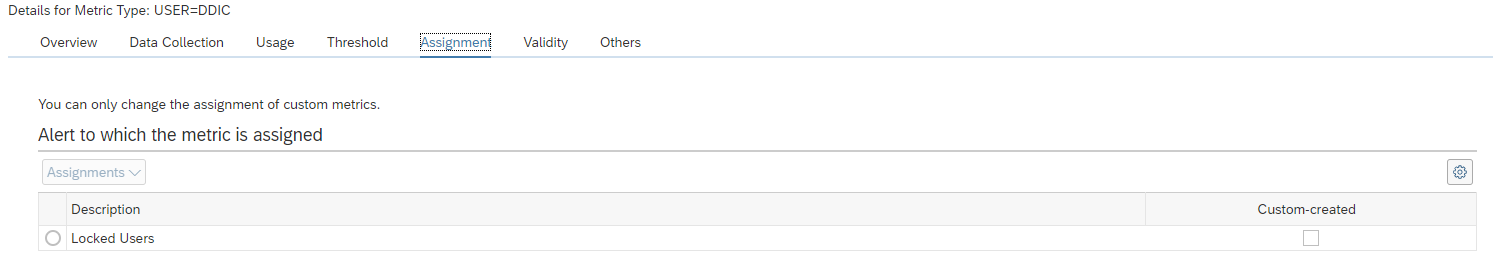
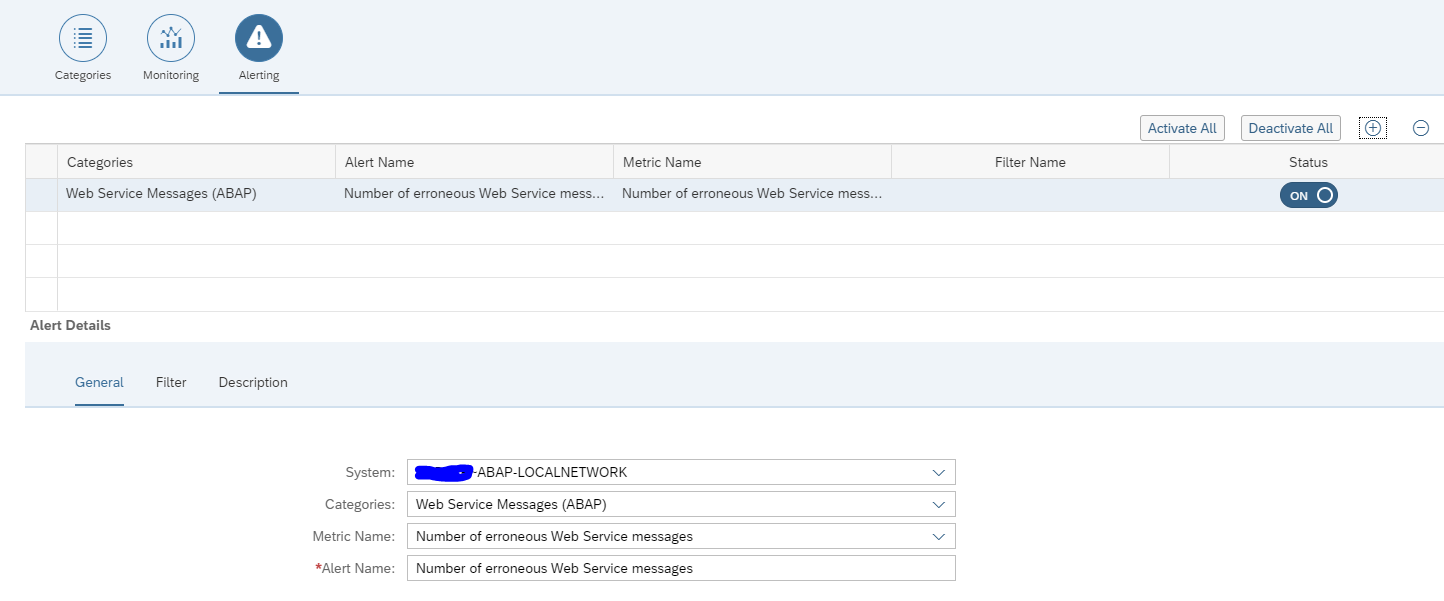
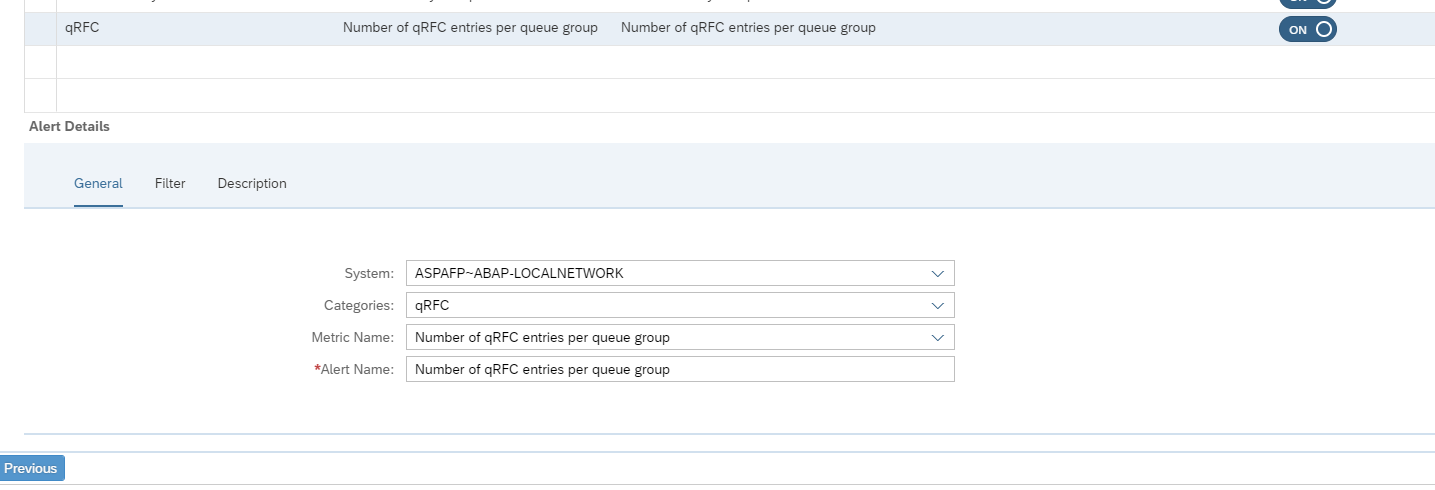
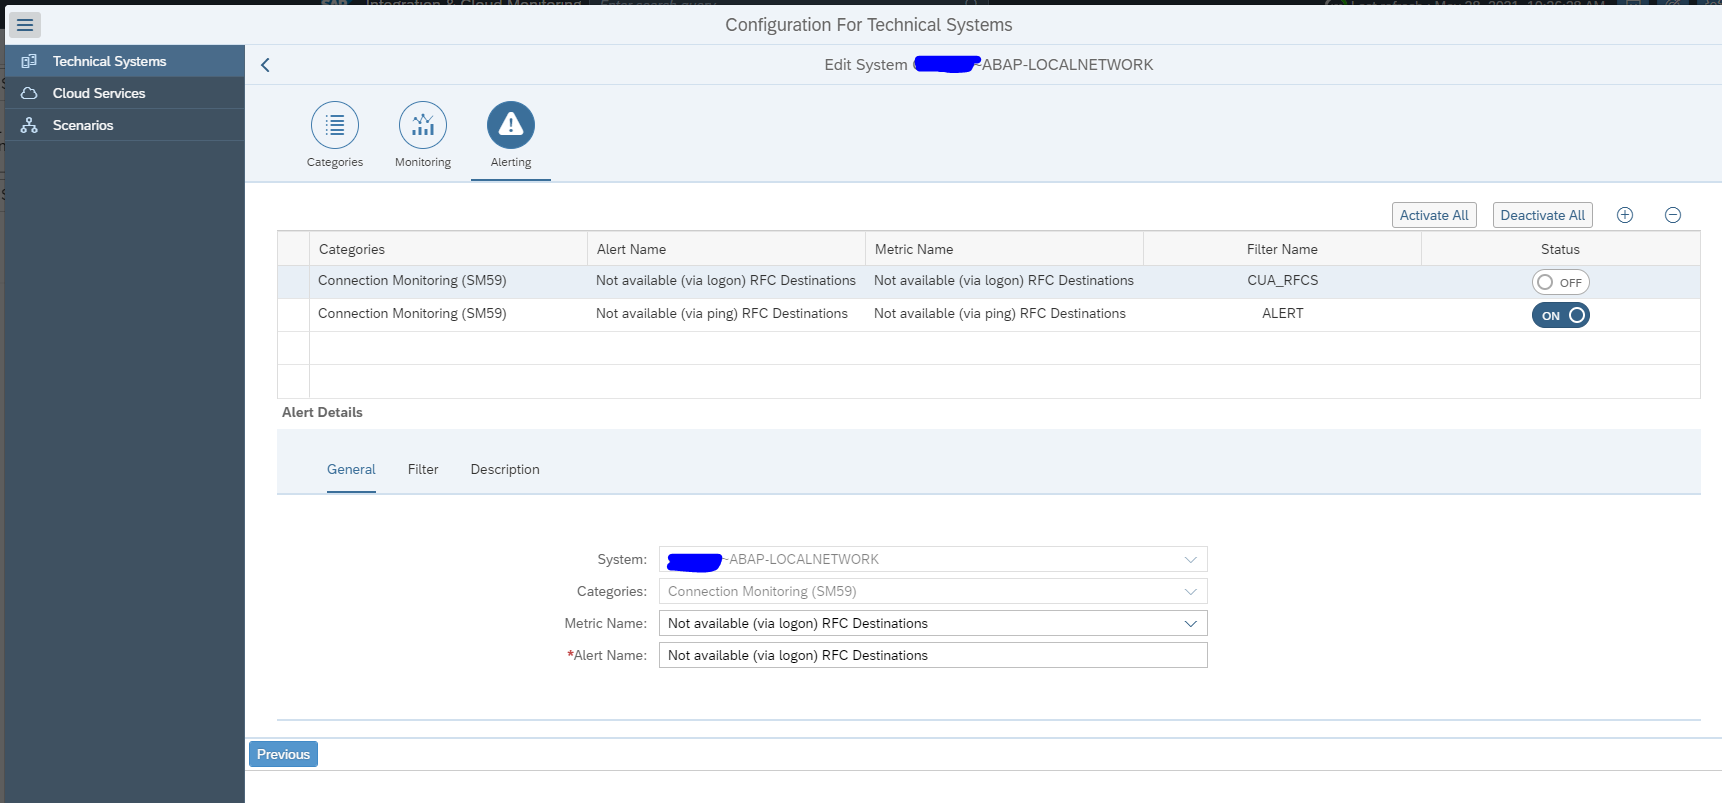
First add the alert in the Technical System as shown above. This will be the actual alert definition.

To add an alert to the graphical overview, go to the scenario definition and select the source system. Press the button alerts for component:

On the right hand side now add the alert by clicking the + button:

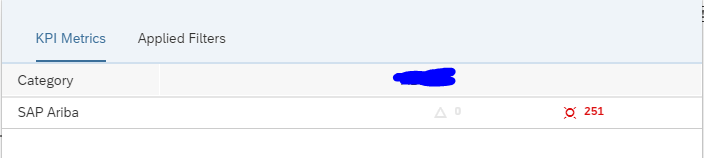
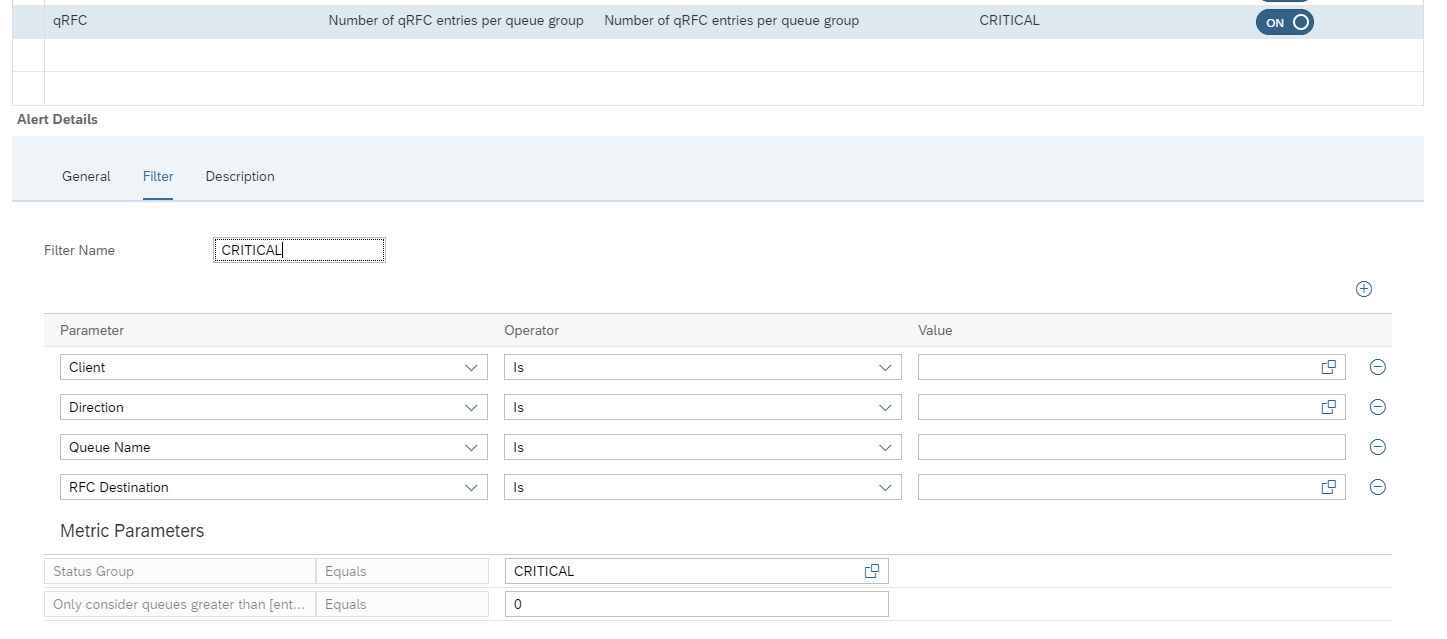
Then select the wanted Alert Category. And select the filter options. Add the connections for which you want to alert:

Give the filter also a name.

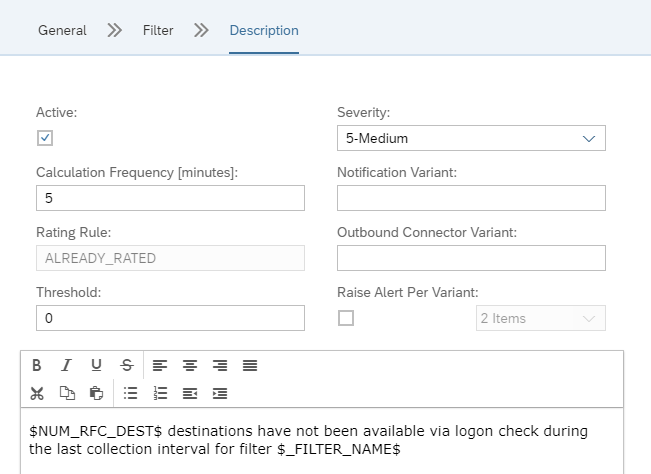
On the Description field you can set the alert to active:

You can also set the frequency of checking, and if an notification is to be send as well (via mail or towards outbound connector).

Also important here: first press Ok, then Save. Otherwise the data is lost. SAP UI is not ok for this area.

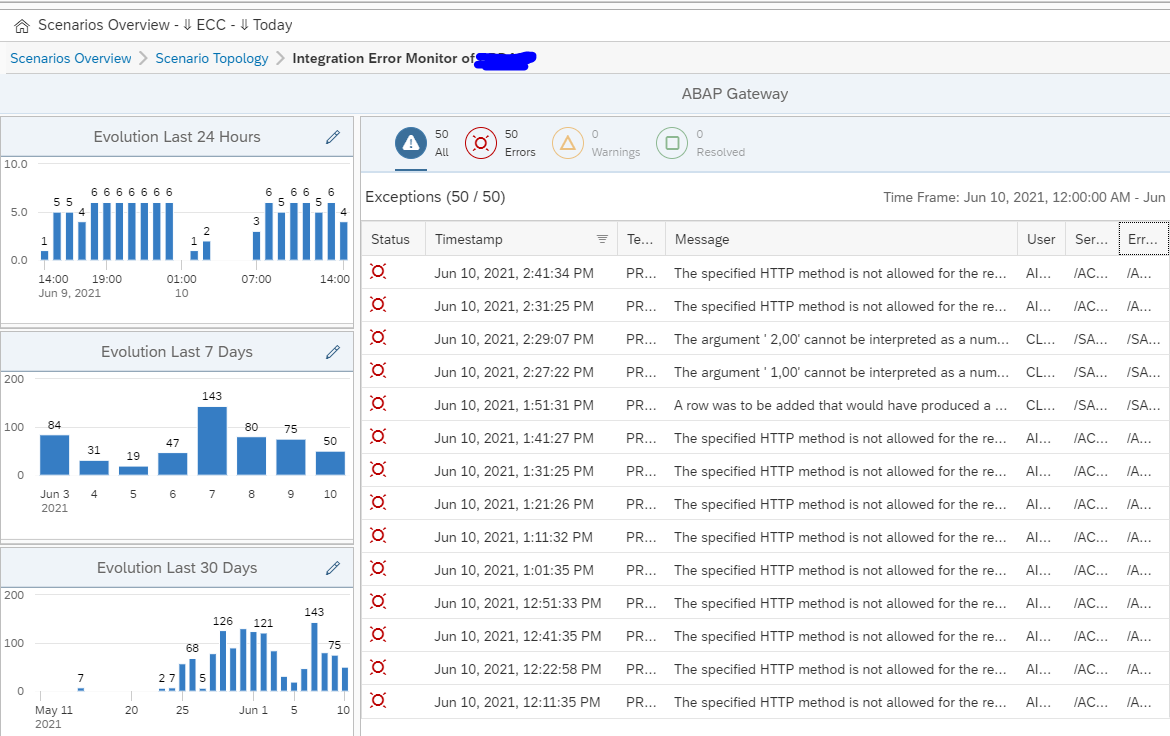
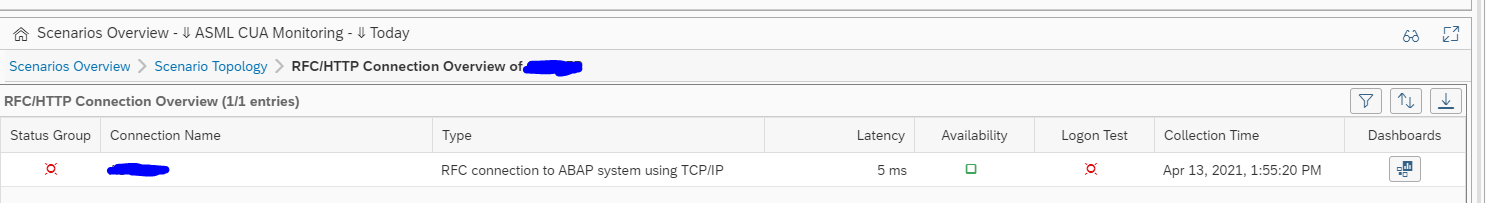
Summary and final check

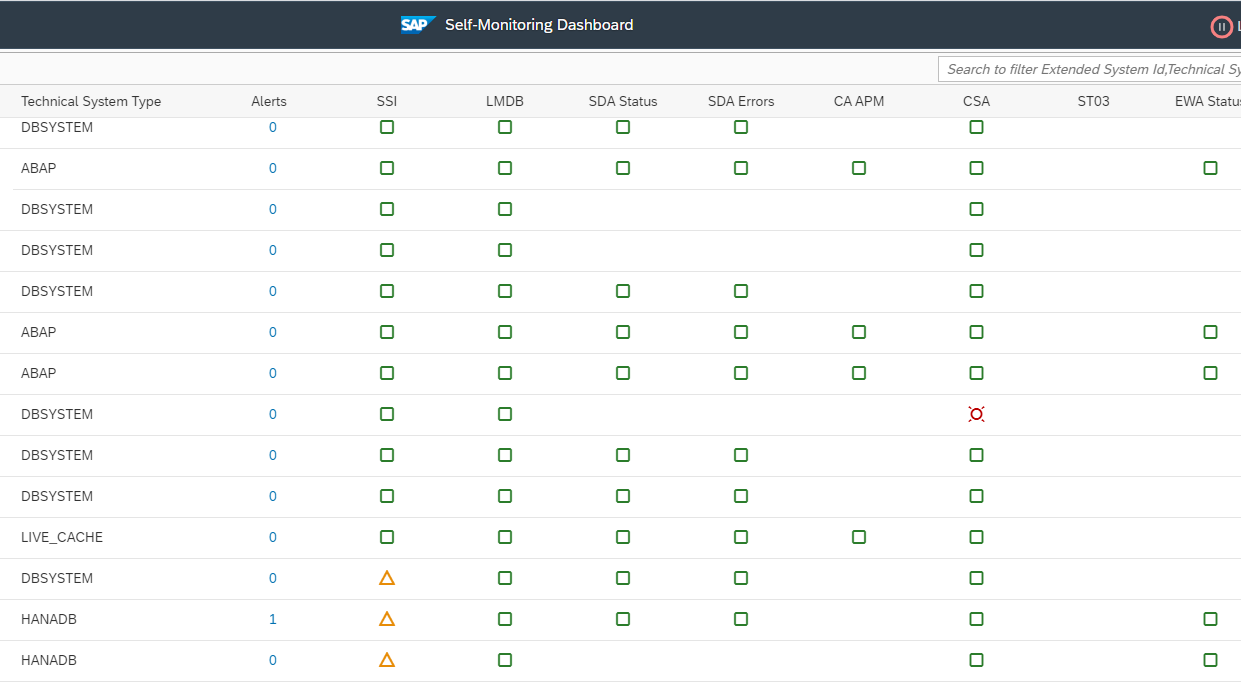
After you have finished the graphical topology, you need to go back to the Systems overview to validate if everything is activated ok for both monitoring and alerting:

Reminder: there is a split in graphical representation in the topology and scenarios and the actual system monitoring and alerting in the Technical System overview.

Specific topics

For specific interface monitoring topics read these dedicated blogs:

Interface monitoring overview…

The integration and cloud monitoring function of SAP Focused Run consists of 2 main functions:

  • Interface monitoring between SAP systems
  • Cloud monitoring between on premise and cloud SAP products (read more on cloud monitoring in this blog)

This blog will give an overview of the interface monitoring between SAP systems.

Questions that will be answered in this blog are:

  • How does the interface monitoring in SAP Focused Run look like?
  • How much details and history can I see in SAP Focused Run interface monitoring?
  • Can I link an interface monitoring event to and alert?

Interface monitoring

To start the interface monitoring click on the FIORI tile:

In the next screen you now select one or multiple integration scenario’s:

Then you reach the scenario overview screen:

You can immediately see with the red colored scenario’s that there is an issue.

Click on the red scenario to open the details of the scenario topology:

The topology indicates most of the interfaces are correct. To see the detailed issue, click on the red line:

Click on the red error for the details:

On the right side of the you can click on the Dashboard icon to get an historical overview:

Link with alert management

If wanted, the interface errors can be triggering an alert in the Alert Management function.

Interfaces that can be monitored

Full list of interfaces that can be monitored is published on the Focused Run expert portal.

Short list:

  • RFC
  • Idoc
  • qRFC
  • Netweaver gateway errors

Technical scenario setup

The technical configuration of the interface monitoring setup is explained in this blog. We will also explain how to model non-SAP systems that are interfaced to and from.

Specific topics:

Work mode management…

There will be planned maintenance on SAP systems and the below databases, operating systems and the below infrastructure. During this planned maintenance, you don’t want any alerts and mails from SAP Focused Run, since the application is not available for a planned time.

Using the work mode management function you plan these maintenance events.

Questions that will be answered in this blog are:

  • How can I set up planned maintenance for systems monitored by SAP Focused Run to temporarily suppress the alerts during maintenance?
  • How can I see the current maintenance and planned upcoming maintenance?
  • Can I make a public page for the IT calendar?

Planning maintenance

Goto the IT calendar and workmode management tile:

Select the system (or select multiple systems in one go) and create the work mode for maintenance, and immediately switch to Expert Mode:

With expert mode you can simply set start and stop date and time.

You also should check the scope (the system will make a proposal) and extend if needed:

After saving, you can send notification via mail on the planned maintenance:

You can now see the planned maintenance in the calendar mode.

Overview of upcoming events

If you are in the calendar mode there can be a lot of systems. The overview screen for upcoming events will filter on the systems which have maintenance mode planned:

Actual maintenance

Actual maintenance can be seen in the System Down monitor:

You will only see maintenance that is currently running in the system down monitor, not the upcoming events.

Alert suppression

Alert suppression is in details set in table ACWMGLOBALDIR (maintenance via transaction SM30). See also this OSS note 3142800 – Health Monitoring Alerts generated during an active workmode in Focused Run for all the details.

Tips and tricks

Can I select multiple systems for planned maintenance in one go? Yes you can, this will save you a lot of time to input.

Can I make a recurring maintenance? Yes you can, in the scheduling screen mark the maintenance as recurring.

Can I make a public page for the IT calendar? Yes, you can, follow the instructions in OSS note 2926433 – IT Calendar access to Non-SAP Focused Run Users. For full description how to do this, read this dedicated blog on this topic.

Self monitoring…

When using Focused Run you monitor systems. But how about the health and stability of the monitoring tool itself? Here is where self monitoring plays an important role.

Questions that will be answered are:

  • What to check in self monitoring?
  • How much metrics are collected and stored in my Focused Run installation?

Self monitoring

Self monitoring can be started with the Self Monitoring FIORI tile:

If you click the tile the overview page comes:

The interesting part is unfortunately hidden in the below screen (you need to scroll), which is the CPU utilisation.

The other interesting part is the amount of data collected and stored. This is not so interesting for yourself, but more interesting for your manager to show how much data HANA can handle, or to show how much work is really automated.

Simple diagnostics agent

On the top left icons, click on the Simple DA agent button to get the agent overview screen:

Important here:

  • Check that all agents are up
  • Check that all agent versions are not too old

Monitoring and Alerting Infrastructure

The next option is to check the MAI (monitoring and alerting infrastructure) data collection:

Important here is to fix the systems in error.

Wiley Introscope

The Wiley option will show if your Wiley Introscope connected to Focused Run is ok. Wiley is used for special use cases like JAVA and Business Objects products.

Managed system overview

The managed system overview gives the overview of the diverse systems and application status:

Any red or yellow item can mean a setup issue. But it can also be because of missing authorizations and privileges of the Focused Run technical user in the connected managed system.

Central component monitoring

The central component monitoring shows the overview of the central components: