Cloud monitoring: Ariba…

SAP Focused Run Cloud Monitoring can be used to monitor messages to and from the Ariba solution.

Questions that will be answered in this blog are:

  • How to monitor message to and from SAP Ariba?
  • How to setup the monitoring towards SAP Ariba?

End result of monitoring

The configuration of the scenario is described in the next chapter. We start explaining the end result.

Click on the tile for integration and cloud monitoring:

Select the scenario and the overview tile appears:

Click on the card to go to the scenario topology:

Click on the red line to zoom into the communication error details:

Click on the message to zoom into the details:

Set up of the Ariba monitoring scenario

Follow the steps from the SAP expert portal for Ariba monitoring to setup the STRUST in SAP Focused Run for the Ariba URL.

Validate in the SAP Focused Run ABAP stack that these two parameters are set in RZ11:

  • icm/HTTPS/client_sni_enabled = TRUE
  • ssl/client_sni_enabled = TRUE

If this is done, go to the cloud setup FIORI tile:

Add a new end point for Ariba:

The application key, client ID and client secret will need to be provided by the basis person or functional consultant maintaining the Ariba interface configurations on the Ariba cloud. Depending on the security setup, a proxy is required as well.

After entering the details check the connection:

Now go to the configuration of the interface scenario and create a new cloud service for Ariba Network Transaction:

On the Monitoring tab connect to the end point create above and set the wanted filters:

If you want, you can also set up alerting in the third tab.

Save and activate the setup.

Now you can model the scenario graphically as well:

Interface monitoring: Idoc monitoring…

The generic interface monitoring setup in SAP Focused Run is explained in this blog. This blog will zoom into monitoring of Idocs.

Idoc monitoring

SAP Focused Run can both report on idoc errors and delays in idoc processing. Delay in idoc processing can cause business impact and is sometimes hard to detect, since the idocs are in status 30 for outbound, or 64 for inbound, but are not processed. SAP Focused Run is one of the only tools I know who can alert on delays of idoc processing.

The monitoring starts with the Integration & Cloud monitoring tile:

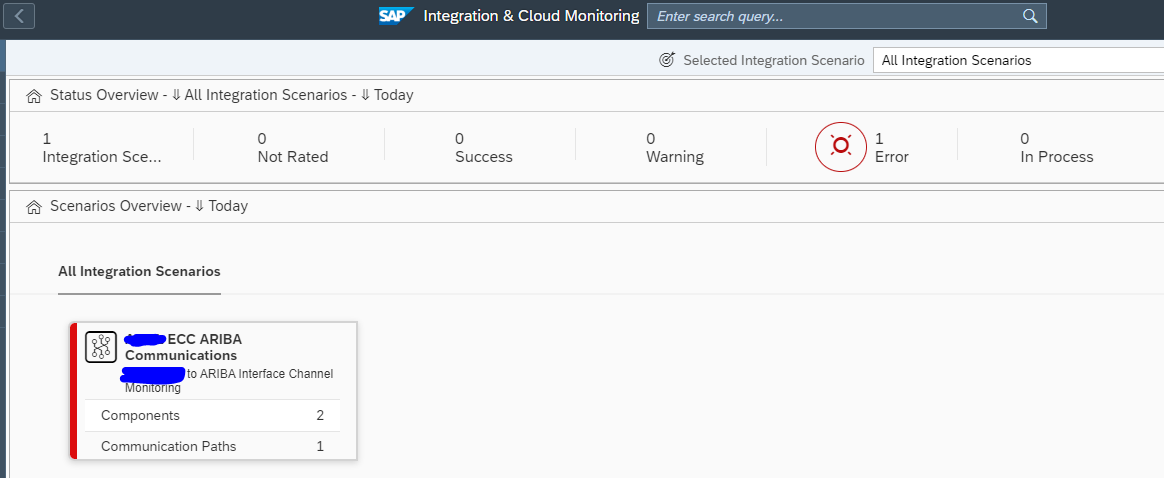
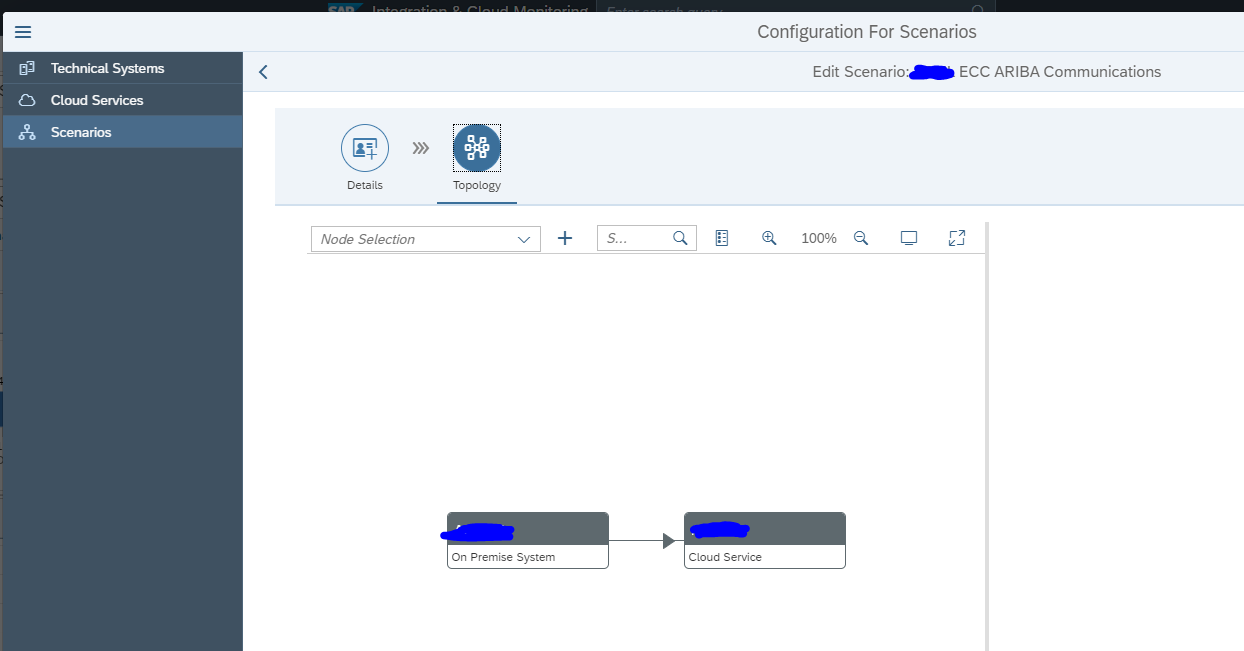
Then select the modelled idoc scenario (modeling is explained later in this blog):

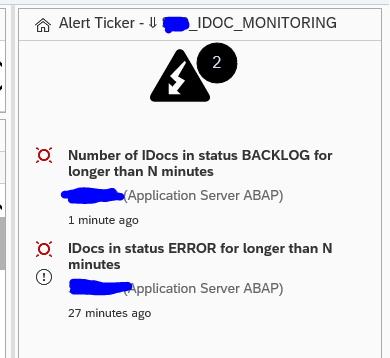
On the alert ticker you can already see there are alerts for both idocs in error, but also alerts for idocs in delay:

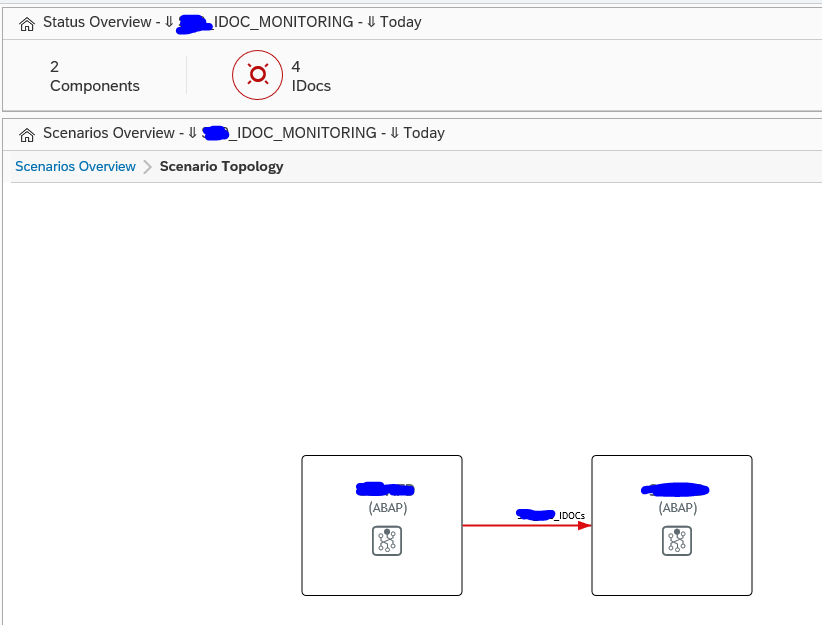
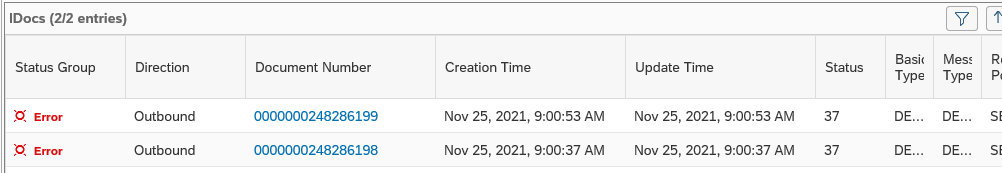
In the main overview screen click on the interface line to get the overview of idocs sent:

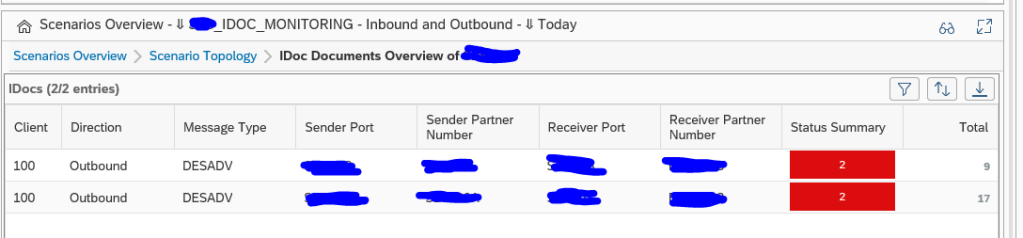
You can now see the amount of idocs that were sent successfully, which are still in transit and which ones are in error. Click on the number to zoom in:

Click on the red error bar to zoom in further to the numbers:

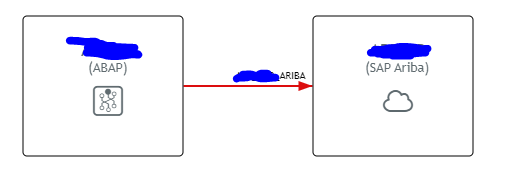
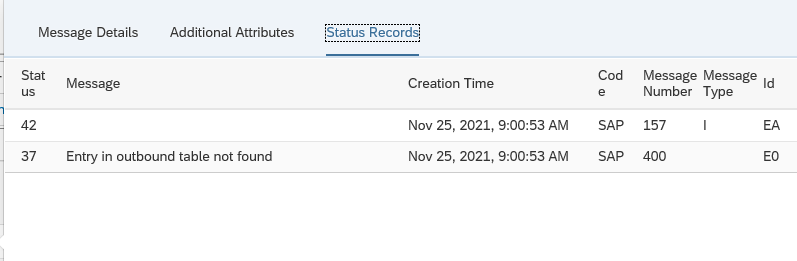
Click on the idoc number to get further details:

Unfortunately, you cannot jump from SAP Focused Run into the managed system where the idoc error occurred.

Documents monitor

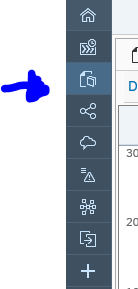
A different view on the idocs can be done using the documents monitor. You can select the documents monitor tool on the left side of the screen:

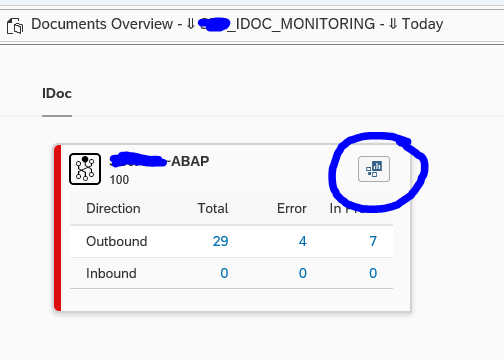
Now you goto the overview:

You can click on the blue numbers to dive into the details. Or you can click the Dashboards icon top right of the card to go into the dashboard mode:

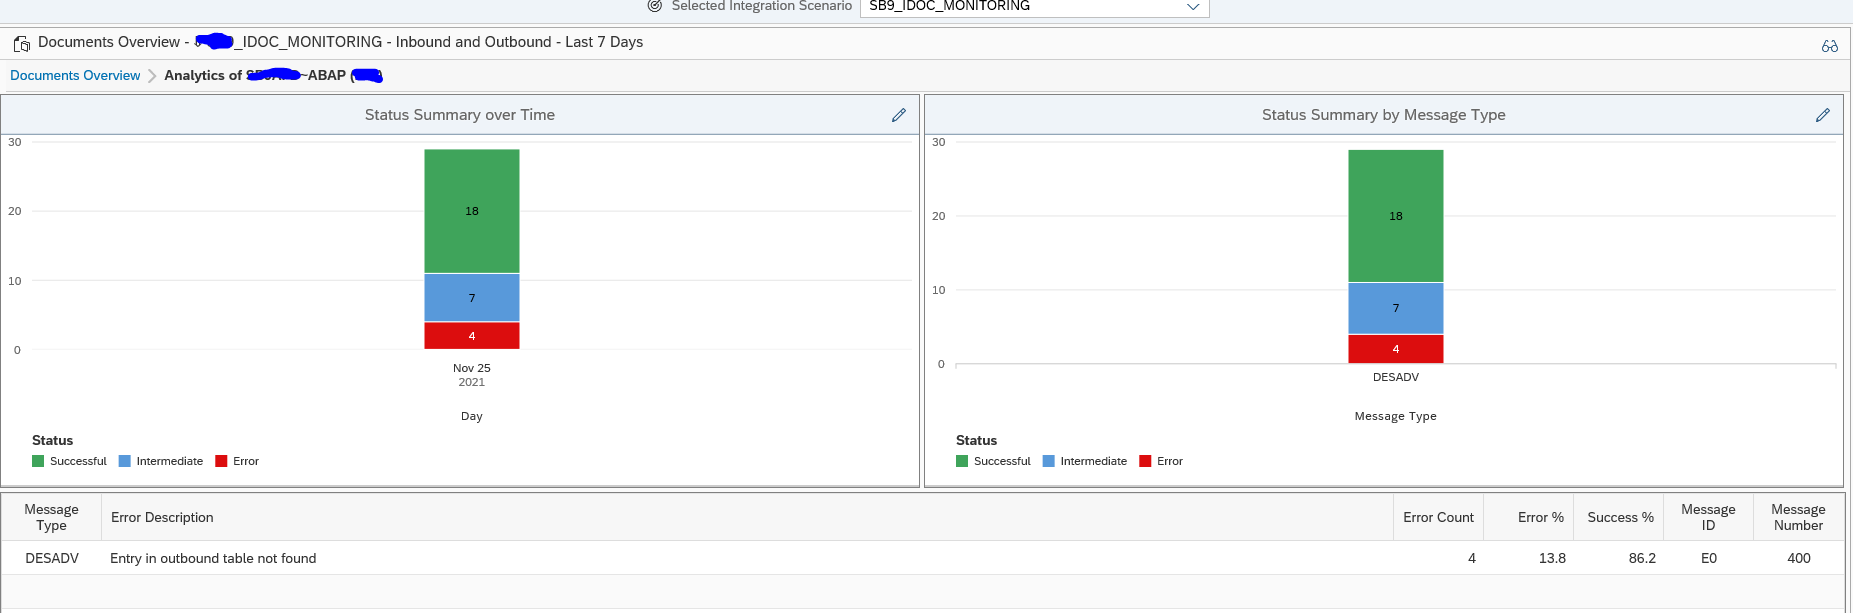
This will show you the summary over time and per message type. Clicking on the bars will again bring you to the details.

Data collection and alerting setup

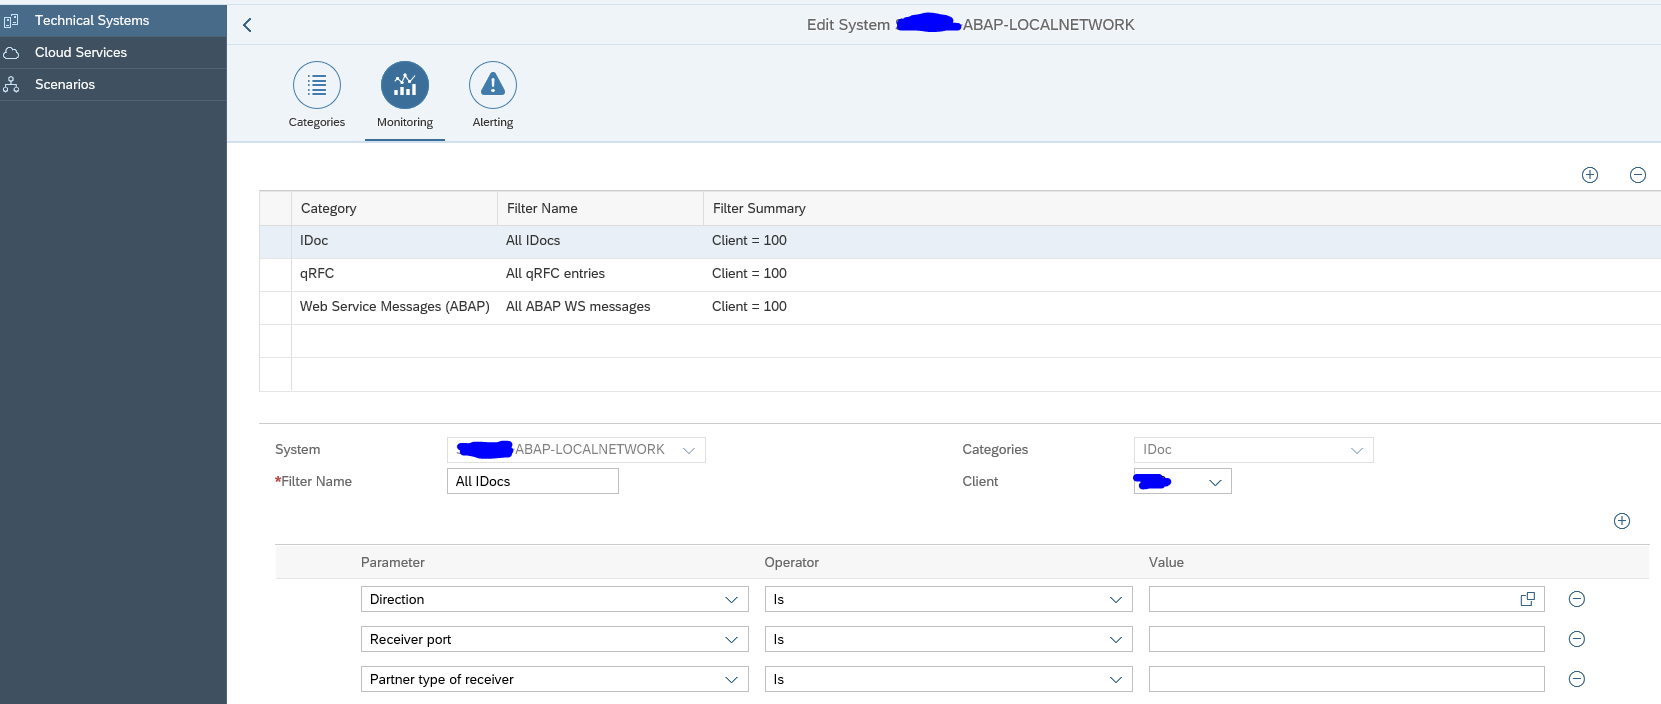
In the configuration for interface monitoring in the Technical System settings, goto the monitoring part and activate the data collection for Idoc monitoring:

In the monitoring filter, you can restrict the data collection to certain idoc types, receivers, senders, etc. Or leave all entries blank to check every idoc:

Alerting for errors

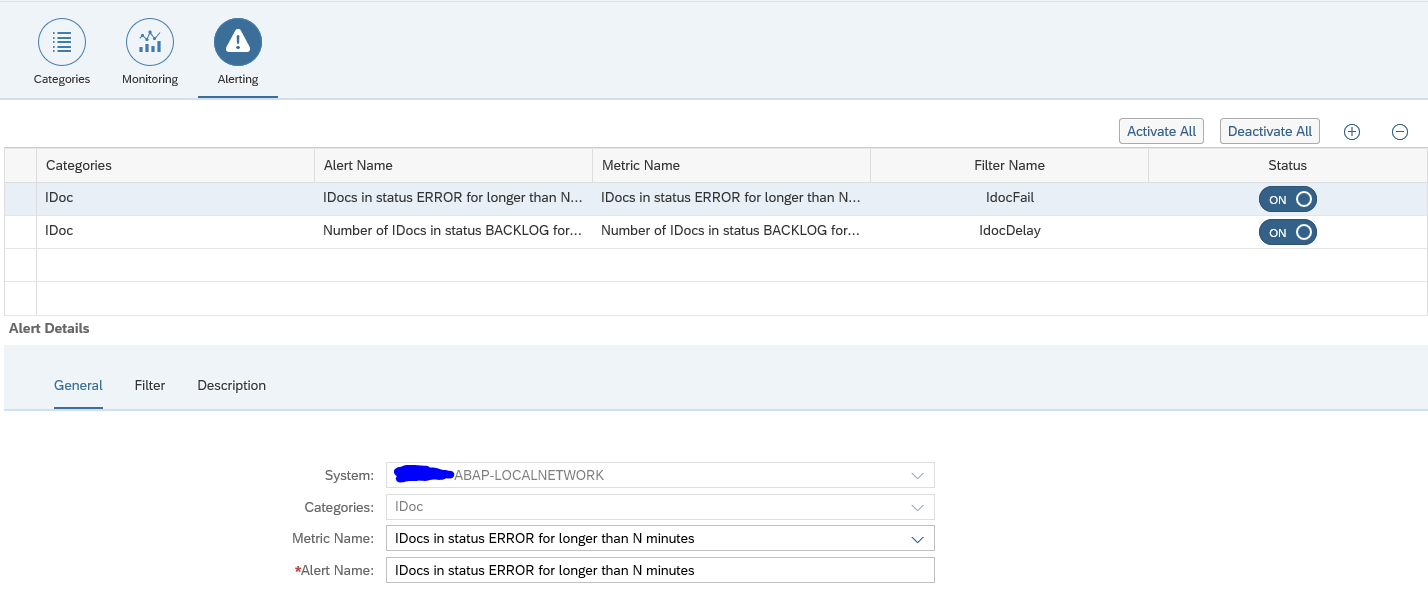
First alert we set up is the alert for errors.

Create a new alert and select the alert for idocs in status ERROR for longer than N minutes:

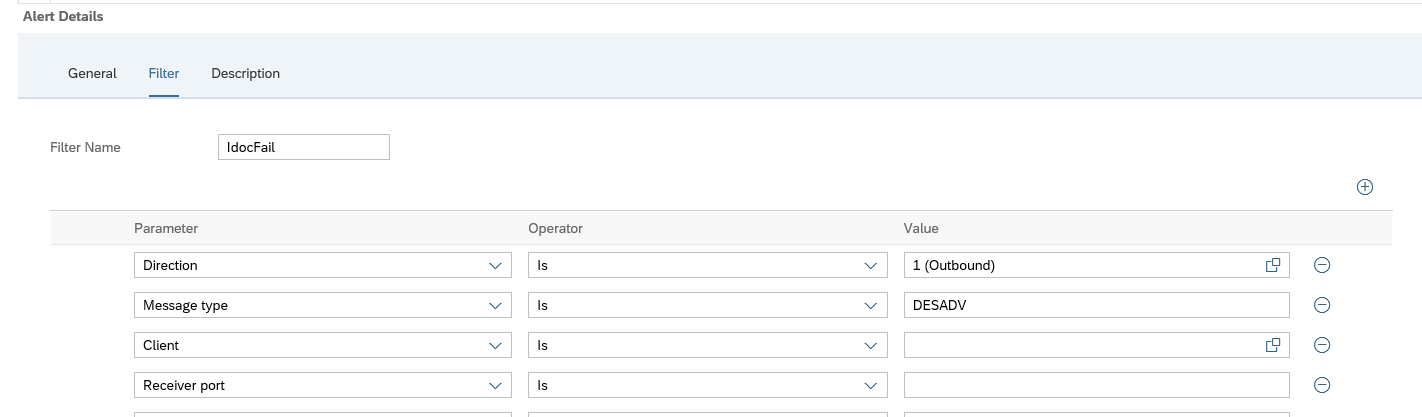
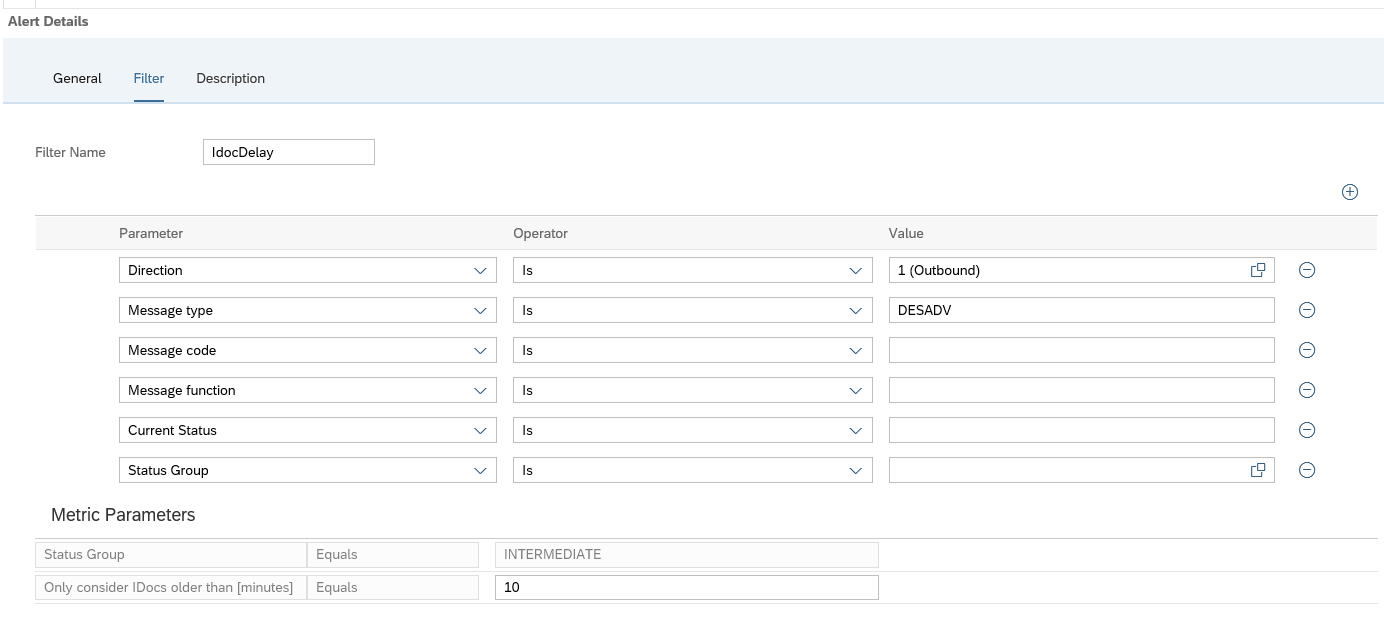
Now we add the filter. In our case we filter on outbound idocs of type DESADV:

A bit hidden at the bottom of this screen is the setting for the N for the minutes:

The time setting is depending on your technical setup of idoc reprocessing jobs (see for example this blog), and the urgency of the idocs for your business.

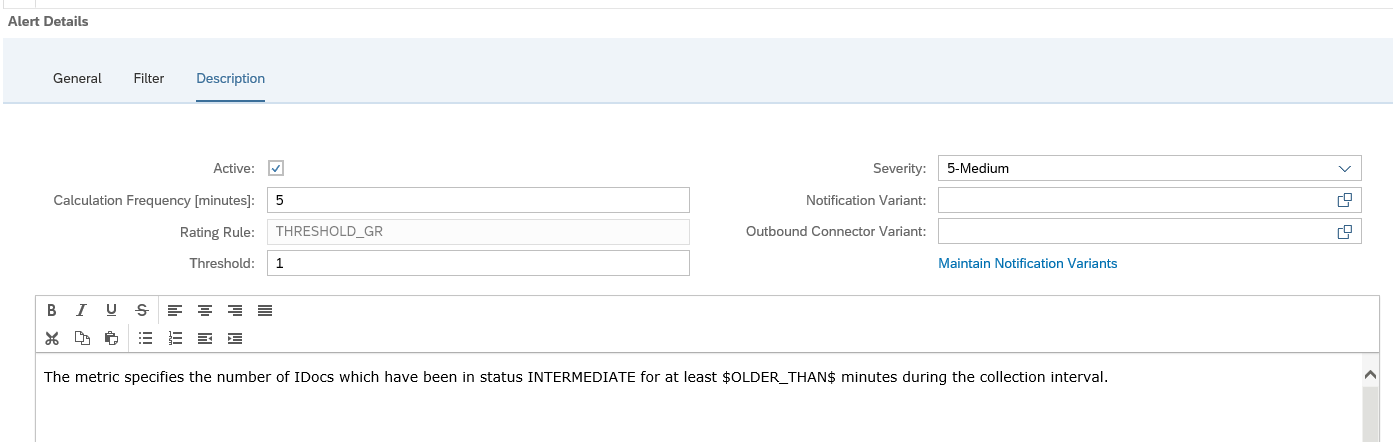
In the description tab add the notification variant in case you want next to the FRUN alert also mail to be sent (setup is explained in this blog):

You can set up multiple alerts. This means you can have different notification groups for different message types, different directions, different receiving parties.

Save the filter and make sure it is activated.

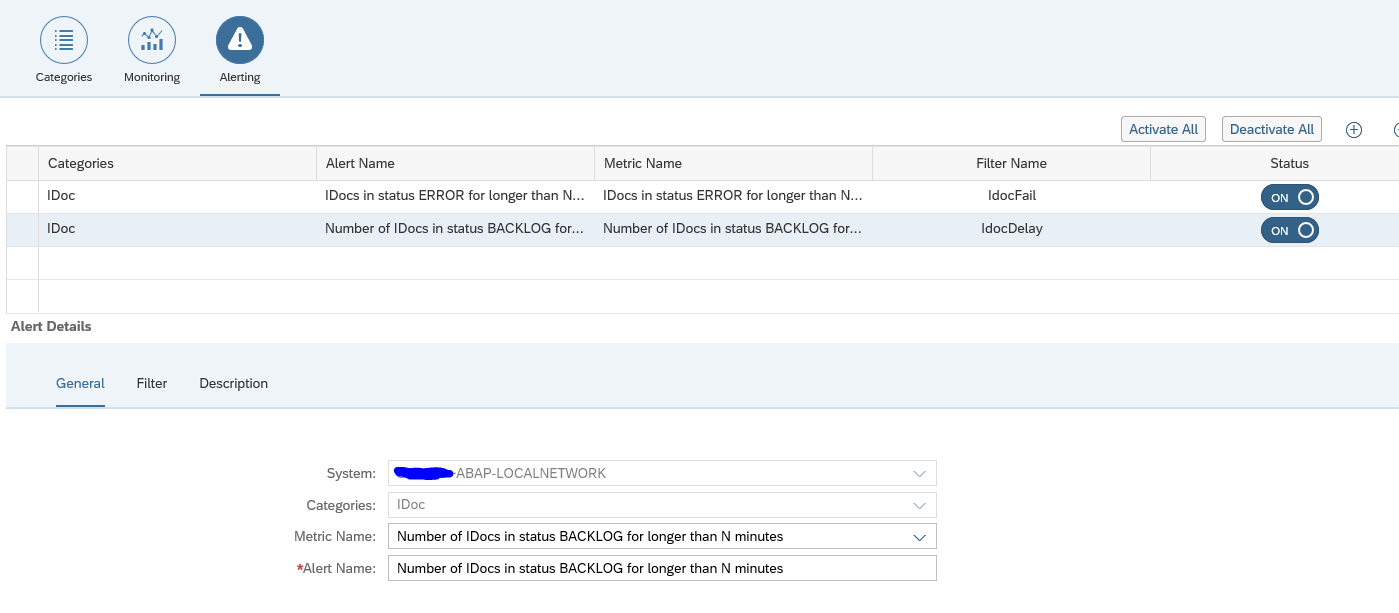
Alerting for Backlog

Next to alerting on errors, Focused Run can also alert on delay of idocs. This can be done for both inbound and outbound idocs.

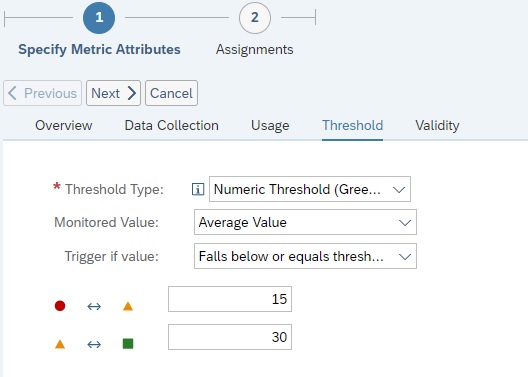
To set up an alert for backlog choose the option idocs in status BACKLOG for longer than N minutes:

In the filter tab set the idoc filter and at the bottom fill out the value for N minutes of backlog that should be alerted:

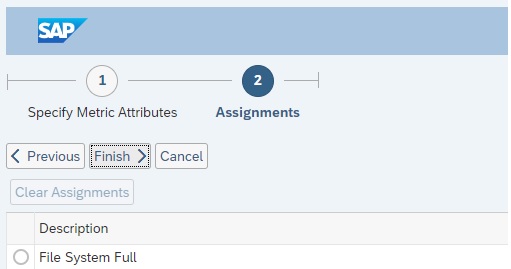
And in the final tab set the notification variant if wanted:

Save the filter and make sure it is activated.

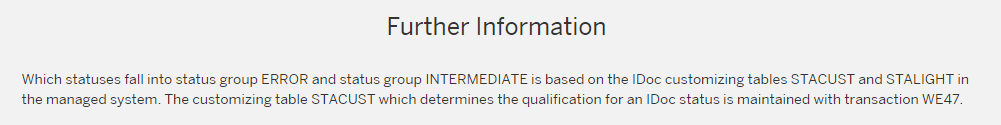
Determination of delayed and error idocs

On the SAP Focused Run expert portal on idocs, there is this definition of the determination of idocs in delay and error:

Graphical modelling

The graphical modelling of idoc monitoring is identical in principle as with RFC and qRFC. You can read the set up in these two blogs: qRFC and RFC modelling.

Data clean up

If you get too much data for idoc monitoring, apply OSS note 3241688 – Category wise table cleanup report (IDOC, PI). This note delivers program /IMA/TABLE_CLEANUP_REPORT for clean up.

Monitoring Host Agent PSE Certificate Expiry…

Purpose

You have configured SSL for enabling secure connections to SAP Host Agent. In such a case you need to regularly update or extend the validity of the SAP Host Agent PSE certificate. With Focused run System Monitoring you can create custom metric for monitoring SAP Host Agent PSE certificate expiry.

Setup

Step1: Navigate to Host Template maintenance

SAP Host Agent resides at OS level of each host of systems that you are monitoring using Focused Run. Hence you need to monitor the PSE certificate for SAP Host Agents of each host in your customer network.

In our recent blog we have explained how you can configure URL Certificate monitoring in Health Monitoring in SAP Focused Run. However configuring certificate monitoring for each SAP Host Agent in your customer network using Health Monitoring will be very cumbersome.

An easier way will be to setup a custom metric in the host level system monitoring template which when activated will be automatically applied to all hosts for which the monitoring template is used.

For template maintenance you can navigate to System Monitoring Template Maintenance app on the Focused Run launch pad.

In the template maintenance app navigate down to the Host (Server) node and then to the respective template which you want to edit and click on Edit button.

Step2: Create Custom Metric

In order to create a custom metric you need to activate expert mode. For this click on the Expert Mode button as shown below.

After enabling expert mode you can click on Create button. Select Metric in the drop down from Create button.

In the Metric creation pane, under Overview tab enter the details as shown below.

Then in the Data Collection tab, provide the details as shown below.

For the URL field you need to mention the URL https://$SAP_ComputerSystem.FQDName$:1129/SAPHostControl/?wsdl in which the expression $SAP_ComputerSystem.FQDName$ will dynamically resolve the respective FQDN of the host picked up from LMDB. Hence it is important to select the check box under Placeholder and select LMDB under Placeholder type.

Then navigate to the Threshold tab and provide the threshold as shown below. In this example the threshold is Yellow if certificate is expiring in 30 days and Red if its expiring in 15 days.

Then click on Next button to navigate to the Assignment tab where we assign this metric to an existing alert. In this step just click on the Finish button to save the metric. In this step we don’t assign to any alerts yet as we are yet to create a custom alert for this custom metric.

Step3: Create custom Alert and assign to custom Metric

In the expert mode maintenance go to the Create button and then from the drop down select Alert.

Enter the details as shown below and click on Next button.

Then in the Assignments tab you will see the custom metric you just created. Select the check box for this metric and click on Finish to save the alert.

Now your custom metric is ready together with alerting active.

To activate this template update on all hosts navigate to Managed Objects tab for the template and click on Apply and Activate button.

Upon activation the new metric will be available in system monitoring as shown below.

For more details on how to setup SSL for SAP Host Agent you can refer to the SAP documentation here.

IT Calendar access for Non-SAP Focused Run Users…

The work mode management function is use to maintenance. During the maintenance the alerts are suppressed. The same information can also be made generally available to serve as a IT calendar for all interested persons. This can be people for the IT department and the business. These users are mainly interested in planned downtime of the IT systems.

Use of the IT calendar for non-SAP focused run users

After the setup each person can now use this URL:

https://<host>:<port>/sap/bc/ui5_ui5/sap/itcal_external/index.html? FILTER_VARIANT=<public_variant-name>&sap-client=<client>

End result looks like this:

Setup of IT calendar access for non-SAP focused run users

The basic steps are described in OSS note 2926433 – IT Calendar access to Non-SAP Focused Run Users.

Create a system user with copy of role SAP_FRN_APP_ITC role and update it with the UI5 application “itcal_external”(IWSG and IWSV).

Also add these 4 not documented authorizations:

Display for service availability management:

Display for work modes:

Add generic services:

Add filter bar rights:

Activate these 2 SICF services:

  • /default_host/sap/bc/bsp/sap/itcal_external
  • /default_host/sap/bc/ui5_ui5/sap/itcal_external

On the Logon tab of these 2 services set the user ID and password of the newly created system user.

Do the same for the external system alias /sap/itcalnonsolman (also in SICF transaction): also here set the user ID and password for the newly created system user.

After settings are done, execute testing. Most issues are coming from lack of auhtorizations.

OSS notes

Relevant OSS notes:

URL Availability Monitoring in Health Monitoring…

SAP Focused Run Health Monitoring helps us to extend monitoring capabilities to Non SAP world. It provides us with many monitoring functionalities like URL Availability & Performance monitoring, URL Certificate Monitoring, OS Script Monitoring, OS Process Monitoring & Logfile Monitoring . We can activate these monitoring functionalities whether its a SAP or Non SAP application

Health Monitoring provides a functionality called Availability Monitoring wherein we can monitor:

  1. HTTP Availability: Monitoring availability of URLs.
  2. TCP Availability: Monitoring the availability of a TCP port or the availability of a host.
  3. RFC Availability: Monitoring availability of RFCs specifically for measuring availability of an application server instance of an SAP system or the availability of a message server port of an SAP system.

In this blog we will explain how you can configure a HTTP Availability monitor to monitor availability of a URL.

Setup

Step1: Assign Agent for data collection

The HTTP availability is measured by making a URL http or https call by a designated Simple Diagnostic Agent from your specific customer network in the Focused Run system.

The first step is to assign a Simple Diagnostic agent as the collector for this metric.

For this open the Health Monitoring App from the Focused Run launchpad.

Navigate to Configuration area by clicking on the button.

Expand the Customer Networks node and click on the button.

In the next popup select the agent from the list of all connected agents to this customer network.

Step2: Configure HTTP Availability Metric

In the Configuration area expand the metric node and click on the button for Availability under Metrics node.

In the next pop-up screen click on the button to add a metric.

In the next pop-up screen select HTTP Availability

Enter the following details for a basic URL Availability check.

FieldDescription
Metric NameA descriptive name for the metric
Customer NetworkSelect the customer network for which you want to create the metric
Collection FrequencySpecify the collection frequency, how frequently the check should be performed.
URLEnter the URL to be monitored
ProxyEnter the proxy detail if the URL is reached via a proxy from the customer network. Else select None.
AuthenticationEnter the authentication type None or Basic or oAuth and enter the details based on authentication type.
TimeoutPeriod in milliseconds (ms) before a call fails.
Number of RetriesNumber of times the data collector calls a URL until it receives a response.

You can also further customize based on type of call you want to do to the URL for instance sending a POST request. For details you can refer to the SAP documentation here.

Optionally you can also enable alerting and notification in the Alert section of the configuration.

After entering all the details save your configuration to activate the metric.

Monitoring

To navigate to the URL availability monitors you can click on the Availability button in the navigation panel.

Or you can also navigate from home screen.

Upon navigating to the Availability monitor metric list you will see the status of all URL availability metrics configured. The metric list view shows us the number of days and hours since the URL is available or unavailable. It also shows us the response time when accessing the URL.

This way you can not only monitor the URL availability but also the performance of an URL with regards to the response time while accessing the URL.

Performance analysis in System Analysis…

In the system analysis function there is a special function to monitor system performance based on ST03 system data from the managed system.

This blog will explain how to setup and use this data.

Performance analysis

Start on the System Analysis tile:

Now choose the menu option for ABAP performance:

The performance overview will now open:

You can click on many items now to get to the details.

Setup of Performance Analysis

Before the above works, the click on the settings wheel and click on the Configure Collection of ABAP performance data:

Make sure the system you need analysis data from is activated correctly.

If the data collection is not ok, check the Collector Status button and Agent logs. Also check the backend system user used to see if this user has sufficient authorization to fetch the required data.

Central SSL Certificate Monitoring in SAP Focused Run…

Purpose

You can configure monitors to monitor the SSL certificate of a URL using Health Monitoring functionality in SAP Focused Run system. This monitor measures the remaining validity (in days) of a SSL certificate for a https call to a URL. The URL is called by Simple Diagnostics Agent of a designated host in your customer network.

In our previous blog, we have shown how you can monitor availability of critical OS processes via Health Monitoring.

The Health Monitoring app also provides a separate section called as URL Certificate Monitor where in you can centrally monitor expiry of SSL certificates of any https URL.

To navigate to URL Certificates monitor you can click on the URL Certificate button as shown below in the navigation panel of the app.

Setup

To configure URL Certificate monitors , navigate to the Configuration area, expand the Metrics node and click on the change button.

In the popup window click on the Add Metric.

In the Metric Configuration window enter the following details in the General tab.

FieldDescription
Metric NameA meaningful name to the monitor
URLURL whose certificate to be monitored.
Proxy URL (Optional)The Proxy URL if the URL is accessible via a proxy URL
Customer NetworkThe Customer Network to which this URL belongs. The designated SDA from this customer network will be performing the check.
Technical System (Optional)You can optionally link this monitor to a specific cloud service you have registered in your LMDB. This is the Cloud Service you would have created if you are using AIM scenario for Cloud Service Monitoring. Select from the drop down.
Collection IntervalFrequency of data collection. Select from available options.
ThresholdThreshold for remaining days for expiry. By default 200 Days for Yellow and 100 days for Red.

Additionally and optionally in the Alert Settings tab you can activate alerting and notification settings as shown below.

That’s it, now your monitor is active. To monitor navigate to the URL Certificate tab in the Health Monitoring App .

You can also refer to this SAP documentation to know more about various features available with Focused Run Health Monitoring.

System monitoring custom metric for errors in table locking of TBTCO…

From availability perspective, you want to detect as quickly as possible if you are suffering from locking errors of table TBTCO. TBTCO table is used for printing. If the locking error situation occurs the printing function will fail, and even worse, it can impact the complete SAP ABAP system.

You can create a custom monitoring metric to measure and act on this.

Creation of the custom metric for errors in table locking of TBTCO

Create a custom metric following the steps in this blog. The template to be adjusted is the technical instance SAP ABAP 7.10 and higher template.

Don’t forget to tick it on for monitoring otherwise it is not active.

In expert mode create a custom metric.

Create technical name Z_METRIC_ERR_LOCK_TBTCO:

In the data collection:

Data to enter: RFC on diagnostics agent (push). Select ABAP System Log Stats. Filter on message text *TBTCO*. This captures severe errors for TBTCO like the locking error.

Define the threshold for alerting:

And assign the metric to the ABAP Instance not available alert group:

Monitoring critical OS processes through Health Monitoring…

SAP Focused Run Health Monitoring helps us to extend monitoring capabilities to Non SAP world. It provides us with many monitoring functionalities like URL Availability & Performance monitoring, URL Certificate Monitoring, OS Script Monitoring, OS Process Monitoring & Logfile Monitoring . We can activate these monitoring functionalities whether its a SAP or Non SAP application

With OS Process Monitoring functionality we can monitor the availability of critical OS level processes on any host.

With System Monitoring templates you can also activate custom metric for monitoring OS processes however this will be applicable for all system/hosts for which you activate the template.

For monitoring critical OS processes for specific hosts you need to setup using Health Monitoring functionality.

To access Health Monitoring functionality you can navigate to Health Monitoring app in the Focused Run launch pad.

Prerequisite

The only prerequisite for configuring OS process monitor in Health Monitoring is that you should have registered the host and deployed Simple Diagnostic Agent (SDA) on the host where you want to monitor the critical process.

Setup

For setting up the OS process monitor you need to navigate to the settings page of the Health Monitoring App.

In the settings area expand the metrics node and click on the pencil button (Edit Metric) for OS Processes.

In the OS Process edit metric screen click on Add Metric button to start creating the OS Process Metric.

In Add Metric screen enter the following details

FieldDescription
Process NameName of the OS process. This parameter needs to be maintained as a regular expression. SDA will use this expression for searching for the respective OS process at OS level.
User (Optional)You can further restrict the search for processes running through a specific user. You need to enter the name as a regular expression
Command Line (Optional)You can further restrict by the specific command line with which the process is running . This is specifically useful if there are multiple processes running with the same name but you want to monitor the process which is running with a specific argument or parameter. This also needs to be maintained as regular expression.
HostnameName of the host where the process to be monitored. You can select from a list of all hosts connected (also SDA deployed) to the Focused Run system.

In the General Settings tab you can also specify the data collection frequency and the threshold. By default 5 minutes frequency and Already Rated threshold is set.

Optionally you can update the alert settings for this metric in the Alert Settings tab. By default alerting is active with medium severity.

After entering all details, to activate the metric click on Save button.

You can monitor all you OS process metrics in the OS Processes tab of the Health Monitoring App.

System monitoring custom metric for message server disconnects…

From availability perspective, you want to detect as quickly as possible if you are suffering from message server disconnects.

You can create a custom monitoring metric to measure and act on this.

Creation of the custom metric for message server disconnects

Create a custom metric following the steps in this blog. The template to be adjusted is the technical instance SAP ABAP 7.10 and higher template.

Don’t forget to tick it on for monitoring otherwise it is not active.

In expert mode create a custom metric.

Create technical name Z_MESSAGE_SERVER_DISCONNECT:

In the data collection:

Data to enter: RFC on diagnostics agent (push). Select ABAP System Log Stats. Filter on message number Q0L, Q0M and Q0N. Any of those indicate message server errors. For more information on system log messages, read this blog.

Define the threshold for alerting:

And assign the metric to the ABAP Instance not available alert group: