Identifying all grey metric in System Monitoring…

In SAP Focused Run there is no standard mechanism to identify and display all grey metrics in System Monitoring, a grey metric can cause critical situations not being captured and alerted in monitoring hence we need to monitor such grey metrics.

In this blog we explain how you can list all the grey metrics by directly reading from database tables that store the monitoring data.

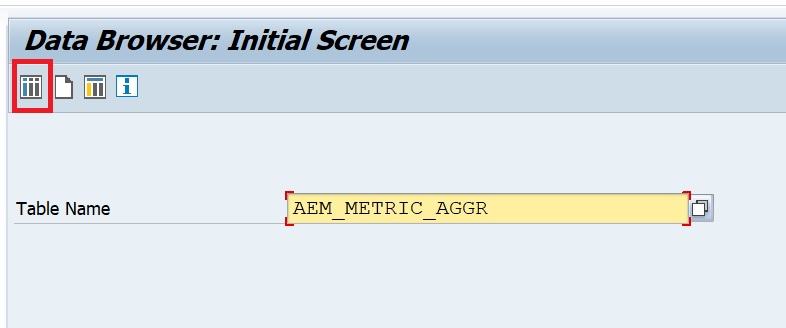
Focused Run system monitoring metric aggregate data is stored in table AEM_METRIC_AGGR. We can filter on metric status = Grey to see the list of grey metrics.

Open the table in transaction SE16:

Increase the width and no of hits and click on execute

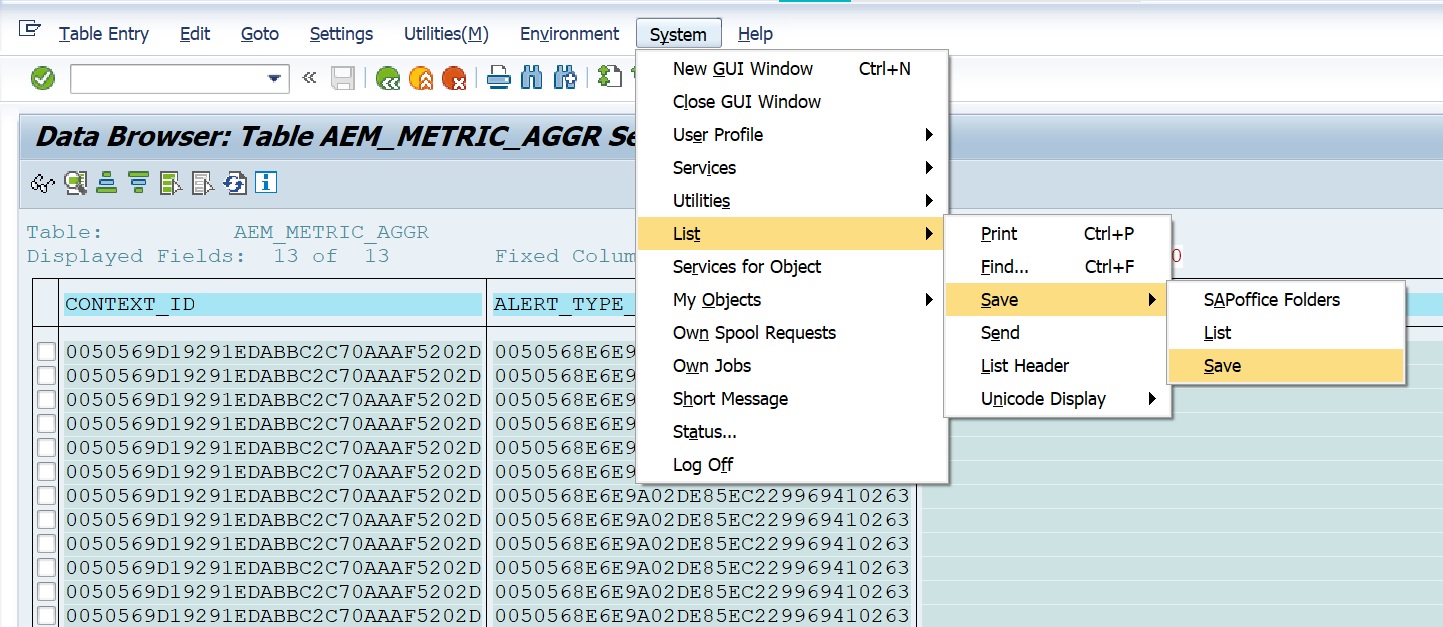
Now you have all the data that you can export to an excel sheet. For this select the following menu option.

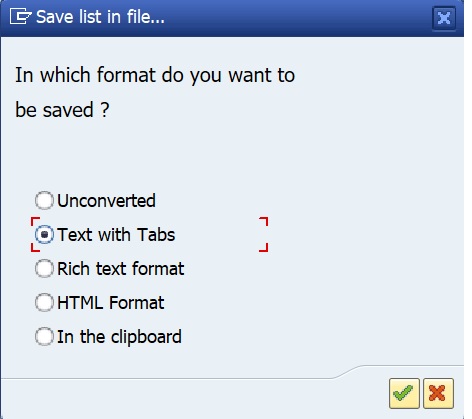
Select file type as Text with Tabs.

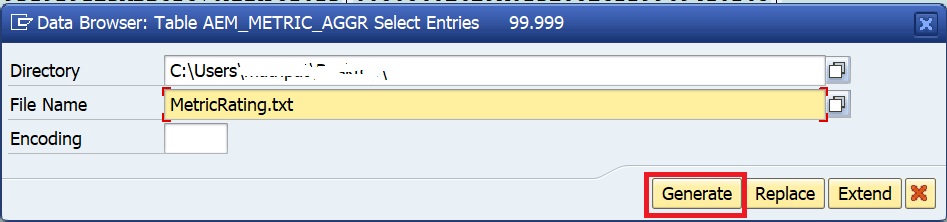
Provide the path and filename to save the file and then click on Generate button.

Now open the .txt file in MS Excel.

In the Home tab select option for filtering as shown below

Now set the following filter for the column LAST_RAT

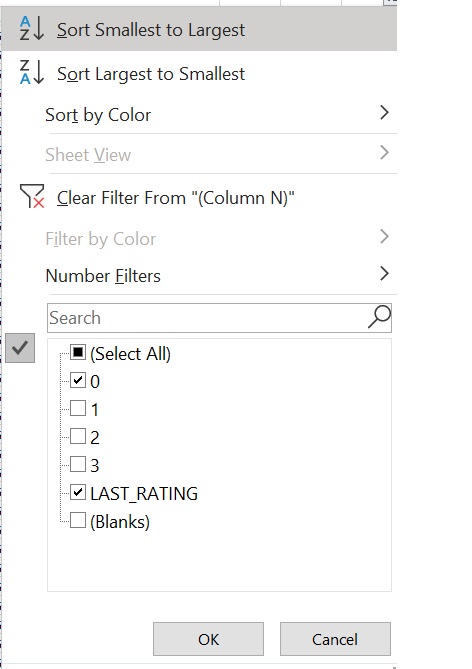
Now you will get the list of all grey metrics as shown below.

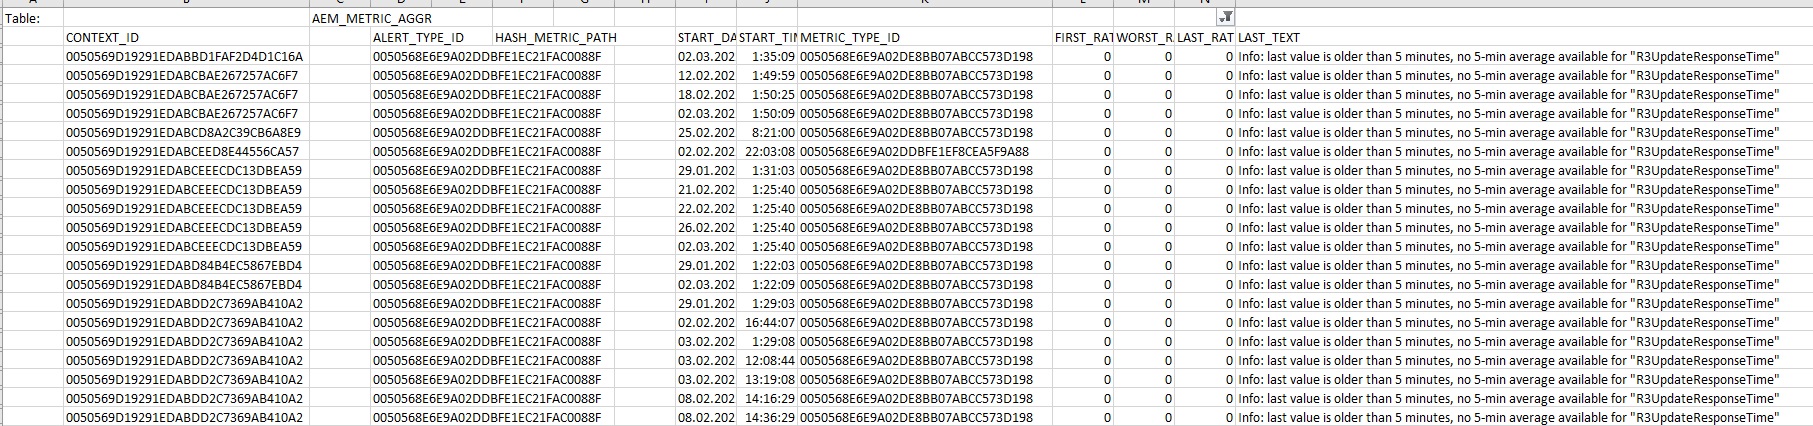
Note: The Context_ID value will give you the ID of the managed object, Metrtric_type_ID will give you the ID of the metric name and the Last_text will give you the return text of the last data collection which will give you the reason for grey metric.

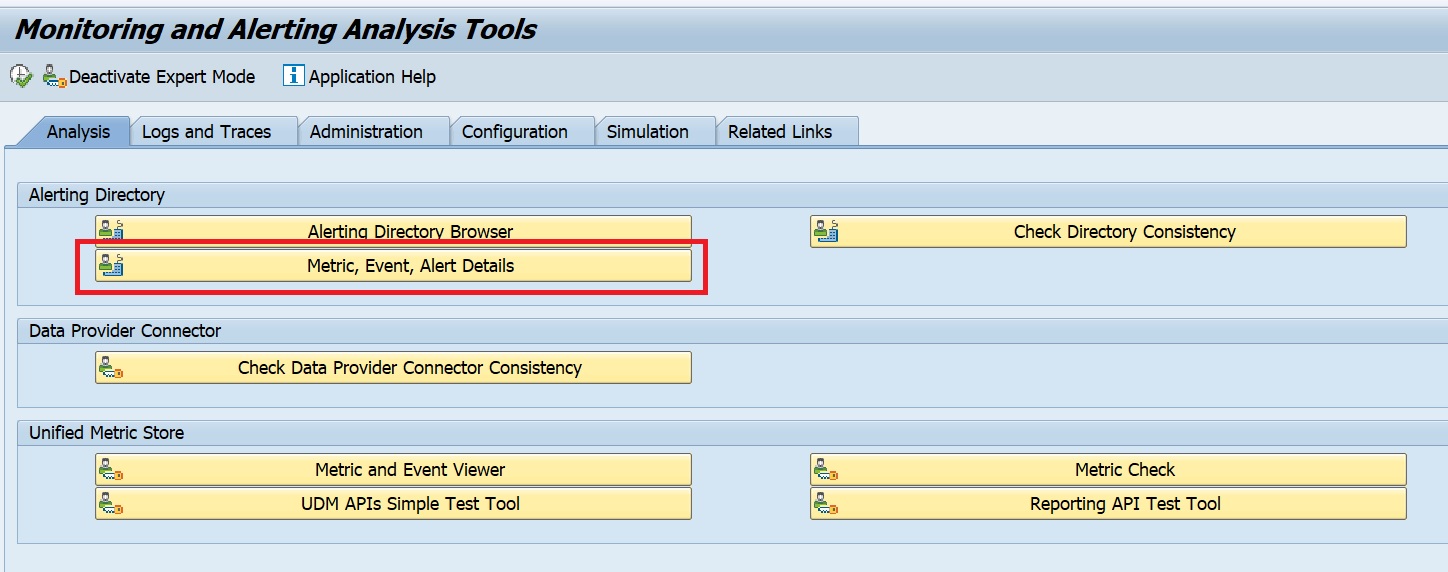
In order to get the managed object name and metric type you can use the following in transaction MAI_TOOLS –> Metric Event Alert Details.

In the selection screen for Managed Object ID enter the Context ID from the excel and for Metric Type ID enter the same from the excel. Also select the checkboxes as shown below and execute.

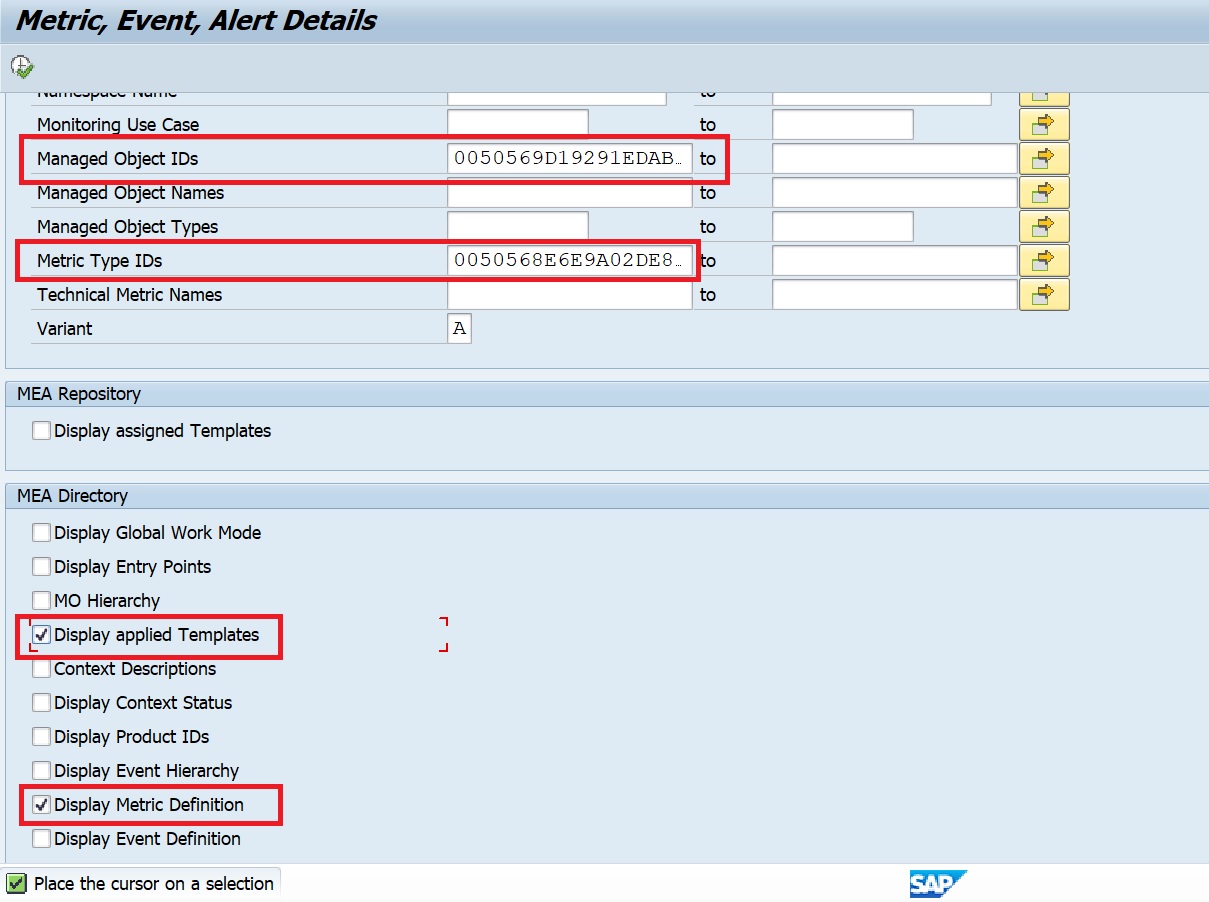
Now you will get the info on the Template as well as the Metric name which is currently in grey.

SAP instructions

You can also check the instructions from SAP in OSS note 2859574 – How to list all current Grey Metrics in FRUN.

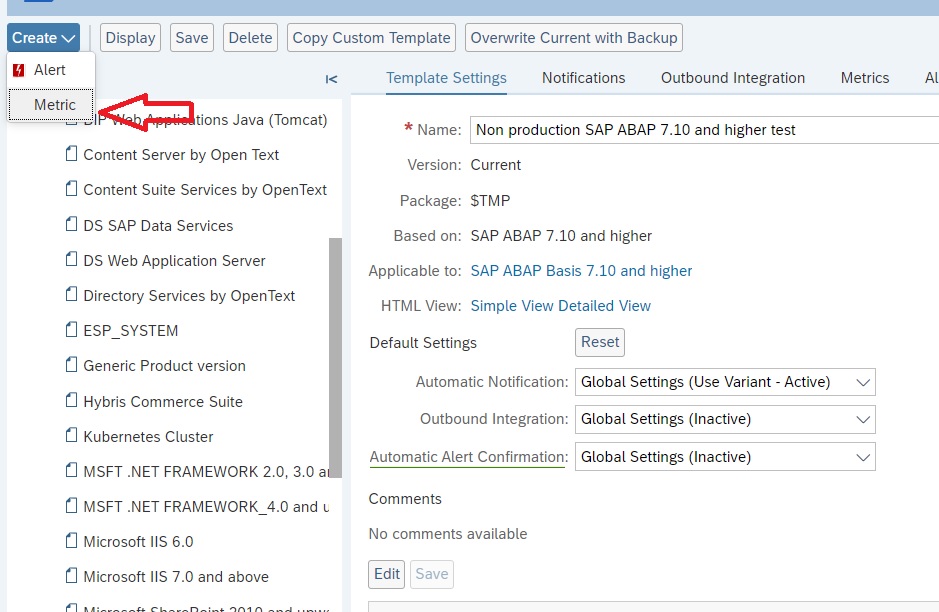
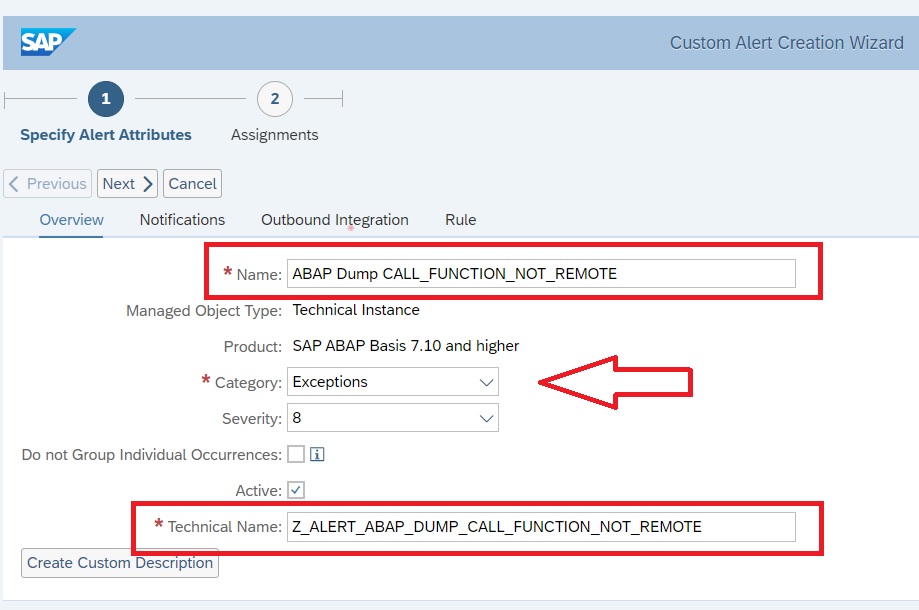
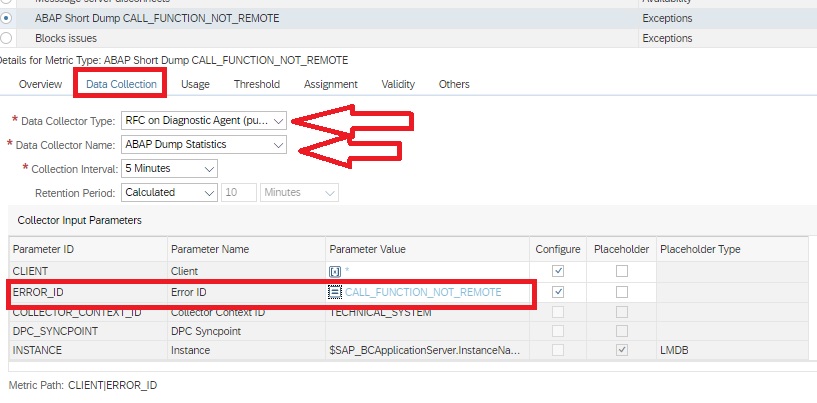
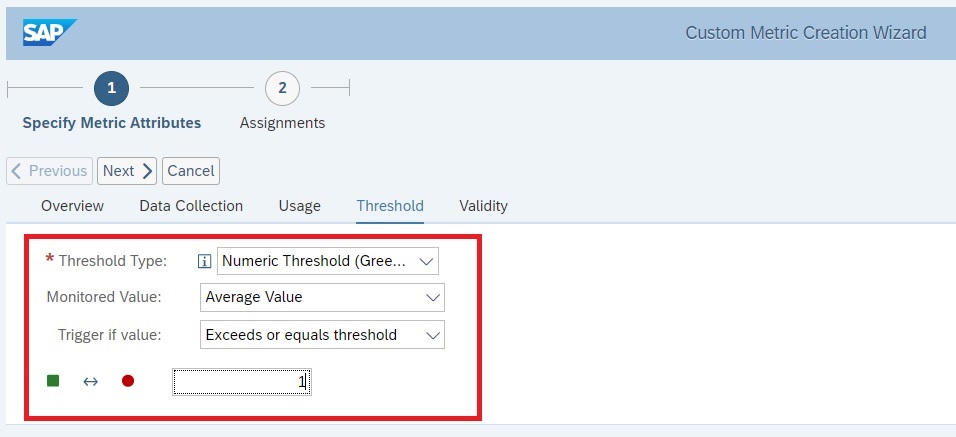
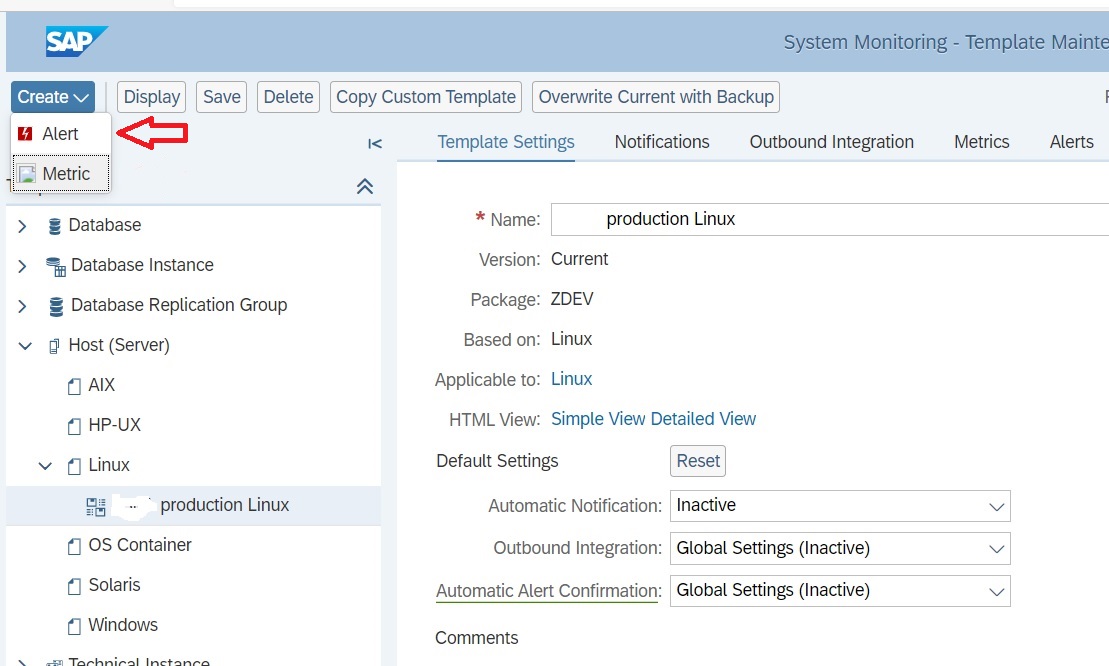
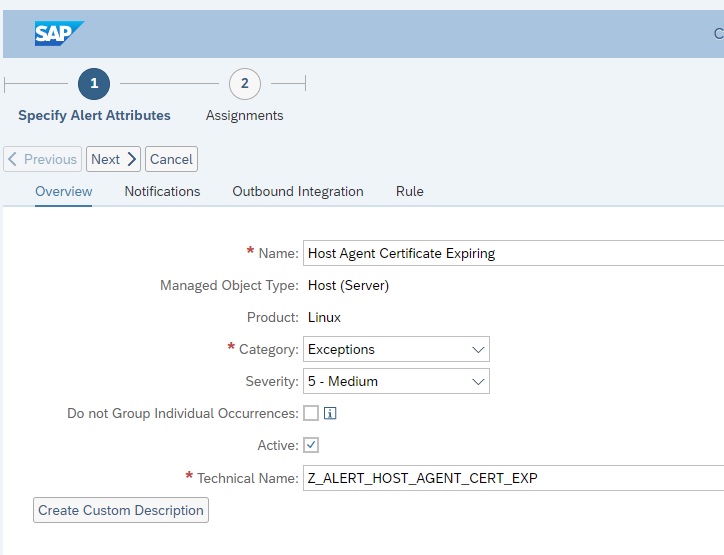
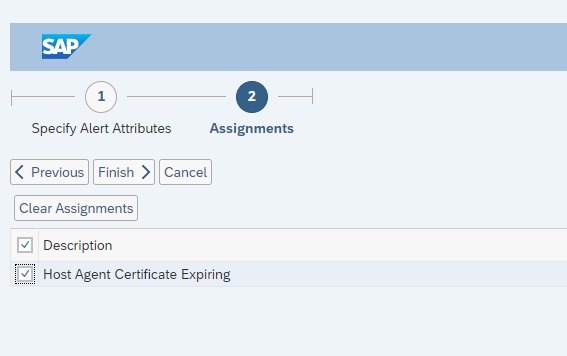
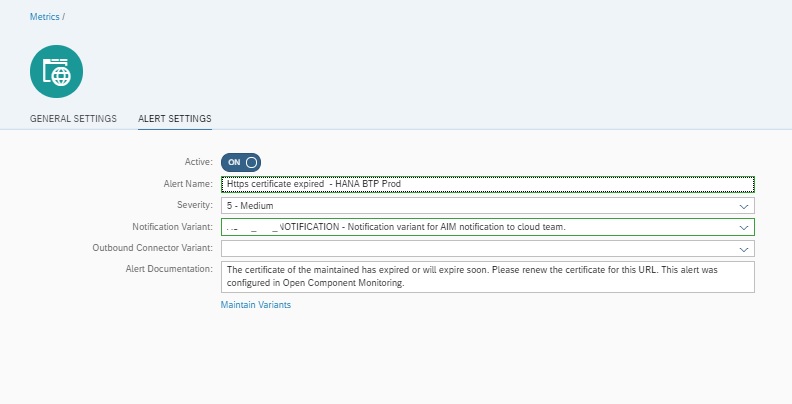
Alerting on important grey metrics

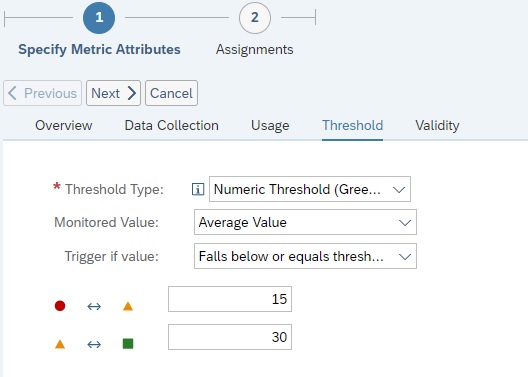
If a critical metric turns grey (meaning it can be good, or bad), you can set a specific alert when this happens. For example Oracle system in stalled mode might turn grey in stead of red. In this case grey is the same as red: system will not work.

For setup instructions: read this dedicated blog.

ABAP Short Dumps Trend Analysis in SAP Focused Run…

We can use SAP Focused Run OCC Dashboards to build a ABAP Dump Trend Analysis dashboard.

Using OCC Dashboard we can use the data provider for System Monitoring to pull the data of Short Dumps per day metric in to a trend chart.

For accessing the OCC Dashboards app click on the OCC Dashboards App in the Advanced Analytics & Intelligence section of the Focused Run launchpad.

In the OCC Dashboard app you can create a new dashboard page by clicking on Add Custom Page in the navigation panel.

By default your new page will be named as custom_page, you can rename your page by clicking on Rename in the settings section and then providing a new name.

In the View Management section of the settings area you can modify the grid layout. By default you have 2 columns in 1 row. In this example we will change to 1 X 1 to keep just the ABAP Dump Trend Analysis dashboard. (Note: we can add a dashboard to each grid in the layout).

Now for adding the dashboard to the pane we just created, we click on the settings button for that pane.

Then in settings area, under View Personalization –> Render we select the graph type. In this case we want to perform a trend chart so we select Line Chart.

Now we need to create a query for the chart that would provide the data for our graph. For this in the Query section we click on the + sign to add a query.

Now in the Query Section, for the newly added row you provide a name under Legend and then click on the change button to start editing the query.

In the Query Editor screen select the data provider System Monitoring.

Now we navigate to the Scope Selection tab to select the managed systems for which the dashboard should display data. In this example we selected System Type as Application Server ABAP and IT Admin role as Production to select all ABAP production systems.

Now in the Default tab , under Extended SID select any ABAP system and then under Metrics tab select the metric Number of Short Dumps (Today). Click on Apply button to activate the selection.

Now you can see the ABAP Dumps trend lines for the selected scope of managed systems in the graph.

Note: By default a graph for System Monitoring data provider will select Auto resolution of data which will show the data for today with hourly frequency.

You can change the resolution in the Time Range Section in the Settings area. For example here we set Period for last 30 days as “l30d” and Granularity for every day or daily as “d”.

Note: OCC Dashboard graphs will always average out the data as per the granularity set for the graph w.r.t actual collection frequency of the selected metric. For instance if the metric Number of Short dumps (Today) has a hourly frequency and we show the daily data in the graph, then the value shown in the graph will be average of all hourly data collected by the metric for that day, which will of course be different from the actual final daily count. Hence to ensure data shown on graph is accurate, ensure that the Number of Short Dumps (Today) metric has a daily frequency. Then the granularity of the graph and the metric data collection frequency being exactly same, both will have the exact same and accurate data.

To know more abut OCC Dashboards and all possibilities with it you can refer to SAP Documentation here.

Monitoring Specific ABAP Dumps in System Monitoring of ABAP System…

In System Monitoring of ABAP systems in Focused Run, with the standard monitoring template, we can monitor the frequency of ABAP dumps.

For monitoring if there are dumps of a specific type we have to create a custom metric. In this blog we explain how.

For creating a custom metric in the monitoring template, open the Template Maintenance App in the Advanced System Management area of Focused Run Launch-pad.

Note: You can’t add a custom metric to a SAP delivered standard template. For that you will have to copy the standard template to your own custom template.

Open your custom ABAP instance level template in edit mode.

Switch to expert mode for template maintenance.

Click on Create –> Metric to create a custom metric.

Provide a Name, a Technical Name and metric type in the Overview tab as shown below.

In the Data collection tab enter details as shown below. Here for the parameter Error_ID you can provide the ID of the specific ABAP dump that you want to monitor.

Navigate to Threshold tab to specify the Threshold type and Threshold. For instance in this example we have specify the threshold to rate the metric as reed if there is 1 or more of the specific dump.

Now you can click on Next and then Finish button to save the metric.

Next you need to create a custom alert to generate a specific alert for this specific dump.

In the expert mode maintenance go to the Create button and then from the drop down select Alert.

Enter the details as shown below and click on Next button.

Then in the Assignments tab you will see the custom metric you just created. Select the check box for this metric and click on Finish to save the alert.

Now your custom metric is ready together with alerting active.

To activate this template update on all managed systems navigate to Managed Objects tab for the template and click on Apply and Activate button.

Now you can see custom metric under instance level in system monitoring.

Connecting Managed Systems to Multiple Focused Run Systems…

You may need to connect the same managed system to more than one Focused Run System. For instance, connecting a sandbox managed system to a development Focused Run system for test purpose and to a production Focused Run system where it is actually monitored.

In our previous blogs we have explained how you connect an SAP ABAP or SAP JAVA system to a focused run system and perform the Simple System Integration (SSI).

For connecting the same system to one more Focused Run system you basically need to perform the same steps again but this time targeting to the new Focused Run systems.

  • Perform host outside discovery to register the host on focused run system. Execute the following commands using the credentials of the new focused run system to which you want to connect the managed system.
    1. ./saphostctrl -function  ConfigureOutsideDiscovery -enable -sldusername FRN_LDDS_<SID> -sldpassword xxxxxxxxxx -sldhost <FRUN Hostname> -sldport <FRUN http port>
    2. ./saphostctrl  -function  ExecuteOutsideDiscovery -sldreg
  • On the new Focused Run system agent administration configure the agent on the host you registered in previous step..
    1. Install/Update Agent

2. Configure Agent

Note: The agent installation will not deploy a new SDI binary to the hostagent in this case as there is already a SDI in the host agent coming from the previous Focused Run system. However the installation step will simply link the new Focused Run system to the existing SDI by pushing its new configuration XML file to the SDI. This you can check by logging on to agent internals.

  • Configure SLDR to send data to both Focused Run Systems. This the most important step that you do differently than connecting the managed system to the first Focused run system. This will ensure data suppliers from managed system get forwarded to both Focused Run systems. Two know more about SLDR setup you can follow the SAP documentation here.

  • Now update the data supplier settings of the managed system to send data to this SLDR .( For example RZ70 in SAP ABAP system and NWA in SAP JAVA system).
  • Now the managed system will be listed in the Simple System Integration app of the new Focused Run system. Configure the SSI of the managed system to enable the managed system in the new Focused Run systems monitoring.

Monitoring Host Agent PSE Certificate Expiry…

Purpose

You have configured SSL for enabling secure connections to SAP Host Agent. In such a case you need to regularly update or extend the validity of the SAP Host Agent PSE certificate. With Focused run System Monitoring you can create custom metric for monitoring SAP Host Agent PSE certificate expiry.

Setup

Step1: Navigate to Host Template maintenance

SAP Host Agent resides at OS level of each host of systems that you are monitoring using Focused Run. Hence you need to monitor the PSE certificate for SAP Host Agents of each host in your customer network.

In our recent blog we have explained how you can configure URL Certificate monitoring in Health Monitoring in SAP Focused Run. However configuring certificate monitoring for each SAP Host Agent in your customer network using Health Monitoring will be very cumbersome.

An easier way will be to setup a custom metric in the host level system monitoring template which when activated will be automatically applied to all hosts for which the monitoring template is used.

For template maintenance you can navigate to System Monitoring Template Maintenance app on the Focused Run launch pad.

In the template maintenance app navigate down to the Host (Server) node and then to the respective template which you want to edit and click on Edit button.

Step2: Create Custom Metric

In order to create a custom metric you need to activate expert mode. For this click on the Expert Mode button as shown below.

After enabling expert mode you can click on Create button. Select Metric in the drop down from Create button.

In the Metric creation pane, under Overview tab enter the details as shown below.

Then in the Data Collection tab, provide the details as shown below.

For the URL field you need to mention the URL https://$SAP_ComputerSystem.FQDName$:1129/SAPHostControl/?wsdl in which the expression $SAP_ComputerSystem.FQDName$ will dynamically resolve the respective FQDN of the host picked up from LMDB. Hence it is important to select the check box under Placeholder and select LMDB under Placeholder type.

Then navigate to the Threshold tab and provide the threshold as shown below. In this example the threshold is Yellow if certificate is expiring in 30 days and Red if its expiring in 15 days.

Then click on Next button to navigate to the Assignment tab where we assign this metric to an existing alert. In this step just click on the Finish button to save the metric. In this step we don’t assign to any alerts yet as we are yet to create a custom alert for this custom metric.

Step3: Create custom Alert and assign to custom Metric

In the expert mode maintenance go to the Create button and then from the drop down select Alert.

Enter the details as shown below and click on Next button.

Then in the Assignments tab you will see the custom metric you just created. Select the check box for this metric and click on Finish to save the alert.

Now your custom metric is ready together with alerting active.

To activate this template update on all hosts navigate to Managed Objects tab for the template and click on Apply and Activate button.

Upon activation the new metric will be available in system monitoring as shown below.

For more details on how to setup SSL for SAP Host Agent you can refer to the SAP documentation here.

URL Availability Monitoring in Health Monitoring…

SAP Focused Run Health Monitoring helps us to extend monitoring capabilities to Non SAP world. It provides us with many monitoring functionalities like URL Availability & Performance monitoring, URL Certificate Monitoring, OS Script Monitoring, OS Process Monitoring & Logfile Monitoring . We can activate these monitoring functionalities whether its a SAP or Non SAP application

Health Monitoring provides a functionality called Availability Monitoring wherein we can monitor:

  1. HTTP Availability: Monitoring availability of URLs.
  2. TCP Availability: Monitoring the availability of a TCP port or the availability of a host.
  3. RFC Availability: Monitoring availability of RFCs specifically for measuring availability of an application server instance of an SAP system or the availability of a message server port of an SAP system.

In this blog we will explain how you can configure a HTTP Availability monitor to monitor availability of a URL.

Setup

Step1: Assign Agent for data collection

The HTTP availability is measured by making a URL http or https call by a designated Simple Diagnostic Agent from your specific customer network in the Focused Run system.

The first step is to assign a Simple Diagnostic agent as the collector for this metric.

For this open the Health Monitoring App from the Focused Run launchpad.

Navigate to Configuration area by clicking on the button.

Expand the Customer Networks node and click on the button.

In the next popup select the agent from the list of all connected agents to this customer network.

Step2: Configure HTTP Availability Metric

In the Configuration area expand the metric node and click on the button for Availability under Metrics node.

In the next pop-up screen click on the button to add a metric.

In the next pop-up screen select HTTP Availability

Enter the following details for a basic URL Availability check.

FieldDescription
Metric NameA descriptive name for the metric
Customer NetworkSelect the customer network for which you want to create the metric
Collection FrequencySpecify the collection frequency, how frequently the check should be performed.
URLEnter the URL to be monitored
ProxyEnter the proxy detail if the URL is reached via a proxy from the customer network. Else select None.
AuthenticationEnter the authentication type None or Basic or oAuth and enter the details based on authentication type.
TimeoutPeriod in milliseconds (ms) before a call fails.
Number of RetriesNumber of times the data collector calls a URL until it receives a response.

You can also further customize based on type of call you want to do to the URL for instance sending a POST request. For details you can refer to the SAP documentation here.

Optionally you can also enable alerting and notification in the Alert section of the configuration.

After entering all the details save your configuration to activate the metric.

Monitoring

To navigate to the URL availability monitors you can click on the Availability button in the navigation panel.

Or you can also navigate from home screen.

Upon navigating to the Availability monitor metric list you will see the status of all URL availability metrics configured. The metric list view shows us the number of days and hours since the URL is available or unavailable. It also shows us the response time when accessing the URL.

This way you can not only monitor the URL availability but also the performance of an URL with regards to the response time while accessing the URL.

Decommissioning Managed Systems…

We need to perform decommissioning of a managed system if

1. The managed system itself has been decommissioned or

2. The managed system is not required to be monitored in the Focused Run system anymore.

Case 1: Managed System is Decommissioned

Step 1: The first step of decommissioning would be to disconnect the Simple Diagnostic Agent from the Focused Run system. For this you can directly uninstall the Host Agent.

You can uninstall by running the following command at OS level

  • UNIX, IBM i: ./saphostexec -uninstall
  • Windows: saphostexec.exe -uninstall

Step 2: Deactivate all monitoring for managed system in Focused Run system

For this in transaction SA38 execute report RSRSM_SSI_CLEANUP

  1. Select a Customer Network
  2. Go to the Cleanup Technical System tab
  3. Select a Technical System
  4. Select the option to Cleanup unused hosts
  5. Press Delete Selected Objects
Case 2: Managed System is not required to be monitored in the Focused Run System

Step 1: You have to ensure the managed system is no more sending landscape data to the Focused Run system. For this disable all SLD data suppliers for the technical system. (In case of ABAP systems its in transaction RZ70 and in case of Java systems its the Data Supplier settings in the NWA.)

Step 2: Disable outside discovery for all hosts of the technical system by executing the following command.

  • UNIX, IBM i: ./saphostctrl -function ConfigureOutsideDiscovery -disable
  • Windows: saphostctrl.exe -function ConfigureOutsideDiscovery -disable

Step 3: Execute the decommissioning report RSRSM_SSI_CLEANUP as mentioned in step 2 of case 1.

For further details you can refer to SAP documentation here.

In addition to the above two cases, you might need to decommission system if the system is being migrated or upgraded to a different or higher version. For example migrating a standard ECC system to S4HANA. Instead of adjusting the monitoring of existing system, you decommission the system and then reconnect the system to Focused Run system. In our future blog we will explain how to decommission in such cases.

Central SSL Certificate Monitoring in SAP Focused Run…

Purpose

You can configure monitors to monitor the SSL certificate of a URL using Health Monitoring functionality in SAP Focused Run system. This monitor measures the remaining validity (in days) of a SSL certificate for a https call to a URL. The URL is called by Simple Diagnostics Agent of a designated host in your customer network.

In our previous blog, we have shown how you can monitor availability of critical OS processes via Health Monitoring.

The Health Monitoring app also provides a separate section called as URL Certificate Monitor where in you can centrally monitor expiry of SSL certificates of any https URL.

To navigate to URL Certificates monitor you can click on the URL Certificate button as shown below in the navigation panel of the app.

Setup

To configure URL Certificate monitors , navigate to the Configuration area, expand the Metrics node and click on the change button.

In the popup window click on the Add Metric.

In the Metric Configuration window enter the following details in the General tab.

FieldDescription
Metric NameA meaningful name to the monitor
URLURL whose certificate to be monitored.
Proxy URL (Optional)The Proxy URL if the URL is accessible via a proxy URL
Customer NetworkThe Customer Network to which this URL belongs. The designated SDA from this customer network will be performing the check.
Technical System (Optional)You can optionally link this monitor to a specific cloud service you have registered in your LMDB. This is the Cloud Service you would have created if you are using AIM scenario for Cloud Service Monitoring. Select from the drop down.
Collection IntervalFrequency of data collection. Select from available options.
ThresholdThreshold for remaining days for expiry. By default 200 Days for Yellow and 100 days for Red.

Additionally and optionally in the Alert Settings tab you can activate alerting and notification settings as shown below.

That’s it, now your monitor is active. To monitor navigate to the URL Certificate tab in the Health Monitoring App .

You can also refer to this SAP documentation to know more about various features available with Focused Run Health Monitoring.

Monitoring critical OS processes through Health Monitoring…

SAP Focused Run Health Monitoring helps us to extend monitoring capabilities to Non SAP world. It provides us with many monitoring functionalities like URL Availability & Performance monitoring, URL Certificate Monitoring, OS Script Monitoring, OS Process Monitoring & Logfile Monitoring . We can activate these monitoring functionalities whether its a SAP or Non SAP application

With OS Process Monitoring functionality we can monitor the availability of critical OS level processes on any host.

With System Monitoring templates you can also activate custom metric for monitoring OS processes however this will be applicable for all system/hosts for which you activate the template.

For monitoring critical OS processes for specific hosts you need to setup using Health Monitoring functionality.

To access Health Monitoring functionality you can navigate to Health Monitoring app in the Focused Run launch pad.

Prerequisite

The only prerequisite for configuring OS process monitor in Health Monitoring is that you should have registered the host and deployed Simple Diagnostic Agent (SDA) on the host where you want to monitor the critical process.

Setup

For setting up the OS process monitor you need to navigate to the settings page of the Health Monitoring App.

In the settings area expand the metrics node and click on the pencil button (Edit Metric) for OS Processes.

In the OS Process edit metric screen click on Add Metric button to start creating the OS Process Metric.

In Add Metric screen enter the following details

FieldDescription
Process NameName of the OS process. This parameter needs to be maintained as a regular expression. SDA will use this expression for searching for the respective OS process at OS level.
User (Optional)You can further restrict the search for processes running through a specific user. You need to enter the name as a regular expression
Command Line (Optional)You can further restrict by the specific command line with which the process is running . This is specifically useful if there are multiple processes running with the same name but you want to monitor the process which is running with a specific argument or parameter. This also needs to be maintained as regular expression.
HostnameName of the host where the process to be monitored. You can select from a list of all hosts connected (also SDA deployed) to the Focused Run system.

In the General Settings tab you can also specify the data collection frequency and the threshold. By default 5 minutes frequency and Already Rated threshold is set.

Optionally you can update the alert settings for this metric in the Alert Settings tab. By default alerting is active with medium severity.

After entering all details, to activate the metric click on Save button.

You can monitor all you OS process metrics in the OS Processes tab of the Health Monitoring App.

Configuring Wily Enterprise Manager for monitoring in SAP Focused Run…

In our previous blog we explained how to configure a SAP Netweaver Java systems for monitoring in SAP Focused Run system. One of the prerequisite for this is to configure the Byte Code Injection (BCI) adapters.

The BCI adapters send the monitoring data to the central Wily EM . The Wily EM then sends the monitoring data to Focused Run System

Configuring Wily Enterprise Manager (Wily EM) for monitoring in SAP Focused Run is required if you monitor following types of systems where many monitoring metrics data is collected by BCI adapters.

  • SAP Netweaver AS Java
  • SAP BusinessObjects Business Intelligence
  • BOE Web Application Server
  • SAP Data Services
  • Apache Tomcat
  • SAP Archiving and Document Access (ADA) by OpenText for Tomcat
  • SAP Invoice Management (IM) for OCR Option by OpenText
  • SAP Convergent Charging
  • SAP Mobile Platform
  • SAP Hybris Commerce Suite

Unlike SAP Solution Manager, no Wily EM is required for monitoring in Focused Run if none of the managed systems use BCI adapters for their monitoring.

For connecting to a SAP Focused Run System the Wily EM installation should be of version 10.5 or higher and the EM Management Module (MM) Packages shall have minimum version MM 10.5 SP02 Patch 0 or higher.

Note: You can have only one Wily EM per customer network, however, if you install an Enterprise Manager Cluster, you can install any number of Enterprise Manager Collector Instances in the same Customer Network.

You can follow SAP Note 797147 for instructions on how to install Wily EM.

Prerequisite

The only prerequisite for connecting a Wily EM to a Focused Run system is that you should have installed host agent on the host of the Wily EM and have configured outside discovery of the host agent to connect to the Focused Run system.

To configure outside discovery of the host agent execute the following command

Execute the below script  from /usr/sap/hostctrl/exe
 ./saphostctrl -function  ConfigureOutsideDiscovery -enable -sldusername <FRUN LDDS or SLDR user> -sldpassword xxxxxxxxxx -sldhost <FRUN host or SLDR host> -sldport <FRUN or SLDR port>

Configuring the WIly EM

To connect the Wily EM to the Focused Run system perform the following steps.

  1. Update IntroscopeEnterpriseManager.properties file setting: introscope.enterprisemanager.name=<virt name>
  2. Restart Wily EM.